1. Introduction
The twentieth century has been a century of unprecedented population growth, economic Development and environment change. From 1900 to 2000, world population grew from 1.6 Billion to 6.1 billion persons.(United nations,2001a).however , while world population increased Close to 4 times, worlds real gross domestic Product(GDP) increased 20 to 40 times (DeLong, 1998), allowing the world not only to sustain a fourfold population increase, but also to do so at vastly higher standards of living. The recurrent theme was the balance between population and natural resources conceptualized as means of subsistence or, more correctly, food and water. Not all theorists saw population growth in a negative light. In particular, mercantilist ideas in Europe during the seventeenth and eighteenth century saw the positive aspects of large and growing populations and favored policies to encourage marriage and large families. Today members of the Julian Simon school also emphasize the positive aspects of large and growing populations (Simon, 1981, 1990, 1996).
Deliberations and actions of the United nations in the area of population, environment and development begun at the founding of the Organization. This topic was the focus of an important debate, at the first meeting of the population commission (now the commission on population and Development) in 1947, and remained a recurrent topic in the work agenda of the Organization , at both the parliamentary and technical levels. In the early years of the United Nations, when world population was slightly more than a third of its present size, environmental issues in relation to population and development tended to be framed in terms of the natural resources needed to sustain population growth and economic development.
In the 1960s, there was an increased awareness that global population growth had reached precedented high levels, a situation that many studies and debates treated as a matter of grave concern. A report of the Secretary General entitled ‘Problems of the human environment’ cited the “explosive growth of human populations’ as first among the portents of a crisis of worldwide scope concerning the relation between man and his environment (United nations,1969).That report was a crucial steps towards the convening by the United nations of the conference on the Human Environment, Stockholm, June 1972, which was the first world intergovernmental conference on the protection of the environment.
The first global, intergovernmental population conference was held in Bucharest in 1974.The world population plan of Action adopted at the United Nations world Population Conference (United Nations, 1975, chap.1) frame the environmental question in terms of per capita use of World resources. The plan urged developed countries to adopt appropriate policies in population, consumption and investment, bearing in mind the need for fundamental improvement in international equity. Environmental issues were not particularly prominent in the overall agenda of the Second global conference on population, the international Conference on population , held in Mexico city in 1984.However the conference recommendations for the further implementation of the world population plan of Action (United nations,1984, chap. I , sect. B (III and IV)) went beyond the outcome of Bucharest by framing environmental issues as a dimension of the population-development relationship on the global scale, urging all countries in which there were imbalances between trends in population growth and resources and environmental requirements to implement policies to redress such imbalances. The twenty-first special session of the General Assembly, convened in 1999 to review and appraise the implementation of the Programme of Action of the International conference on Population and Development also addressed environmental concerns (see Assembly solution S-21/2, annex). In particular, it reaffirmed that “early stabilization of world population would make a crucial contribution to realizing the overarching objective of sustainable development” (Para.1977).
2. World Population Growth
The population of the earth is growing at a rate that leads to its doubling in about 40 years. In numerical terms the addition of about 5.5 billion people during the lifetimes of most readers of the this book. This percentage growth rate as well as the numbers being added yearly are far, far greater than the earth’s population growth has been through most of human existence.
Before we begin our consideration of contemporary demography, we will briefly review the history of world population growth. We will see that before the modern era, the estimates of world population are neither precise, nor based on actual population counts. Nonetheless, the estimates, even though not firmly based on demographic data, will show us how extraordinary human population growth has been in the last 300 years and especially in the 20th century.
2.1 The Population of the Past
In the long record of human life on earth -a record that by some archaeological accounts may go back as much as 2 million years –the “population problem” has generally not been one of overpopulation. While there were very likely many instances were the resources of an area were overwhelmed by the numbers of humans living there, it is probably the case that through most of human existence the most basic struggle has been to maintain the population size of human groupings.
If one goes back in time more than 2,000 years, estimates of the world’s population are very uncertain since they are based largely on circumstantial evidence. Durand (1977) has studied the few estimates that have been made for the beginning of the Age of agriculture (10,000-8000 B.C), and he be-lives that the population at that time may have numbered between five and 10 million people. The uncertainty of our knowledge is reflected in the fact that the figures 5 and 10 million are two quite different estimates, but we have no basis for preferring one over the other (Durand, 1977, f. 260). These estimates are not based on any records, of course, not even on archaeological evidence. They are instead inferences made from information we have about primitive nonagricultural populations and their population densities (Durand, 1977).
For the period from the beginning of agriculture and the year 0 A.D., we again know very little about the world’s population size, except that it probably grew at a relatively brisk pace as agriculture spread around the world. By the years 0-14 A.D., Durand judges that the world population was probably between 270 and 330 million.
The next 1,000 years did not add to those numbers substantially, since, as we have already mentioned, the best estimates for the year 1000 are between 275 and 345 million. After the year 1000, and especially after 1650, the size of the world’s population started increasing fairly rapidly. And during the 20th century the size of the world’s population has grown at a rate this is truly remarkable.
2.2.Recent Growth of the World’s Population
This brief review of the history of the world’s population growth reveals that in the last 300 years, and especially in the 20th century, population growth has taken on a new and very different character. When the growth of the world’s population is shown graphically, as in Figure 1.1, it is difficult to depict accurately the enormity of this change. It requires a population scale that accumulates to only 5 or 10 million people in more than 1 million years (up to the beginning of agriculture, 10,000- 8000 A.D.0 and yet now grows by nearly 1 billion people every decade. Such rapid growth clearly calls for explanations of the cause. There are some well-developed answers to the question of why population growth in the last 300 years has been so rapid, but there are also some mysteries. Some of the most rapid population growth of the world occurred in Europe, especially in mortality rates then that came with development. In the 19th century, there were also apparent (the statistical data are less complete)
Figure 1.1.World population growth through history. From population reference Bureau (1984) population increases in North Africa, Southeast Asia, India-Pakistan-Bangladesh, southeast Asia, and Middle and South America (Durand, 1977). These non-European population increases in the 18th and 19th centuries present a major demographic mystery for historical demographers to solve in the future. Currently, the overall rate of population growth is declining, and as in the past the pace of growth is not uniform throughout the world. Great portions of the world’s population, especially in Africa and Latin America, are growing at a very rapid rate. Ignoring net migration, the Lotion American population could double in the next 35 years and the African population in 24 years. Some countries, for example, Iran and Iraq, are currently growing at rates that will double their population in 19 years (Population Reference Bureau, 19994). The European population, at its current rate of growth, will require over 1,000 years to double. Indeed, a number of European countries are currently losing population: Bulgaria, Estonia, Germany, Hungary, Latvia, Romania, Russia, and Ukraine (Population Reference Bureau, 1994). The population Division of the United Nations (UN) predicts that the world’s population will increase from 6.23 billion people in 2000 to 9.3 billion people in 2050. The UN estimates that the population will stabilize at more than 11 billion in 2200. Other experts predict that numbers will continue to rise into the foreseeable future, to as many as 19 billion-people by the year 2200.
| Table-1: Population Division of the United Nations | ||||
| Total population 2000 (Millions) | Projected total fertility rate 2000-05 (Births per women) | Projected Life Expectancy at Birth (1) 2000-05 (years) | Projected Population Growth rate 2000-05 (Percent) | |
| Country | ||||
| Eastern Asia | 1.48, 1.1 | 1.78 | 72.1 | 0.67 |
| China | 1.25, 3.1 | 1.83 (2) | 71.0 (2) | 0.73 (2) |
| Taiwan (ROC) (3) | 22.2 | 1.56 (4) | 76.3 (4) | 0.69 (4) |
| Japan | 127.0 | 1.32 | 81.6 | 0.14 |
| Mongolia | 2.5 | 2.42 | 63.9 | 1.29 |
| North Korea | 22.3 | 2.02 | 63.1 | 0.54 |
| South Korea | 46.8 | 1.41 | 75.5 | 0.5 |
| South east Eastern Asia | 520.4 | 2.55 | 66.7 | 1.40 |
| Brunai Darus salam | 0.3 | 2.48 | 76.3 | 2.27 |
| Combodia | 13.1 | 4.77 | 57.4 | 2.40 |
| Malaysia | 23.0 | 2.90 | 73.1 | 1.93 |
| Mayanmer | 47.5 | 2.86 | 57.3 | 1.28 |
| Philippines | 75.7 | 3.18 | 70.0 | 1.79 |
| Singapore | 4.0 | 1.36 | 78.1 | 1.69 |
| Thailand | 60.90 | 1.93 | 69.3 | 1.01 |
| Viatnam | 78.1 | 2.30 | 69.2 | 1.35 |
| South Central Asia | 1.48, 6.0 | 3.25 | 63.2 | 1.66 |
| Afghanistan | 21.4 | 6.80 | 43.1 | 3.88 |
| Bangladesh | 138.0 | 3.46 | 61.4 | 2.02 |
| India | 1.0,16.9 | 3.01 | 63.9 | 1.51 |
| Iran | 66.4 | 2.33 | 70.3 | 1.24 |
| Nepal | 23.5 | 4.26 | 59.9 | 2.23 |
| Pakistan | 142.7 | 5.08 | 61.0 | 2.44 |
| Sri Lanka | 18.6 | 2.01 | 72.6 | 0.81 |
| Uzbekistan | 24.9 | 2.44 | 69.7 | 1.51 |
| Russian Federation | 145.6 | 1.14 | 66.8 | 0.57 |
(1) Both sexes combined (2) Includes Taiwan (3) Source: U.S. Bureau of the Cencus, International Database (4) 2000.
Sources: United Nations Population Division, World Population Prospects: The 2002 Revision Population database accessed May 27, 2003 Available online at http//csa.un.org/unpp.
U.S Burean of the Cencus, International database accessed June 4, 2003 available online at http//www.cencus govt/ipc/www/idbacc/.
2.3 World Population Structures:
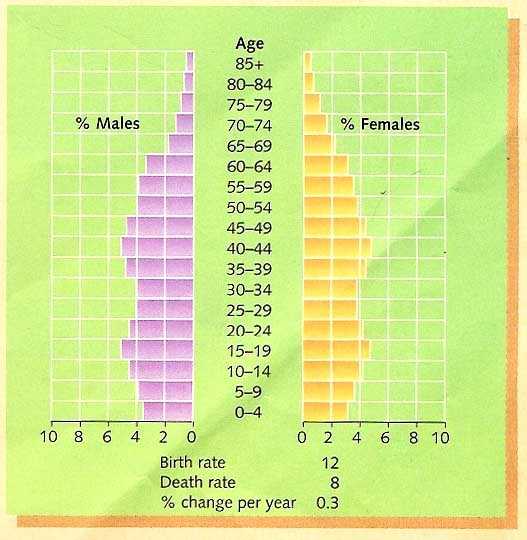
The rate of natural increase birth rate, death rate and life expectancy (life expectancy is the number of years that the average person born in a particular country can expect to live) all affect the population structure of a country can be shown by a population pyramid or, as it is sometimes known, an age-sex pyramid, the population is divided into five-year age groups (e.g. 5-9 years, 10-14 years), and also into males and females. The population pyramid for the United Kingdom is shown in Figure 1.1 & Japan 1.2) ( Waung-1998)
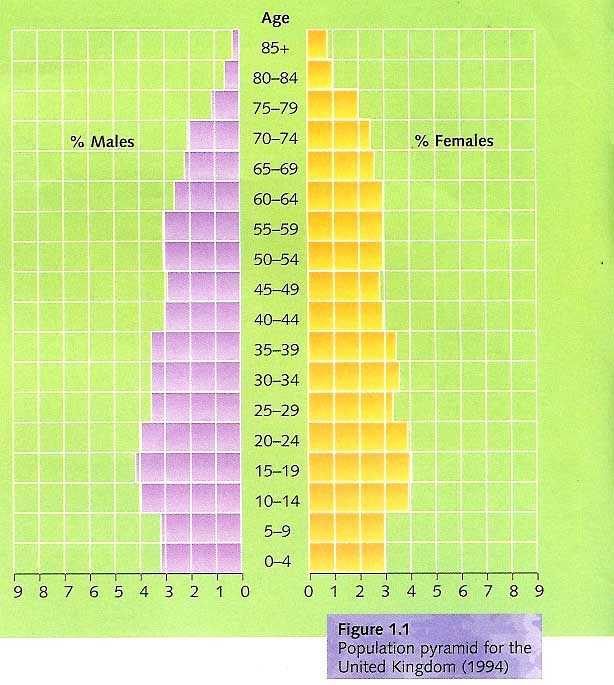
A narrow pyramid indicating approximately equal number in each age group.
A low birth rate and death rate indicating a steady, or even a static, population growth.
More females than males live over 70 years.
There are more boys under 4 years of age than girls.
A relatively large proportion of the population in the pre and post reproductive age group, and a relatively small number in the 15-64 age group which is the one that produces children and most of the national wealth.
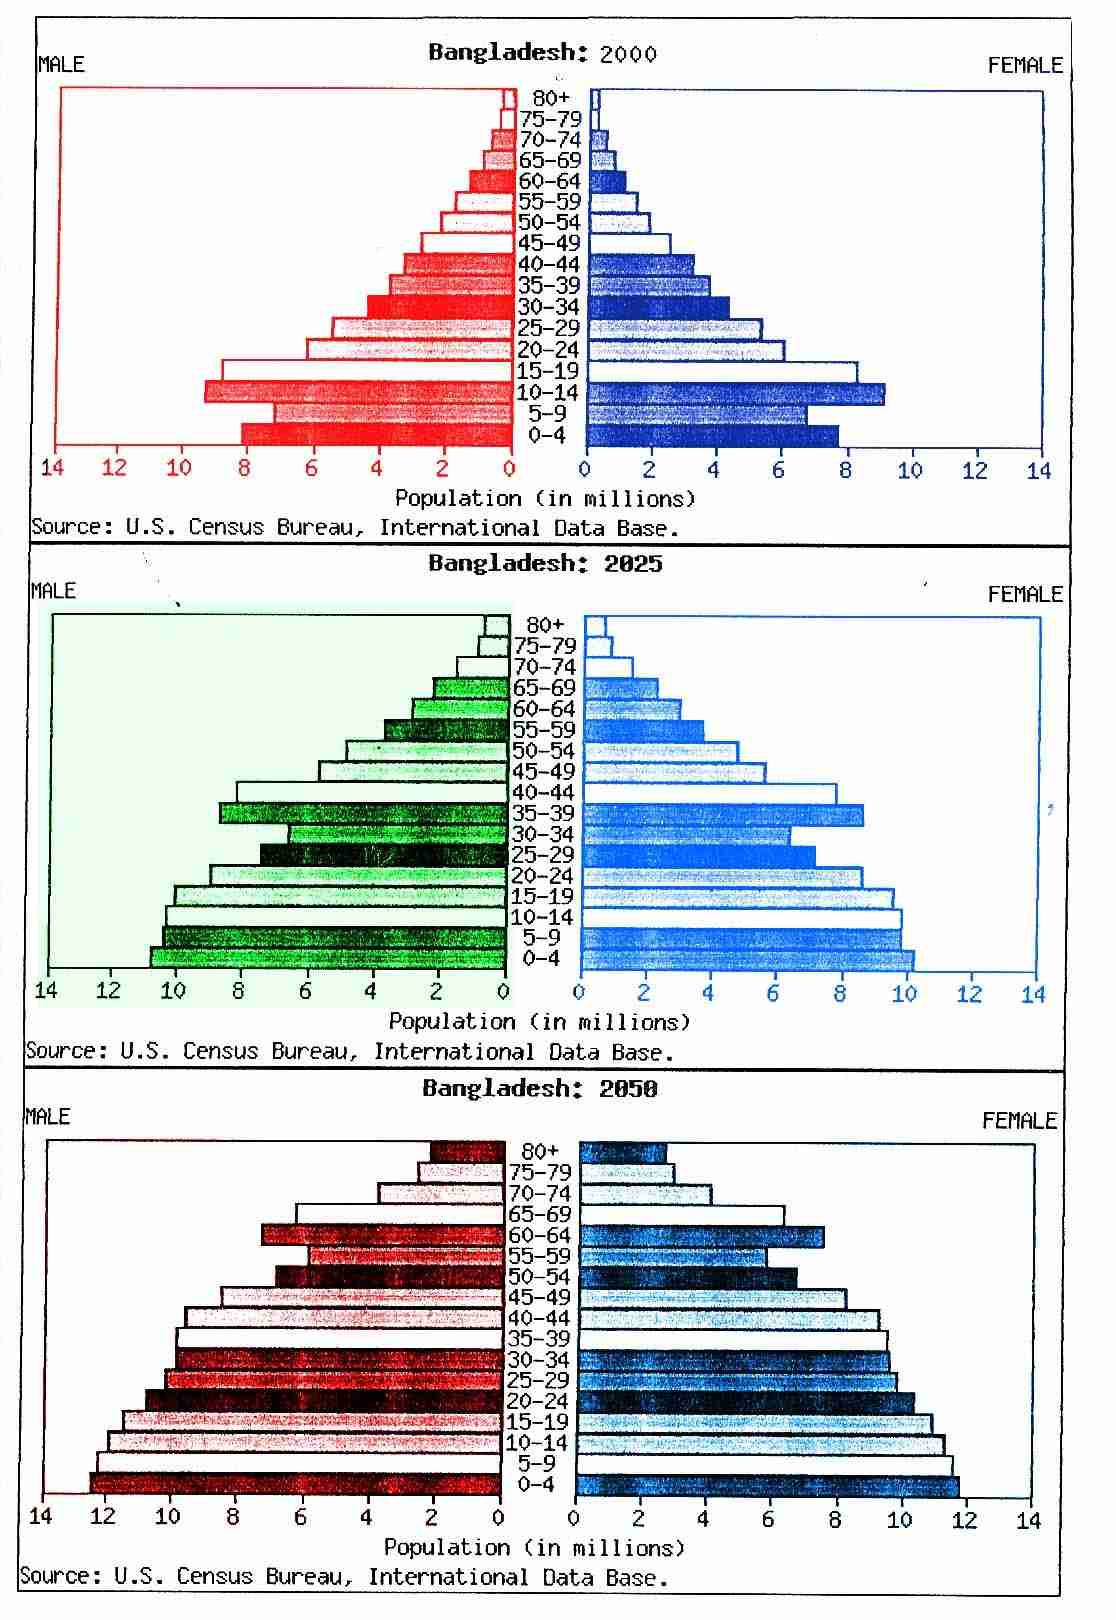
2.4 Population growth pattern of Bangladesh: 2000 2025
Births per 1,000 population …………………………………………….29 22
Deaths per 1,000 population ………………………………………..……9 7
Rate of natural increase (percent)………………………………….……2.0 1.5
Annual rate of growth (Percent) ………………………………….1.9 1.4
Life expectancy at birth (years)………………………………………..60.2 69.0
Infant deaths per 1,000 live births ………………………………..……..72 34
Total fertility rate (per woman)………………………………………….3.2 2.8
2.4.1 Population growth and structure in Bangladesh:
Bangladesh is densely populated country with a population of 121 million (in 1995) in an area of 1,47,570 sq kms. If the present growth rate of 1.8 percent per annum continues, the size will double in the next 40 years, aggravating future the population density.Of the total population men and women were 61.8 million and 59.0 million respectively with a sex-ration of about 105 in 1995. The age structure of the population is not favorable for the economic development since about 42 percent still remain under 15 years of age. This increases the dependency ration and creates pressure on Maternal Child Health (MCH) and nutrition services, pre-school care and different levels of education facilities.
The size of the female population of reproductive ages was 27.9 million in 1995. It will reach 37.0 million in 2010. It will be an enormous task even to sustain the current level of CPR, not to speak of further increase.Bangladesh appears to have reached the pre-low stationary state of demographic transition. Bangladesh population may complete the demographic transition (decline in the fertility rate to the replacement level) by the year 2010.The proportion of elderly population in Bangladesh was 6.1 in 1995. It is likely to reach 7.9 percent in 2000 and 9.1 percent in 2010. Although elderly population of age 60 years and above constituted about 6.1 percent of the total population of Bangladesh in 199, in terms of absolute number elderly persons was 7.37 million in 1995. This huge number will reach at 13.3 million in 2010.Point prevalence of disability per 1000 elderly population ages of 60 years and above was36.4 in 1995. There was significant sex differential in the incidence of disability among the elderly persons. Male and higher (37.7 per 1000). Disability than their female counterpart (34.8 per 1000) Proportion of disabled population is likely to increase with the increase of movement of people using mechanical transports. Because accident is the one of the main reasons for being disabled/handicapped.
Given the situation Analyzed in this paper, this can be argued that the government has to implement more effectively the programs already launched and adopt new programs so as to further improve the quality of life of our people in the shortest possible period of time (National Plan of Action based on ICPD 1994 Recommendations).
The most recent population pyramids for Bangladesh.
3. List of top ten populated countries: 2006
| Pos | Country | Total population |
| 1. | China | 1213973713 |
| 2. | India | 1095351995 |
| 3. | United State of America | 298444215 |
| 4. | Indonesia | 245452739 |
| 5. | Brazil | 188078227 |
| 6. | Pakistan | 165803560 |
| 7. | Russia | 147365352 |
| 8. | Bangladesh | 142893540 |
| 9. | Nigeria | 131859731 |
| 10. | Japan | 127463611 |
4. Future trends of world population growth
Between 1960 and 1970 the world’s population grew, on average, by a record 2 per cent per year. The growth rate, which was even higher in economically less developed countries (Figure 1.3), caused increasing concern, as estimates suggested that the world’s population would reach 7600 million by the year 2000. In 1996, however, the United Nations claimed that, taking the average for 1990 to 1995, the growth rate had fallen to 1.6 percent a year. This means that the world’s population is now not expected to exceed 6200 million by the turn of the century
More recently, East scan has produced a report based on studies of fertility (i,e. birth rates), death rates and migration. This report suggests that the word’s population will peak at around 10.6 billion in 2080 and then slowly decline. This decline is credited to:
the global birth rate falling faster than previously predicted.
Improvements in basic education and female literacy, which have led to a reduction in the desired family size. Increased international migration to the more economically developed countries where people have fewer children.
Diseases such as AIDS and malaria which are likely to reduce life expectancies, especially of people in sub Saharan Africa, the region with the present highest birth rate.
4.1 Changing Population structures
Children under 15
We have already seen (Figure, 1.9) that countries at state 2 of the demographic transition model are economically less developed and have high birth rates. As high birth rates result in a high proportion of the total population, often over 40 percent, being aged 15 or under (Figure 1.12), then at present their youthful population will need child-health care and education-two services that these countries can ill-afford. In the future, there will be more people reaching child-bearing age. The consequence will be, as in most of Africa, a rapidly growing population. In contrast, many of the economically more developed countries, with their low birth rates, have reached stage 4. Here the problem is becoming ‘too few’ rather than ‘too many’ children. In 1997 the Population Institute claimed that there were already 79 countries in which too few children were being born to sustain long-term population growth. The worst affected are Germany, Italy and Russia. Where deaths now exceed births. Countries where the replacement rate is not being met fear they will have too few consumers and skilled workers to keep their economy going, villages bereft of children and schools closed for lack of students’ and a lack of security in providing pensions.
People aged over 65
Due to improvements in medical facilities, hygiene and vaccines, life expectancy has increased considerably-life expectancy being the number of years that a person born in a given place may expected to live. Several of the most developed courtiers (Figure 1.13) already have over 16 percent of their population of pension able age, a figure likely to exceed 20 percent in Japan (24 percent), Germany (22 percent) and France by the year 2020 (Figure 1.14). This is leading to an increase in demand for more money for pensions, medical care, residential homes and other social services. As a country’s population countries to age, there will be fewer people in the, economically active age group to support them.
5. Impact of Population growth on Environment
Concerns about population and the environment have been evolving over time. Beginning in the late 1940s. and 1950s, environmental concerns focused almost exclusively on what was felt to be the negative impact of population. Virtually no attention was given to environmental side effects. During the 1960s and 1970s, the focus was widened to incorporate the by-products of production and consumptions, such as air and water pollution, waste disposal, pesticides and radioactive waste. By the 1980s and into the 1990s, a new dimension was added, encompassing global environmental changes, including global warming and ozone depletion, biodiversity, deforestation, migration and new and re-emerging diseases. (Cohen, 1995)
Table 2.Evolution of Environmental concerns, 1840s, to the present
| Wave | Date | General Concern | Specific issues | Doct. | |
| First | 1940s-1950s | Limited natural resources | Inadequate food Production Depletion of non-renewable resources | United Nations Report on population and resources | |
| Second | 1960s-1970s | By-products of Production and Consumption | Air and water pollution Waste disposal Radioactive/chemical contamination | Declaration of The United Nations Conference on the Human Environment. | |
| World Population plan of Action of the United Nations World populations Conference | |||||
| Third | 1980s-1990s | Global environmental change | Climate change Acid rain Ozone depletion | Report of the United States National Academy of Science | |
| Agenda 21 adopted by the United Nations Conference on Environment and Development | |||||
| Recommendations of the International Conference on Population | |||||
| Fourth | 1990s-percent | Global Environmental Change | Biodiversity Genetic engineering Deforestation Water management Migration Emerging Disease Globalization | Programme of Action of the international Conference on population and Development
| |
| Regulation S-21/2 on key actions for the further imlementation of the Programme of Action adopted by the General Assembly at its twenty-first special session | |||||
Source: Adapted from V.W. Ruttan, “Population growth, environmental change and innovation; impactions for sustainable growth in agriculture”, in Population and Land Use in Developing Countries, C.L. Jolly and B.B. Torrey, eds. (washington, D.C, National Academy press, 1993)
Now we explain the following terms-
5.1 Rural Environment
Population change, particularly via migration, has had an important impact on the rural environment, on both forests and dry-land areas. Most of the world’s gene pool is concentrated in such rural environments, especially the tropical rainforests, which are threatened by the growth and intrusion of human populations. Despite two centuries of rapid urbanization, the majority of the world’s population still lives in rural areas, and for at least two more decades most people in the developing world will continue to be rural inhabitants. It is therefore important to consider the interrelations among rural population growth, migration and the rural environment, particularly with respect to the changes experienced by developing countries since 1950.
The twentieth century has witnessed a profound shift of the world population from rural to urban areas (United Nations, 2000c). Thus, Proportion of the population living in rural areas declined from 66 percent in 1960 to 53 percent in 2000. Because urbanization began earlier in the more developed regions and in Latin America, by 2000 only a quarter of their population lived in rural areas, in contrast to two thirds of the population of Africa or Asia. Despite the reduction in the percentage of people residing in rural areas, there has been a large increase of the absolute number of persons residing in the rural areas, from 2 billion in 1960 to 3.2 billion in 2000 (table 3). That increase has been concentrated entirely in the less developed regions. Particularly large gains occurred in Asia whose rural population rose from 1.3 billion in 1960 to 2.3 billion in 2000, and in Africa where the rise was from 2225 million to 487 million. Over the next 30 years, virtually no growth is expected in the rural population of the world, and even that of the less developed regions will increase by less than 100 million, mostly in Africa. Rural population growth since 1960 has been particularly rapid in Africa and in Melanesia and Micronesia, at nearly 2 per cent per year. Although slower rural growth is expected during 2000-2030 in all regions 10 of the 21 regions in the world are still expected to see their rural population increase, with substantial rises likely in Eastern Africa, Middle Africa, Western Africa, Melanesia and Micronesia. Many of the countries in those regions already have seriously degraded rural environments and difficulties in feeding their populations (Food and Agriculture Organization of the United Nations, 1996b; Cleaver and Schreiber, 1994; Higgins and others, 1982). In south-central Asia and Western Asia, rural population growth is expected to be modest but countries in those regions already have high rural population densities. Lastly, central America is the only part of Latin America in which an increase of the rural population is expected.
In the analysis of the possible impacts of population on the rural environment, various measures of environmental degradation may be considered. The focus here is mostly on deforestation, the most studied impact because deforestation is associated with a significant loss of biodiversity, soil erosion and global warming. On a global scale, 60 percent of recent deforestation in the developing world may be attributable to the advance of the agricultural frontier, 20 per cent to logging operations (including mining and petroleum) and 20 per cent to household use of fuel wood (World Bank, 1991). While the importance of these factors varies across regions and countries, demographic factors are thought to play significant roles in both the advance of the agricultural frontier and fuel wood use (Food and Agriculture Organization of the United Nations, 2000c)
In developed countries, environmental deterioration has often led to out-migration from rural areas. Sometimes environmental changes have been due to natural causes, white at other times they have been induced by human practices. An example of the former is the effect of climate change (less precipitation) on agriculture and therefore in stimulating out-migration groom the Great plains of the United States during the “dust bowl” era of the 1930s (Gutman and other, 1996). Apart from the effects of nuclear and industrial accidents, toxic and solid waste dumps, and severe air or water pollution, human practices have often led to gradual but severe deterioration of rural environments. A striking example is the shrinkage by half of the large, inland Aral Sea in Central Asia due to excessive withdrawal of water fro the irrigation of cotton fields, a shrink age that has produced out-migration from the area (Postel, 1996)
Table 3. Rural population and Rural growth rate by major area and region, 1960-2030
Major area of region Rural population (millions) Rural rate of growth
1960 2000 2030 (average annual percentage)
1960-200 2000-2030
World………………………………2005.2 3210.0 3222.6 1.18 0.01
More developed regions…….. 353.3 285.0 199.7 -0.54 -1.19
Less developed regions…….. 1651.9 2925.0 3022.9 1.43 0.11
Africa………………………………225.4 487.3 640.2 1.93 0.91
Eastern Africa………………… 76.4 182.4 259.9 2.18 1.18
Middle Africa…………………. 26.1 61.8 96.1 2.15 1.47
Northern Africa……………….. 46.8 85.3 88.6 1.50 0.13
Southern Africa……………….. 11.4 24.3 22.1 1.89 -0.31
Western Africa………………. . 64.6 133.5 173.6 1.81 0.88
Asia……………………………… 1348.4 2330.7 2271.8 1.37 -0.09
Eastern Asia………….. 613.0 913.5 776.3 1.00 -0.54
South central Asia…….. 507.6 1035.3 1116.7 1.78 0.25
South eastern Asia……. 185.5 325.9 313.4 1.42 -0.13
Western Asia…………… 42.8 56.1 65.5 0.67 0.52
Europe……………………… 254.0 184.0 120.4 -0.81 -1.42
Eastern Europe………… 132.1 88.4 55.9 -1.00 -1.52
Northern Europe……….. 20.1 15.3 11.1 -0.68 -1.08
Southern Europe………. 59.7 48.4 31.2 -0.52 -1.47
Western Europe………. 42.2 32.0 22.2 -0.69 -1.22
Latin America
The Caribbean…………. 110.7 128.3 121.5 0.37 -0.18
Caribbean………………. 12.2 14.1 13.0 0.37 -0.28
Central America………… 26.3 44.3 47.5 1.30 0.23
South America…………. 72.2 69.9 61.0 -0.08 -0.45
Northern America…………. 61.4 70.6 58.1 0.35 -0.65
Oceania……………………. 5.3 9.1 10.5 1.35 0.51
Australia/New Zealand.. 2.6 3.4 3.2 0.74 -0.20
Melanesia……………… 2.4 4.9 6.4 1.86 0.89
Micronesia……………… 0.1 0.3 0.4 1.98 1.06
Polynesia………………. 0.2 0.4 0.4 1.25 0.57
Source: Population Division of the Department of Economic and Social Affairs of the United Nations Secretariat, ”World Urbanization prospects.1999 revision: data tables and highlights ”(ESA/P/WP.161)
5.2 Urban Environment
Urbanization will be one of the most important demographic trends of the twenty-first century. Indeed,Virtually all the population growth expected during 2000-2030 will be concentrated in the urban areas of the world (United Nations, 2000c). Growth will be particularly rapid in the urban areas of the less developed regions, averaging 2.3 percent per annum during 2000-2030, consistent with a doubling time of 30 years. Al-though urban areas will encompass an increasing share of the world population, the proportion of people living in very large urban agglomerlived in cities of 10 million inhabitants or more.
Population growth influences the spatial concentration of people, industry, commerce, vehicles, energy consumption, water use, waste generation and other environmental stresses (Bartone;
Bernstein and Leitmann, 1992). It is often assumed that cities environmental problems are made worse by the number of people and their high concentration; but in fact this same concentration provides many potential opportunities. Indeed, the world’s current urban population of about 3 billion inhabitants would fit into an area of 200,000 square kilometers-roughly the size of Senegal or Oman-at densities similar to those of inner city residential area in a number of European cities (Hardoy, Mitlin and Satterthwaite, 2000)
5.2.1. The Relationship Between city population size rate of Growth and urban environmental problems
The relationships between city population size, or city size distributions on the one hand, and environmental damages on the other hand, are numerous, complex and very poorly understood (Praud’ home, 1994). The environmental impact of city size is generally considered negative. The larger the city, it is assumed, the greater the per capita environmental costs or damages. However, a number of caveats are in order. Since what ultimately counts is not so much pollution discharged, but rather pollution discharged minus pollution eliminated, it is important to not that, for a number of pollutants (for example, solid waste, water pollution), there are economics of scale in pollution abatement. Also large cities are generally resource-saving relative to smaller cities; they are usually denser; and they lend themselves better to public transportation usage and include a larger share of apartment buildings, hence they consume less land and less energy per capita. Finally, because transportation flows increase with population dispersion, environmental impacts associated with transportation (for example, fossil fuel consumption, greenhouse gas emissions, air pollution) presumably could be reduced by increased concentration in a few large cities.
5.2.2 The City Environment
The relationships between urbanization and environmental degradation are very complex, involving interactions with the natural and the built environment, as well as a variety of economic, social and political factors. The regional ecosystem in which a city is located, for example, is often a critical determinant of the severity of environmental conditions, as well as the complexity of potential intervention strategies. The wide variety in ecosystem types (for example, coastal regions, arid regions, humid-tropical regions, cold regions, mountainous regions) and the number of combinations make it difficult to devise a simple typology applicable to all environmental problems encountered in the world’s large cities (Bartone, Bernstein and Leitmann, 1992). In the case of ambient pollution, for example, the vulnerability of large cities to the adverse impacts of vehicle emissions depends on certain natural features (for example, altitude, direction and speed of prevailing winds; amount of sunlight; atmospheric stability; precipitation and humidity). The case of Santiago offers a striking example. Although emissions in Santiago are only 10 per cent of those in Sao Paulo, because of its climate and altitude, the magnitude and severity of air pollution episodes in Santiago are similar to those in the much larger city of Sao Paulo (Faiz,1992)
5.2.3.Environmental Impacts on Urban Health
Compared with the complex linkages among the environment, city size and rates of urban growth, the linkages between environmental degradation and health are more straightforward. Again, as in the case of aggregate levels of air and water pollution, there is much impressionistic evidence, but few comprehensive studies, using comparable data. Water is an important vehicle for the transmission of many pathogenic microorganisms as well as organic and inorganic topic substances. Many of the more important transmissible diseases in the developing countries can be classified according to the role played by water in the chain of transmission: water-borne diseases (for example, enteric and diahorreal disease, typhoid fever, hepatitis); water hygiene diseases (for example, trachoma, shigellosis); water contact disease (for example, schistosomiasis); and water vector diseases (for example, malaria, onchocerciasis) (Bartone, 1990). Many debilitating and easily preventable diseases are endemic in the world’s large cities, including diahorrea, dysentery, typhoid, intestinal parasites and food poisoning. Whereas water-related diseases are a primary cause of infant and child mortality, mortality from air pollution typically occurs later in life. Relatively few deaths can be attributed directly to air pollution. However, millions suffer from respiratory infections (although the extent to which chemical air pollutants can reduce people’s resistance to acute respiratory infections is not well understood), and many will die from some form of cancer caused or exacerbated by air pollution. Lead, fro example, causes damage to bne marrow, liver and kidneys, and permanent neurological damage, especially in young children. Carbon monoxide can cause both neurological and cardiovascular damage. Indoor air pollution is particularly serious among low-income urban-dwellers, who commonly use fuel wood for cooking and heating in poorly ventilated housing. The impact of air pollution in workplaces is also very serious. Workers in quarries, cement plants and rubber product factories, for example, are susceptible to silicosis, Talco sis and stenosis incurable lung diseases that may be fatal (Hardoy and Satterthwaite, 1989).
In recent years, there has been a growing body of literature on the linkages among the urban environment, poverty and health (see Harpham and Molyneux, 2000). A notable aspect of many of these studies is the focus on differentials in health status or mortality rates between various population groups within cities. Not surprisingly, many of the studies found conditions in poorer areas of cities to be much worse than in the more affluent areas or even than the city average . Infant mortality rates in poorer areas, for example, were often four or more times higher than in more affluent areas, with much larger differentials apparent in the poorest district as compared with the most affluent district. Large differentials between rich and poor districts were also common in the incidence of many environmentally related diseases, for example, tuberculosis and typhoid (Satterthwaite, 1993).
5.2.3 Cities and Sustainable Development
In examining the linkages between urbanization and environmental issues, one central problem is that economic development exacerbates many environmental problems (for example, solid waster, automotive pollution) because the quantity of urban wastes generated per capita also tends to increase steadily with increased per capita income. Moreover, in recent decades, as incomes have risen in many countries and transport cists have declined, cities’ “ecological footprints” have broadened. City-based consumers and industries have increasingly drawn on the carrying capacity of rural regions, separating the environmental impact of the city’s inhabitants and business are unaware of the environmental impact for which they are responsible (United Nations Central fro Human Settlements (Habitat, 1996).
6. Impact of population growth on Natural resources
Despite humanity’s success in feeding a growing world population, the natural resources on which life depends fresh water, cropland, fisheries and forests-are increasingly depleted or strained. One hopeful sign for the new millennium is that population growth is slowing at a much faster rate than was previously predicted. While slowing, however, significant growth continues meaning that more people will be sharing such finite resources as fresh water and cropland.
6.1.Population and Environment
Having reached nearly 6.1 billion in 2000, human population continues to grow. UN population projections for the year 2050 range from 7.9 billion to 10.9 billion, suggesting the extent to which we can influence our future. More people and higher incomes worldwide are multiplying humanity’s impact on the environment and on natural resources essential to life. Based on these trends, it is clear that the 21st century will witness even greater pressures on natural resources. Current demographic trends offer hope, however. Over the past 40 years the average number of children born to each woman has fallen from five to less than three. Young people increasingly want to wait to have children and to have smaller families. Policymakers have a choice. They can do nothing, or they can help ensure that in the 21st century the world’s population peaks with fewer than 8 billion people, simply by committing the financial resources to meet the needs of couples who want to have smaller families, later in life.
6.2 Water
An adequate and dependable supply of fresh water is essential for health, food production and socio-economic development. Though more than two thirds of the planet is covered with water, less than 0.01 percent is readily accessible for direct human use (United Nations, 1997 b). Moreover, no more of this renewable fresh water is available today than existed at the dawn of human civilization. As a result, the size of a country’s population and the speed at which it grows help determine the onset and severity of water scarcity. Although recent declines in population growth have improved the outlook for future water availability, the problems associated with water scarcity will continue to mount as the size of the world’s population increase.
Currently, humans are using about half the fresh water that is readily available. Fresh water is distributed unevenly over the globe, and already nearly half a billion people are affected by water stress or serious water scarcity, while many more are experiencing moderate stress. Given current trends, as much as two thirds of world population in 2025 may be subject to moderate–to-high water stress (United Nations, 1997b)About 300 major river basins and many groundwater aquifers cross national boundaries (United Nations, 1997b). Therefore, the need for co-operative efforts will persist, particularly in areas facing water shortages, and wherever pollution is carried downstream across national boundaries.Estimates indicate that over 1 billion people lack access to safe drinking water and two and a half billion lack adequate sanitation, and these factors contribute to the deaths of more than 5 million people, of whom more than half are children (United Nations, 2000a) .
6.3.Cropland
The number of people living in countries where cultivated land is critically scarce is projected to increase to between 600 million and 986 million in 2025. Despite the Green Revolution and other technological advances, agriculture experts continue to debate how long crop yields will keep up with population growth. The food that feeds the future will be raised mostly on today’s cropland. The soil on this land must remain fertile to keep food production secure. The minimum amount of land needed to supply a vegetarian diet for one person without any use of artificial chemical inputs or loss of soil and soil nutrients is 0.07 hectares, or slightly less than a quarter of an acre. An estimated 415 million people already live today in countries that have less than that per person. Easing world hunger could become unimaginably difficult if population growth resembles demographers “higher projections.”
6.4. Fisheries
Most of the world’s ocean fisheries are already being fished to their maximum capacities or are in decline. Global fish production climbed modestly in 1997, the last year for which global data are available, almost entirely because the farming of fish expanded in the world’s most populous country, China. Most fisheries worldwide are fully exploited or in decline. While the number of individual fishers continues to increase, the amount of fish each one catches falling steadily. The poor long depended on fish for complete protein, but population growth is helping to push this important food source out of their reach.
6.5.Forests
Today over 1.8 billion people live in 36 countries with less than 0.1 hectare of forested land per capita, an indicator of critically low levels of forest cover. Based on the medium population projection and current deforestation trends, by 2025 the number of people living in forest-scarce countries could nearly double to 3 billion. Most of the world’s original forests have been lost of the expansion of human activities. In many parts of the developing world, the future availability of forest resources for food, fuel and shelter looks quite discouraging. Future declines in the per capita availability of forests, especially in developing countries, are likely to pose major challenges for both conservation and human well-being.
6.6.Climate
In 1998, the last year for which global data are available for both population and heat-trapping carbon dioxide emissions, per capita emissions of CO2 continued the upward trend that dominated the middle 1990s. When combined with growing world population, these increased per capita emissions accelerated the accumulation of greenhouse gases in the global atmosphere and, thus, future global warming. With 4.6 percent of the world’s population, the United States contributed close to 24 percent of all emissions from fossil fuel combustion and cement manufacture, by far the largest CO2 contributor among nations. Emissions remained grossly inequitable, with one fifth of the world’s population accounting for 62 percent of all emissions in 1996 while another and much poorer-fifth accounted for less than 2 percent.
6.7.Biodiversity
More than 1.1 billion people live in areas that conservationists consider the most rich in non-human species and the most threatened by human activities. While these areas comprise about 12 percent of the planet’s land surface, they hold nearly 20 percent of its human population. The population in these biodiversity hotspots is growing at a collective rate of 1.8 percent annually, compared to the world’s population’s annual growth rate of 1.3 percent.
6.8. Population and Hope
Clearly the environmental challenging facing humanity in the 21st century and beyond would be less difficult in a world with slower population growth or non at all. Population is a critical variable influencing the availability of each of the natural resources considered here. And access to family planning services is a critical variable influencing population. Use of family planning contributes powerfully to lower fertility, later childbearing, and slower population growth. Yet policymakers, environmentalists and the general public remain largely unaware of the growing interest of young people throughout the world in delaying pregnancies and planning their families. In greater proportions than ever, girls want to go to school and to college, and women want to find fulfilling and well-paid employment. Helping people in every country to obtain the information and services they need to put these ambitions into effect is all that can be done, and all that needs to be done, to end world population growth in the new century.
Comprehensive population policies are an essential element in a world development strategy that combines access to productive health services, to education and economic opportunities, to improved energy and natural resources technologies, and to saner models of consumption and the “good life”. Together these can bring humanity into enduring balance with the environment and the natural resources upon which we will always depend.
Source:
Robert Engelman with Richard P. Cincotta, Bonnie Dye, Tom Gardner-Outlaw and Jennifer Wisnewski,
People in the Balance : Population and Natural Resources at the turn of the Millennium (Washington, DC: Population Action International, 2000 ).
7. Measuring Population, Development, and Environment Relationships
Research into the links among population, economic growth, and the environment may follow one of several very different approaches. One approach emphasizes population’s direct and indirect effects on the environment. Under this view, population size is a “multiplier” of the effects of other factors that influence the environment (Paul Ehrlich and John, 1974, Harrsion, 1992).
The IPAT equation exemplifies this approach. In this equation, total environmental impacts (1, air pollution, for example) are a product of population size (p), the level of affluence or per capita consumption (A), and the level of technology (T); that is, I=PAT. IPAT implies that, although population, consumption, and technology might each have an independent effect on the environment (I), their combined effect is probably the most important. IPAT has been criticized because it oversimplifies the relationships among the variables (Catherine and Richard, 1997).Other approaches highlight the social, cultural, institutional, and political context in which population and environment relationships occur (Jolly, 1991).
Demographer Richard Bilsborrow, for example, has studies how poverty, government policies, and market demands in Latin America determine whether population growth leads to technological change in agriculture, soil degradation, or out-migrations (Richard, 1992). Paul Harrison has examined how cultural values affect women’s status, which ultimately affects the size and growth rate of the population and the state of the environment (Harrison, 1992). Many recent models look at how social, cultural, demographic, and economic systems interact to form larger. “Socio ecological systems” within which population and the environment interact. Each approach is likely to yield some useful information, but scientists are still struggling to measure and explain many of the basic relationships among population, development, and the environment (Livernash and Eric, 1998).
8. Population change in more developed & less developed countries.
As the 20th country began, the more developed countries were well into the shift from high to low more mortality and fertility known as the demo-graphic transition Russia & several other control Asian & Eastern European countries have been the exceptions to this general improvement in health & mortality in the last 50 years most of Africa, Asia & Latin America were still in the demographic transition state of high mortality & high fertility.
9. Temporal Trends In Pollution, Environment And Development
The twentieth century witnessed an extraordinary growth of world population-from 1.6 billion to 6.1 billion people, 80 percent of the increase having occurred since 1950. Rapid population growth was triggered by dramatic reductions in mortality, especially in the less developed regions, where average life expectancy at birth increased by over 20 years during the second half of the century. As a result, world population has increased by nearly two and one half times since 1950, with the global rate of growth peaking at 2.04 percent per year during the late 1960s. Annual increments of 86 million persons during the late 1980s were the largest in history. The world added its most recent billion people in just 12 years (from 1987 to 1999), the shortest period in history for an increase of 1 billion.
World population is expected to continue growing (table) Based on the medium-fertility variant, which assumes replacement-level fertility of 2.1 children per woman, global population is projected to reach 9 billion people in 2043 and 9.3 billion in 2050. However, future population size is sensitive to small but sustained deviations in fertility levels. For example, a low-fertility variant, in which fertility reaches about half a child lower than in the medium-fertility variant, results in a population that declines to 7.9 billion in 2050. In contrast, a high-fertility scenario, in which fertility reaches about half a child higher than in the medium fertility variant, produces a population of 10.9 billion in 2050.
Because world regions are at varying stages in the transition from high to low rates of mortality and fertility, their grow paths differ, resulting in significant shifts in the geographical distribution of population. In 1950, 68 percent of the world population resided in the less developed regions; at present 80 percent reside there. Of the 77 million people added to the world each year, 97 percent live in the less developed regions.
Population Year
World Population reached
1 billion in 1804
2 billion in 1927 (123 years later)
3 billion in 1960 (33 years later)
4 billion in 1974 (14 years later)
5 billion in 1987 (13 years later)
6 billion in 1999 (12 years later)
World population may reach
7 billion in 2012 (13 years later)
8 billion in 2026 (14 years later)
9 billion 2043 (17 later)
Source: United Nations (2001a).
The impact of international migration on population growth for more developed regions has been increasing. The 35 million net migrants absorbed by Western market economics between 1970 and 1995 accounted for 28 percent of their combined population growth, while the loss of those migrants reduced population growth in the rest of the world by under 2 percent. Worldwide, the number of persons who have moved to another country has risen to over 125 million migrants (United Nations, 2001a).Another relevant, vital population trend is urbanization. Whereas in 1950, 30 percent of the world were urban-dwellers, by 2000 the proportion had risen to 47 percent. The urban population is projected to equal the rural population by 2007. With increasing urbanization, mega-cities have become more numerous and considerably larger in size. In more developed regions, the size of the rural population began declining well before 1950; in contrast, in less developed regions, the rural population doubled between 1950 and 2000.
9.1.Economic Growth And Poverty
The enormous expansion in the global production of goods and services driven by technological and social and economic changes has allowed the world to sustain both much larger populations and vastly higher standards of living than ever before in history. The two most salient characteristics of economic growth in the latter half of the twentieth century have been its unprecedented pace and its uneven distribution between countries and regions. Between 1950 and 2000, world GDP at constant prices expended eightfold (International Monetary Fund, 2000). During the same period, world population grew from 2.5 billion inhabitants in 1950 to 6.1 billion in 2000. Because of the accelerating tempo of technological progress, output growth, (Figure) has remained well ahead of population growth, inducing a threefold increase in per capita GDP.
In recent years, development efforts have shifted from the traditional focus on per capita income to improvements in health, education and sanitation as characteristics of development. For example, many quality and length of life. These achievement reflect successes at providing basic social services such as education and access to safe water and sanitation. These success have in turn contributed to reducing infant and child mortality and illiteracy, and raising life expectancy and school enrolments.
9.2 Energy Consumption And Emissions
The importance of energy and raw materials derivers from their dual role of providing the underpinnings for economic activity and human well-being, while acting as the driving force behind many environmental concerns, including climate change, acid rain and pollution.
Because energy consumption is a function of economic growth and level of development, energy consumption is distributed unequally in the world. Although their share has been falling, developed market economics, constituting one fifth of the world’s populations, consume almost 60 percent of the world’s primary energy. As a consequence of development and the rapid replacement of traditional energy sources by commercial sources, some developing countries have consumption patterns similar to those of developed market economies. Nevertheless, per capita consumption in developing countries as a group remains far below that of developed market economies.
The use of fossil fuels has led to substantial growth in global emissions of carbon dioxide (CO2) and the build-up of greenhouse effects, contributing to global warming. Since 1751, over 265 billion tons of carbon have been released to the atmosphere, one half of these emissions having been produced since the mid-1970s (Marland and others, 1999). Annual global emissions of CO2 from the burning of fossil fuels have quadrupled since 1950. The highest per capita emissions are in North America, which is followed by Europe where such emissions percent of countries mention the linkage between rural population growth and density and the degradation of agricultural land and forests.
10. Awareness about World wide population Growth
Two understand the significance of current rapid population growth in many parts of the world, the reader must be aware of the following trends:
Mortality rates have gone down in the less developed countries of the world.
While part of the mortality decline can be attributed to some beginnings of modernization, most is attributable to the importation of western technology, often through the mechanism of western aid & assistance.
The resulting mortality decline has occurred over a very short period of time, compared to the time it took for the European transition.
The birth rate in many of the less developed countries remains high
The birth rate remains high because the cultural changes that were apparently responsible for lowering fertility in Europe have not yet occurred in the less-developed countries.
(Daugherty and Kammeyer, 1995).
11. Conclusions
In twentieth century has been century of change. It has been a century of unprecedented world population growth, unprecedented world economic development and unprecedented change in the earth’s physical environment. From 1900 to 2000, world population grew from 1.6 billion to 6.1 billion persons, about 85 percent of the growth having taken place in Asia, Africa and Latin America (United Nations, 2001a). And although population growth rates are slowing, United Nation’s population projections (United Nations, 2000c, 2001a) show that the world population is likely to exceed 8 billion people by 2030. As was the case with world population growth in the past, future growth is expected to be uneven: from 2000 to 2030, the more developed regions are expected to grow by about 2 percent, while the less developed regions would grow by about 45 per cent. In 1900, about 86 per cent of the world population were rural dwellers and just 14 per cent were city dwellers ( Matras, 1973 ); but by 2000, the share of the world population living in the rural areas had declined to 53 per cent, while the number of urban dwellers had risen to 47 per cent (United Nations, 2000c). By 2030 over three fights of the world will be living in cities. Virtually all the population growth expected during 2000-2030 will be concentrated in the urban areas of the world.
Relatively rapid and uneven population growth and economic development are occurring ultaneously with degradation of aspects of the earth’s physical environment. For example according to J.R. cNeill (2000), the twentieth century experienced topsoil loss equal to that of the previous 1,000 years. Total energy use during the 100 years of the twentieth century was 10 times that of the previous 1000 years. World food production has increased at a faster rate than population and more food per capita is available now than ever before in world history; but the increasing scarcity and degradation of agriculture and other environmental resources cast serious doubts as to how long food production can surpass population growth. Throughout the world many fragile, biologically unique ecosystem, and the many species of plants and animals they contain, are threatened .Forest areas are diminishing, especially in tropical areas. Industrial pollution and harmful run offs from agricultural production threaten the quality of water and air. Fresh water is already in short supply in some regions-approximately one third of the worlds populations lives in countries classified as experiencing moderate to severe water stress or scarcity – a nd future population growth will only increase the pressure on this renewable, but limited, resource. Emissions of CO2 and other greenhouse gasses continue to mount. With globalization, and new and emerging technologies and modes of production and consumption, the relationships among population, environment and development have become issues of heightened concern for Governments, the international community and the average citizen. Population growth, structure and distribution are important aspects of environmental stress insofar as everyone requires the basic necessities of water, food, clothing, shelter and energy, which directly affect the ecosystems (World Resources institute, United Nations Environment programme, United Nations development programme and World Bank, 2000).However, environmental stress is a matter not just of population change, but also of how and what people produce and consume now and in the future (World Resources Institute, United Nations Environment programme, United Nations Development Programme and World Bank, 2000; United Nations, 1997b).