Introduction:
Bangladesh is the land of greens with a very rich heritage of all that makes it complete. Bangladesh consists of sixty eight thousand villages and a less number of cities. Therefore ninety percent of the population live in the villages where agriculture makes up close to seventy two percent of the GDP and sixty percent employment. Unfortunately this information cannot show the real picture of the village until and unless one does not go into the field and see with one’s own eyes. Our allotted village was KOSHABHANGA and our para was KOSHABHANGA-1. Even though it was a rural area there was a significant sign of development through the NGO’s and GO’s that were present there. Illustrated below are the areas that very resourceful and we have also tried to exhibit the image of the village by drawing maps and proposing their analysis.
Objectives:
The main objective of preparing maps is to portray a mental construct of the village itself and it also exhibits the geographical image of the village or para and also to show the available resources that are found in that particular village.
Limitations:
Taking into consideration the fact that we are not research experts we faced some limitations while carrying out this research. The reason are listed below:
* We faced time constraint while preparing the map and also the fact that we had to draw it the very day we interacted with the respondents.
* Some of the questions from various topics where not answered properly which gave us a vague answer in the end.
Selection of the Village or Para:
Our para was allocated in KOSHABHANGA -1 which is part of the village KOSHABHANGA. Our supervisor along with members of PROSHIKA choose the village and para for each group. Along with our group another group was also assigned this particular para.
Village mapping:
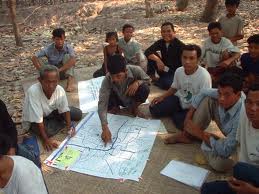
Village mapping is done primarily to exhibit a geographical representation of the village. While doing our survey we came across a Hindu local and after we requested him he drew out a village map for us.
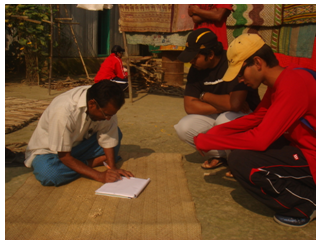
Figure: KOSHABHANGA Village map
After he drew it out on the paper we asked him to draw it out on the ground. We then asked him to label the village and identify its components.
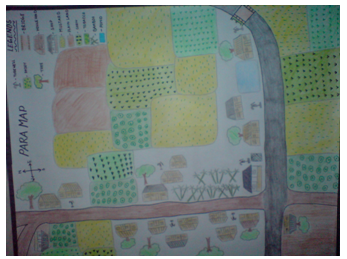
Figure:
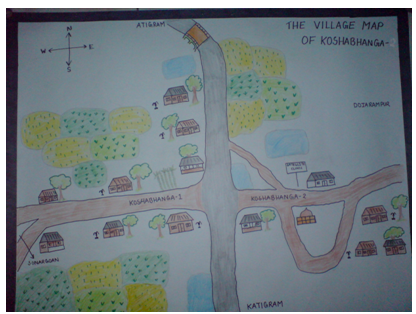
Figure:
Brief Information of the Para:
Name:
KOSHABHANGA- 1
Location:
Country – Bangladesh.
Division – Dhaka.
District – Manikgonj.
Village – KOSHABHANGA
Para – KOSHABHANGA-1
Age:
Not more than 80 years.
Geographical Distribution:
North – Atigram
South – Katigram West – Sonargaon
East- Kosha Bhanga-2
Population:
Total population of our Para is 250-260 (approximate).
Number of houses:
There were a total of 40 houses present in the village.
Other Information:
There was a combination of both Muslim and Hindu residents living in the village. However there was no mosque, school, hospital or graveyard in the para.
Resources of the Village or Para:
The resources of the village are briefly explained below:
House:
In the village most of the houses that we visited and also with the information from our survey paper suggests that they were made of tin with an earth floor. We found a minimal number of houses that had concrete floor but with tin surroundings.
Latrine:
Now that the people of the village are more aware of their health conditions the state of their latrine as we observed are illustrated below:
- Most of the residents use ring slab
- We only found one household that had a septic tank latrine.
- There was no presence of any hanging latrine.
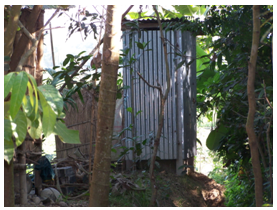
Figure: Ring Slab
Tube well:
Most of the people made use of tube well and most of the household had their own personal tube well. Those people who did not have any tube well took water from other’s tube well near by. They use the tube well water for cooking and drinking purposes.
Trees and Animals:
Greenery and trees is what fills one’s eyes when you visit a village. The trees that we saw are listed below:
Mango, coconut, papaya, mehagoni, bamboo, date, jackfruit, star fruit, custard apple, blackberry etc.
There were a number of domestic animals such as oxen, cow, goat, ducks, chicken etc.. It was told to us that there are some wild animals like fox, mongoose, khatash, snake etc.
Land:
Land was to the fullest of resource in the village and we observed that most of it was used for farming or agricultural purposes and a very minimal amount of land was used as playing ground etc.
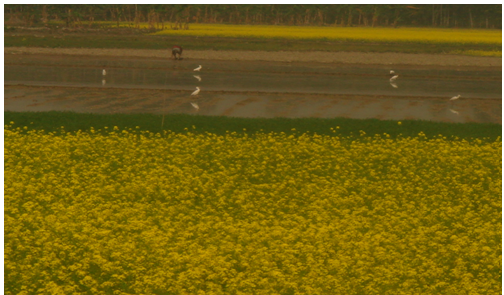
Figure: Cultivable Land
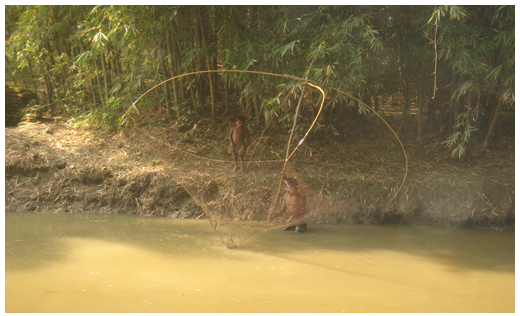
ponds:
We found 2 ponds in our para and these ponds were primarily used for bathing or washing items. Some villagers, particularly farmers use the ponds to wash their crops.
Shops:
We found 2 small shops that were situated within the village. One was at the opening mouth of the village and the other was the farthest end of the village. The goods that were available in these shops were soap, chips, chocolates, tea, drinks or beverage, biscuits kerosene, etc…
General Information:
From the very first part of our course we were given five sets of survey questionnaires and our group consisted of five members, therefore we had to investigate twenty five households. The following tables are the analysis of the data that we have collected from our survey.
Age and Sex Distribution:
Table: 3.1. Age and Sex Distribution to Study Population
| Age Groups | Male | Female | ||
| No | % | No | % | |
| 0-10 | 12 | 7.18 | 17 | 10.18 |
| 10-20 | 15 | 8.98 | 12 | 7.18 |
| 20-30 | 12 | 7.18 | 18 | 10.78 |
| 30-40 | 18 | 10.78 | 25 | 14.97 |
| 40-50 | 12 | 7.18 | 8 | 4.79 |
| 50-60 | 6 | 3.59 | 3 | 1.80 |
| 60-70 | — | — | 4 | 2.39 |
| 70-80 | 3 | 1.80 | 2 | 1.20 |
| 80-90 | — | — | — | — |
| 90-100+ | — | — | — | — |
Source: Field Survey Spring 2008 Sample Size: 25 Households
According to the instruction given to us we investigated 25 households. In total there were 167 people living in that village out of which there were 78 male members and 89 female members.
Marital Status:
Table: 3.2 Marital Statuses
| Marital Status | Male | Female | ||
| No | % | No | % | |
| Married | 35 | 44.87 | 35 | 39.32 |
| Unmarried | 43 | 55.13 | 50 | 56.18 |
| Widow/ Widower | — | — | 4 | 4.50 |
| Divorced | — | — | — | — |
| Separated/ Abandoned | — | — | — | — |
| Total | 78 | 100.00 | 89 | 100.00 |
Source: Field Survey 2008 Sample Size: 25 Households
in the midst of these 167 people 70 of them were married and 83 of them are at present unmarried and 4 people are unfortunately widowers.
Family Type:
Table: 3.3 Family Types
| Family Type | No | % |
| Extended | — | — |
| Joint | 4 | 16 |
| Nuclear | 21 | 84 |
| Total | 25 | 100 |
Source: Field Survey 2008 Sample Size: 25 Households
From the survey we could extract the information that within these 35 households only 4 of them were joint families and the 25 remaining households were nuclear families. The number of extended families were 0.
Primary Occupation:
Table: 3.4 Primary Occupations
| Occupation | Male | Female | ||
| No | % | No | % | |
| Income Earner | 32 | 19.16 | — | — |
| House Wife | — | — | 35 | 24.60 |
| Student | 28 | 16.77 | 20 | 15.88 |
| Unemployed | — | — | — | — |
| Dependent (Children) | 24 | 7.94 | 22 | 4.78 |
| Dependent(Adult) | 1 | 0.79 | 4 | 2.38 |
Source: Field Survey 2008 Sample Size: 25 Households
As we surveyed the household of Koshabhanga-1, we got thirty two male who have income source. Rest of them was students and dependent. On the other hand, we conducted a research on the women of Koshabhanga-1 as well and there were twenty five percent female were housewives and rest of them were still dependent.
Family Income:
Table: 3.5 Family Incomes
| Income Range | No | % |
| Below 30000 | 3 | 12 |
| 30000-75000 | 18 | 72 |
| 75000-100000+ | 4 | 16 |
Source: Field Survey 2008 Sample Size: 25 Households
Here we can see from above mentioned chart that different people have their different range of income. By seeing the different incomes of different households we can state that most of the families of Koshabhanga-1 were middle class. Like the families who get more than 30000 per year will fall under middle class family. We can see from the chart that around 72% of the people of Koshabhanga-1 have this range of income. In Koshabhanga-1 most of the families are middle class.
Educational Background of the members of Koshabhanga-1
Table: 3.6 Educational Backgrounds of the Villagers
| Level of Education | Male | Female | ||
| No | % | No | % | |
| Primary | 12 | 7.18% | 17 | 10.18% |
| Secondary | 7 | 4.19% | 2 | 3.17% |
| SSC | 7 | 4.19% | 1 | 1.2% |
| HSC | 3 | 1.8% | — | — |
| Graduation | 4 | 2.4% | — | — |
| Masters | — | — | — | — |
Source: Field Survey 2008 Sample Size: 25 Households
In our para we found out four graduated, three HSC passed, seven SSC passed, seven secondary and 12 primary school passed people.
Transact Map:
Transact mapping is one of the crucial part of village mapping. It is a representation, a sketch of a particular area of the village most resources were found or abundant. To draw out a transact map we had to choose a limited area and within that boundary we had to write down and describe what it is that we encountered from the very first foot step to the very last step. It shows the micro level of land use and how the people use that land.
Procedure:
The first thing to do is to choose an area from where we would begin the walk. Then we had to draw a rough sketch of the walk and the walking distance should be within 1-50 steps where one step is equal to 15 inches. while walking on the road one has to look at both sides of the road and pick the road that looks most resourceful. After choosing the road we had to observe and note down everything that we saw and we often asked the villagers if we did not understand anything. After we note down where everything is located and so on we draw out the final transact map
Transact Walk:
The transact walk depicts the organized diagram of the outline of elements that have been observed in the study area which is inclusive of the land use , the type of soil, vegetation and so on.
Application:
The main purpose of this kind of mapping is to exemplify the relationship between the different but important components of the village.
Description of the Transact Map:
For our transact map we took the west side of the village. This part was, out of our observation, considered to be most resourceful than any other part of the village. Our map begum with bamboo trees followed by some free land/spaces and then some houses followed by ponds and then houses again. The rest of the land was used for cultivation purposes.
Figure: Transact Map
Analysis of the Transact Map:
A transact map is very helpful because it gives a mental picture and a clear idea of the place. At a glance of the map one may paint a mental picture of the place, its surroundings and its condition. Listed below are the issues that had a major impact on our report:
Steps:
According to the instruction given, we took 250 steps for our transact map.
Land Use:
Within the transact area most of the land was used for cultivating purposes and the rest of the land was occupied by residence, trees and ponds.
Soil Type:
The total transact area’s soil was entirely sandy loam.
Crops:
In the high land we observed that the main crop was mustard. The other crops available in the transact area were paddy, maize, tobacco and cabbage.
Trees:
Many trees could be seen along the transact road, such as coconut trees, mango trees date trees, mehegoni, jack fruit trees, papaya trees and a large number of bamboo bushes.
House Type:
We found that most of the houses were made of tin. There was only one house that had a concrete floor but was surrounded by tin.
Pond Use:
The people of the village mainly used the ponds for washing their clothes or household items and would rarely catch fishes form those ponds.
Problems:
The problems that the villagers faced in the area were of gas and another major problem that we found was arsenic.
Findings:
- We did not find any primary or high school in that area.
- The total Para’s soil is sandy loam.
- There was no mosque and madrasa in the Para.
- We found that the village had electricity
- The major problem found in that village was of gas and arsenic.
Conclusion:
The village was not rural or that appalling than what someone might imagine a typical village to look like; it had a standard to some extent. We found out that the village people migrated to Dhaka city for employment and some of them even worked for the NGO’s present in that village area.
Even though the para did not have any schools the people were not ignorant and they did have some education or level of knowledge or understanding. We observed the reason that a number of people remained unmarried is because the parents grew aware of the legal age for marriage and therefore the level of early marriage has declined. We also observed that even though the villagers had tube wells they faced a major problem of arsenic, which is harmful because they use that water for drinking purposes also. Fortunately the people are conscious about personal hygiene because we found that most people use ring slabs rather than hanging slab, etc..
With the increase in the understanding of hygiene, etc we may look forward to schools being establish and also an establishment of a mosque so that the people may carry out their religious duties as well as build up their intellect.