Definition of SME
There are a lot of confusions regarding the definition of SME within the banking sectors. For example, BBL defines SME as enterprises with loan requirements of Tk 2-30 lacs. In Standard Chartered Bank, however, SME starts from Tk. 50 lacs. Again in the NCBs, SME includes even smaller enterprises with loan requirements of Tk. 50,000 or less. However, for the context of this report, SME will be counted as enterprises with loan requirements of Tk. 2-30 lacs.
Investments in the SME Sector by the Banking Industry
Category-wise Market Share
The market of SME loans is dominated mainly by the NCBs with a market share of 53.37%. The total size of the market is Tk. 45.652 billion. Category-wise distribution of SME loans in the banking industry is shown in the following table:
Table 7: Bank Category-wise Distribution of the Volume of SME Loans | ||
Figures in ‘000,000 BDT | ||
Volume | Percentage | |
| NCB | 23,294 | 53.37% |
| PCB | 11,125 | 25.49% |
| FCB | 2,450 | 5.61% |
| NSB | 6,778 | 15.53% |
| Total | 43,647 | 100.00% |
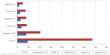
The top ten market players in the SME banking sector and their market share are shown below:
Reasons Behind the Dominance of NCBs
There are various reasons behind the dominance of NCBs in the SME sector. Unfortunately, NSBs, which are supposed to support the SME sector, could not make such a dominant presence in the industry. The reasons behind the dominance of NCBs in the SME sector are discussed below:
- Interest Rates: The NCBs invest in the small and medium industry at a very low interest rate. The average interest rate for SME loans in the different categories are compared below:
The lowest interest rate is in Agrani Bank which has an average interest rate of 7.50% only. The highest interest rate is in BBL, which is 17.05%.
- Network: The NCBs have a much better network in terms of branches established throughout the country. As a result, their contact is also far-reaching. The nature of SME clients is such that in order to reach them, a bank must have access to rural areas. As all transactions must be done through branches, it gives the NCBs a distinct advantage in the SME sector. The average branch size of the different banks in Bangladesh (category-wise) is shown in the following table:
Table 8: Category-wise Branch Strength of Banks | ||
Category | No. of Branches | Average Branch Size |
NCB | 2904 | 968 |
PCB | 2077 | 67 |
FCB | 18 | 18 |
NSB | 1335 | 267 |
Government Assistance: Bangladesh Bank provides financial assistance to NCBs and NSBs to invest in the SME sector. This allows them to operate, even with a loss, at a lower price than the other banks. This is one of the main reasons why the interest rates in the NCBs are so low and thus, attractive for the clients.
Growth in SME Financing by the Banking Industry
Investments in the SME sector have experienced an upward sloping curve in the last three years. From Figure 4 we can see that the NSBs have actually suffered negative growth in the year 2005. The growth rate for the PCBs is the highest at 83.61% over the period. The volume of loans in the NCBs increased at 13.20% and in the FCBs at 60%.
Comparison of the Growth Rate of the Major Players
The trend for the top ten market share holders is as follows:
This figure depicts the rather poor condition of the NSBs. The NCBs have experienced stagnant or negative growth during these three years. BBL and IFIC Bank have grown at a consistent rate during this period. Standard Chartered Bank has also made remarkable progress during this period. Janata Bank and RKUB have experienced negative growth in one year during this period while BSB had a constantly negative growth rate.
The growth rate in 2004 and 2005 of the top ten SME investing banks are as follows:
Table 9: Growth Rate for the Top Ten SME Investors | ||
Bank | 2004 | 2005 |
| Agrani Bank | 5.84% | 0.23% |
| Sonali Bank | 38.36% | 15.63% |
| Janata Bank | -15.06% | 10.31% |
| IFIC Bank | 38.85% | 26.49% |
| BRAC Bank | 81.75% | 48.62% |
| BSRS | 12.31% | 15.85% |
| SCB | 3542.86% | 60.13% |
| RKUB | 12.12% | -0.25% |
| Eastern Bank | 328.65% | 16.83% |
| BSB | -10.51% | -63.38% |
In both 2004 and, the highest growth rate was achieved by Standard Chartered Bank- 3542.86% and 60.13% respectively. However, as the bank has started SME banking only in 2004, this growth rate is expected. Same is the case for Eastern Bank Limited, which has experienced a growth of 328.65% in 2003. The growth rates for the NCBs are less because of the following reasons:
- Huge Volume: The NCBs are the market leaders in the SME banking segment. Because of the huge volume of SME loans they have already achieved, it is impossible for them to sustain the same growth rate.
- Existence for a Longer Period: The NCBs have started SME banking in the 1990s. It is impossible to maintain a high growth rate for such a long time. The SME market has almost reached the maturity stage for the NCBs.
- Aggressive Marketing by the PCBs: After their emergence in the SME sector in the early 2000s, the PCBs have adopted an aggressive strategy in marketing their SME products. This has enabled them to snatch away a considerable portion of the SME market from the NCBs. As they could not compete with the interest rates, they provided other facilities like minimum collateral and shorter processing time.
SME Banking in BBL
Contribution of the Major Business Divisions
As is shown from Figure 2, BBL is one of the major investors in the SME segment of Bangladesh’s economy with a market share of 7.78%. Even within the bank, SME consists of a major portion of the total loan portfolio. The bank policy requires that at least 50% of the total loan portfolio should be allocated to SME. The contribution of SME loans in BBL’s loan portfolio is shown in Figure 6.
The contribution of SME in the overall loan portfolio was highest in 2003 at 61.14%. However, in 2005, the contribution has decreased to 42.45%. This is mainly due to the management’s concentration on retail loan products, the share of which has increased from 17.55% in 2002 to 31.19% in 2006.
The total loan portfolio of BBL in the years 2002, 2003 and 2004 is shown in the following table:
Table 10: Division-wise Loan Portfolio of BBL | ||||
Figures in Million BDT | ||||
2002 | 2003 | 2004 | 2005 | |
| SME | 331 | 1,890 | 3,435 | 331 |
| Retail | 110 | 578 | 1,229 | 110 |
| Corporate | 184 | 623 | 1,405 | 184 |
| Total | 625 | 3,091 | 6,069 | 12,027 |
Growth in the Business Divisions of BBL
The growth rate in the business divisions of BBL are as follows:
Table 11: Growth in the Business Divisions of BBL | |||
| 2003 | 2004 | 2005 |
| SME | 470.72% | 81.76% | 48.61% |
| Retail | 426.41% | 112.72% | 205.10% |
| Corporate | 237.95% | 125.33% | 125.76% |
The year 2003 brought about huge growth in all the divisions of BBL. As the bank began its operations in late 2001, this was expected. Although the growth rate declined in the subsequent years, the bank still managed to sustain at least a 100% growth rate in the retail and corporate division. But the growth in the SME division continued to decline drastically through the years 2004 and 2005. This scenario is clearly depicted in the trend analysis of the loan volumes in the different business divisions of BBL.
Figure7 shows that SME has maintained a steady slope over the years, whereas the slope for retail and corporate has begun to become steeper after 2005. This indicates that retail and corporate are experiencing a greater growth than SME from 2004.
Product-wise Breakdown of SME Loans in BBL
The first product introduced in SME banking by BBL in 2001 was Anonno loan, which was an any-purpose loan with a range of Tk. 2-8 lacs. This loan still remains the most dominant product with a share of almost 85% of the SME loan portfolio. After the success of Anonno, Apurba was introduced with a range of Tk. 8-30 lacs. This product also became quite popular and now has a share of 12%. Aroggo and Pathshala were introduced in 2004 to capture specific segments of the SME market, namely the health-care and education sector. These loans have a combined portfolio share of 2.5%. The most recent loans, Digun Rin and Supplier Finance, have not made significant progress yet, and have a combined portfolio share of 0.5%.
Investment Sector-wise Breakdown of SME Products of BBL
Based on investment sector, BBL has segmented the SME market into 4 categories: Trade, Manufacturing, Agriculture and Services. The portfolio share in each of the segments is shown in Figure 9 and 10.
Although trading companies have an 87.43% share and service companies 1.57%, number-wise, the volume-wise share is 83.48% and 1.07% respectively. On the other hand, manufacturing and agro-based companies have a larger share in volume than in number of loans. This signifies the fact that the average loan size of trading companies is actually smaller than that of manufacturing and agriculture companies.
Sector-wise Growth
If we compare the sector-wise trend of SME loans as is shown in Figure 11, we can see that investment in the trading companies has the steepest curve. This indicates the huge increase volume-wise in this sector on a year-to-year basis. Service sector, on the other hand, has experienced slow increase in volume up to 2005. However, if we take a closer look at Figure 12 which indicates percentage increase on a year-to year basis, we can see that only the service sector has experienced an increasing trend in terms of percentage growth over the period. Investment growth in the manufacturing sector has also begun to increase from 2004. From these figures it can be concluded that although, the trading sector still accounts for the bulk of the portfolio, manufacturing and service sectors have enormous potential for growth.
Performance of SME Loans of BBL
The performance of a loan is determined by the repayment status of that loan. A loan has two statuses which determine its performance:
- Regular Loan: When the repayment of a loan is made on time it is considered to be a regular loan. A loan is performing as long as the installments of that loan are paid on time.
- Irregular Loan: A loan becomes irregular when the installments are not paid on time or when installments are missed. The number of irregular accounts reflects the overall credit quality of a loan portfolio because it is the point from where loan accounts tend to move towards being defaulted. Therefore the actual recovery efforts by the bank start here.
Performance in Comparison to Other Business Divisions
To analyze the performance of loans, BBL maintains records of overdue installments. In some cases, clients pay partial installments and in such situations, the installment is counted as per the proportion of paid amount to installment amount. There are two measures of performance evaluation in BBL.
- Portfolio at Risk (PAR): The percentage of the total outstanding amount of irregular loans is known as Portfolio at Risk (PAR). PAR is the total amount outstanding of the irregular portion of the loan accounts expressed as a percentage of the outstanding amount of total loan portfolio. It is so called because the chance of its becoming Bad Debt is more than the regular accounts and hence, this portion of the portfolio is deemed to be at risk. The performance of loans in the different business divisions of BBL as on December 31 2005 is shown in the following table:
Table 12: Performance of Loans in BBL | |||
Figures in BDT 000 | |||
Retail | SME | Corporate | |
| Outstanding (31 Dec 05) | 4,094,181 | 4,806,200 | 2,875,300 |
| Overdue 6 Installments & Above | 17,110 | 29,812 | 2,116 |
| Overdue 5-5.99 Installments | 10,355 | 29,495 | 1,645 |
| Overdue 4-4.99 Installments | 17,153 | 33,609 | 5,801 |
| Overdue 3-3.99 Installments | 29,592 | 36,609 | 2,693 |
| Overdue 2-2.99 Installments | 106,382 | 58,981 | 97,676 |
| Overdue 1-1.99 Installments | 287,690 | 79,733 | 150,854 |
| Total Overdue | 468,282 | 268,239 | 260,785 |
| PAR | 11.44% | 5.58% | 9.07% |
| Arrear-Outstanding Ratio | 0.0085 | 0.0497 | 0.0385 |
An analysis of the above table will reveal that in case of retail and corporate loans, most loans are irregular for one or two installments. The case is different with SME, though. In SME, the CROs pursue clients for repayment right from the first installment date. Therefore, the chances of irregularity are minimal. However, in case of larger SME loans, irregularity exists because the installment amounts sometimes become too big for the clients and they find it difficult to pay. In comparison with retail loans and corporate loans, the PAR is very low for SME loans.
- Arrear-Outstanding Ratio: The arrear amount of an overdue loan is the total amount of the installments that have been missed. The performance is calculated by dividing the total arrear amount by the total outstanding amount. The lower the ratio, the better is the performance of a particular loan or loan segment. The above table shows that the arrear-outstanding ratio of SME loans is higher than that of both retail and corporate loans. This can be explained by the following factors:
- In both retail and corporate loans, the volume of irregular loans in the 1-1.99 installments category is proportionately much higher than that of the other categories. In retail loans, this consists of 61.44% of the overdue volume, and in corporate loans this figure is 57.85%. As a consequence, the total arrear amount is also very low. Also, in case of SME loans, there is a uniformity of overdue volume in each category, where as in the other two divisions, the volume gradually goes down as the installments increase. This fact is better reflected in Figure 13.
- The loan size of SME and Corporate loans are larger than that of Retail loans. As the tenure is more or less the same for all types of loans, the installment size in retail is much smaller than those of SME and corporate. Hence, the arrear amount is also smaller.
Performance of SME Loans Over The Last Three Years
If we consider the PAR over the last three years, as is shown in Figure 14, we can see that the PAR of SME and Corporate loans has decreased in 2005, whereas that of retail loan depicts a reversal. The sudden increase in PAR of retail loans is due to the introduction and irregularity of one product- the Salary Loan, which makes up a bulk of the retail portfolio. The decreasing trend of PAR of SME loans is a reflection of their better performance. The trend for corporate loans is also decreasing. However, it has always been more than that of SME loans.
Figure 15 shows the arrear ratio of the BBL loans over the last three years. The ratio for retail loans and corporate loans is declining steadily, whereas that of SME loans is increasing steadily. In 2003, the ratio for corporate loans was much higher than those of SME and retail loans, which were almost identical. In 2004, the ratios for SME and corporate loans respectively were almost the same. This goes to show that in the SME sector, higher number of installments are becoming overdue, which is a cause for concern.
Sector-wise Performance
Figure 16 shows the sector-wise PAR of SME loans from 2003 to 2005. From the graph, it can be seen that the PAR in the service sector has undergone constant improvement going down from 3.73% in 2003 to 2.01% in 2005. PAR in the agriculture and the manufacturing sector have increased in 2004 whereas the PAR in trading sector has decreased to 5.07% in 2005 after increasing to 9.84% in 2004 from 8.23% in 2003. The PAR for the overall SME loans reflects the changes in the trading sector, mainly because of the huge market share of the sector. The agriculture sector has maintained a fairly stable PAR at and around 6% throughout the three-year period.