About Wage Curve
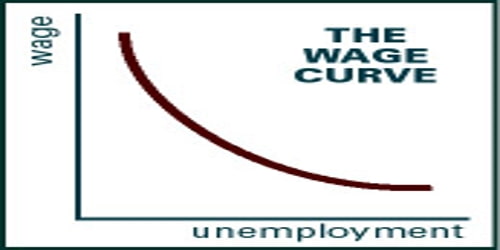
Wage curve is a curve which represents a relationship between the rate of unemployment (plotted on the X-axis) and the wage rate (represented on the Y-axis). According to David Blanchflower and Andrew Oswald (1994, p. 5), the wage curve summarizes the fact that “A worker who is employed in an area of high unemployment earns less than an identical individual who works in a region with low joblessness.”
The wage curve in a particular mall will be lower when the rate of unemployment is high. It’s is a representative of the relationship between the two variable at the local level i.e. between local wages and local level of unemployment.
One way to understand the wage curve is as follows. The labour supply of each individual is positively correlated with wages, therefore the higher is the hourly wage offered, the more hours an individual is willing to work. However, there is a limit to which every person would be willing to sacrifice an hour of leisure or rest, for an hour’s worth of wages. Let’s say that X is the maximum number of hours a person can work, and $A is the minimum hourly wage rate he expects in return. Any wage $B, greater than $A, will increase the worker’s daily wage without increasing the hours of work. So if you need more hours of work than X, you need to hire more people.
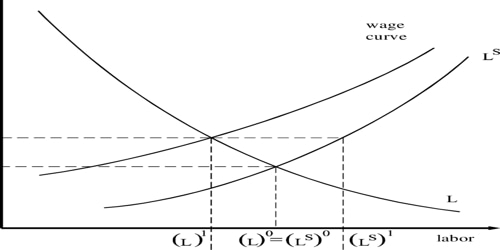
Labour supply is a function of wage rate. The higher the wage rate offered, the more is the supply of labour evident. This happens because it gives an individual the incentive to work for some extra hours if the need arises. Under normal circumstances, a labourer for a specific task gets Rs 100/hr. This is the wage rate at a time when there is no shortage of work and the workforce is available even for working some extra hours. Let’s assume a scenario where there are not many jobs in the labour market.
Example – If a person can put in a maximum of 8 hours of work daily @Rs. 80/hr. If the same person is paid @ Rs. 100/hr, which is higher in terms of returns that the person gets after putting in the same amount of work. Therefore, a number of people will be required for getting the work done.
The wage curve is found by estimating large regression equations. The procedure is the following. For each person, from each country, the data sets record the individual’s level of pay and his or her personal characteristics. In most instances, the name of the region in which the worker lives is also recorded in the data set. Rates of unemployment vary, as is well known, from one region to another and from one country to another. The analysis matches those unemployment rates for the sampled individuals.
In short – the lower unemployment is and the fewer the labourers there are available, the higher the wages. The contrary is true when the unemployment is high. This is the essence of the wage curve.
Information Source: