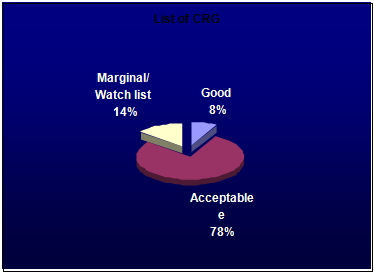
Type Of Credit Risk Grading
The main objectives of calculating the Credit Risk Grading to minimize risk. In our country all banks and financial institutes maintain and calculate The CRG in two ways
- First to calculate CRG for manufacturing, Trading, Sole proprietorship, Real Estate and Individual.
- Second to calculate CRG for NBFI (Non-Banking Financial Organization).
Top Ten Clients
¡ Bashundhara Import & Export Limited.
¡ Islam Trading Consortium Limited.
¡ Rangs Industries Limited.
¡ Deshbandhu Sugar Mills Limited.
¡ Amber Cotton Mills Limited.
¡ Metro Spinning.
¡ Yeasmin Spinning.
¡ S. Alam Cold Rolled Steels Limited.
¡ Thai Poly Shawn BD Limited.
¡ Guamati Filling Station & Service.
Southeast Bank limited, Principal Branch: Dhaka
CRG Position on 15.07.2008
Case-1 ( S.Alam Cold Rolled Steels Limited)
Analysis from Financial Statement:
S. ALAM COLD ROLLED STEELS LIMITED | ||
Balance Sheet as on 30.09.2007 (as submitted by the client) | ||
Particulars | Details Amount in BDT | Total amount in BDT |
| Current Assets calculation |
| |
| Stock | 2,465,526,662.00 |
|
| Book Debt | 879,296,451.00 |
|
| Advance, deposit and Pre-payments | 142,239,277.00 |
|
| Cash and Bank Balances | 21,451,930.00 |
|
| Total Current Assets | 3,508,514,320.00 | |
| Fixed Assets Calculation |
| |
| Tangible Fixed Assets | 1,437,114,119.00 |
|
| Preliminary Fixed Assets | 298,040.00 |
|
| Share Issue Expense | 6,341,498.00 |
|
| Total Fixed Assets | 1,443,753,657.00 | |
| ||
| Current Liability Calculation | ||
| Creditors and Accruals | 684,666,844.00 | |
| Advance against sales | 37,778,901.00 | |
| Short term Bank loan | 2,390,974,361.00 | |
| Provision for workers profit participation fund | 6,144,665.00 | |
| Unclaimed Divident | 3,973,500.00 | |
| Current portion of term loan | 107,248,800.00 | |
| Lease finance due within 01 year | 11,829,052.00 | |
| Propsoed Divident | 80,017,200.00 | |
| Deffered Income Tax | 70,004,579.00 | |
| Total Current Liability | 3,392,637,902.00 | |
| Loag term liability calculation | ||
| Term Loan (secured) | 788,289,421.00 | |
| Lease Finance (secured) | – | |
| Loan from Associated Companies (unsecured) | 216,640,519.00 | |
| Long term Loan | 1,004,929,940.00 | |
| Total Loan Liability | Current & fixed liability | 4,397,567,842.00 |
| Share Holders Equity calculation | ||
| share Capital | 533,448,000.00 | |
| Ratained Earnings | 21,252,135.00 | |
| Total shareholders equity | 554,700,135.00 | |
| TOTAL ASSETS | 4,952,267,977.00 | |
| TOTAL LIABILITIES AND OWNERS EQUITY | 4,952,267,977.00 | |
Profit & Loss Account | ||
| Net Sales | 1,339,096,004.00 | |
| Less: Cost of goods sold | 984,819,715.00 | |
| Gross Profit | 354,276,289.00 | |
| Less: Operating expenses | 34,226,135.00 | |
| Less: Financial Expenses | 197,156,847.00 | |
| Less: WPPWF | 6,144,665.00 | |
| Less : Amortization of preliminary Expanses | 149,020.00 | |
| Less: Amortization of Share Issue Expanses | 2,113,833.00 | |
| Net profit before tax | 114,485,789.00 | |
| Less: Provision for income tax | 42,916,841.00 | |
| Profit after Tax | 71,568,948.00 | |
| Calculation of EBITDA | ||
| Profit after tax | 71,568,948.00 | |
| Add: provision for tax | 42,916,841.00 | |
| Add: Financial Expenses | 197,156,847.00 | |
| Add: Amortization | 2,262,853.00 | |
| Add: Depreciation | 59,547,892.00 | |
| EBITDA | 373,453,381.00 | |
| Summery for Financial Risk Measurement as a part of CRG: | ||
| 1. Total Liabilities | 4,397,567,842.00 | |
| 2. Shareholders Equity | 554,700,135.00 | |
| 3. Current Assets | 3,508,514,320.00 | |
| 4. Current Liabilities | 3,392,637,902.00 | |
| 5. EBITAD | 373,453,381.00 | |
| 6. Interest on debt | 197,156,847.00 | |
| 7. Sales | 1,339,096,004.00 | |
| Debt-Equity Ratio | 7.93 | |
| Current Ratio | 1.03 | |
| Operating Profit Margin | 27.89% | |
| Interest Service Coverage Ratio | 1.89 | |
- Year of Establishment in 1996. (To get from proposal)
- Business outlook is Favorable. His or her market condition is very well because sales, profit, productivity has remarkable growth.
- He/she can’t enter/exit easily
- To count the each Director experience
- The scenario of private Ltd. Co. is good but may be opposite its public Ltd.
- Security risk depends on Collateral coverage. And guarantee
- S Alam Cold Rolled Steels Ltd. obtains the CRG number total 69. and we finance this organization because their sales, profit, product quality, payment of installment and overall company image is well.
CREDIT RISK GRADING SCORE SHEET | ||||
|
|
|
|
|
| Reference No.: |
| Date: | 16-Jul-08 | |
| Borrower | S Alam Cold Rolled Steels Ltd. | |||
| Group Name (if any) | N/a | Aggregate Score: | 69 | |
| Branch: | Principal Branch | |||
| Industry/Sector | Manufacturing | Risk Grading: | Marginal/Watch List | |
| Date of Financials | 30/09/2007 (Audited) | |||
| Completed by | Emran Ahmed, EO | |||
| Approved by | Mr. Giash Uddin Ahmed, SEVP & HoB | |||
Number | Grading | Short | Score | |
1 | Superior | SUP | Fully cash secured, secured by government guarantee/international bank guarantee | |
2 | Good | GD | 85+ | |
3 | Acceptable | ACCPT | 75-84 | |
4 | Marginal/Watchlist | MG/WL | 65-74 | |
5 | Special Mention | SM | 55-64 | |
6 | Substandard | SS | 45-54 | |
7 | Doubtful | DF | 35-44 | |
8 | Bad/Loss | BL | <35 | |
Criteria Weight | Parameter | Score | Actual Parameter | Score Obtained |
| A. Financial Risk 50% | ||||
| 1. Leverage: (15%) | Less than 0.25× | 15 | 7.93 | 0 |
| Debt Equity Ratio (×) – Times | 0.26× to 0.35 x | 14 |
| |
| Total Liabilities to Tangible Net worth | 0.36× to 0.50 x | 13 |
| |
| 0.51× to 0.75 x | 12 |
| ||
| All calculations should be based on | 0.76× to 1.25 x | 11 |
| |
| annual financial statements of the | 1.26× to 2.00 x | 10 |
| |
| borrower (audited preferred) | 2.01× to 2.50 x | 8 |
| |
| 2.51× to 2.75 x | 7 |
| ||
| More than 2.75× | 0 |
| ||
| 2. Liquidity: (15%) | Greater than 2.74× | 15 | 1.03 | 10 |
| Current Ratio (×) -Times | 2.50× to 2.74 x | 14 |
| |
| Current Assets to Current Liabilities | 2.00× to 2.49 x | 13 |
| |
| 1.50× to 1.99 x | 12 |
| ||
| 1.10× to 1.49 x | 11 |
| ||
| 0.90× to 1.09 x | 10 |
| ||
| 0.80× to 0.89 x | 8 |
| ||
| 0.70× to 0.79 x | 7 |
| ||
| Less than 0.70× | 0 |
| ||
| 3. Profitability: (15%) | Greater than 25% | 15 | 27.89 | 15 |
| Operating Profit Margin (%) | 20% to 24% | 14 |
| |
| ||||
| (Operating Profit/Sales) X 100 | 15% to 19% | 13 |
| |
| 10% to 14% | 12 |
| ||
| 7% to 9% | 10 |
| ||
| 4% to 6% | 9 |
| ||
| 1% to 3% | 7 |
| ||
| Less than 1% | 0 |
| ||
| 4. Coverage: (5%) |
| |||
| Interest Coverage Ratio (×) – Times |
| |||
Earning before interest & tax (EBIT) | More than 2.00× | 5 | 1.89 | 4 |
Interest on debt | More than 1.51× Less than 2.00× | 4 |
| |
| More than 1.25× Less than 1.50× | 3 |
| ||
| More than 1.00× Less than 1.24× | 2 |
| ||
| Less than 1.00× | 0 |
| ||
| Total Score- Financial Risk | 50 |
| 29 | |
|
|
| ||
| B. Business/ Industry Risk 18% |
| |||
| 1. Size of Business (in BDT crore) | > 60.00 | 5 | 133.90 | 5 |
| 30.00 – 59.99 | 4 |
| ||
| The size of the borrower’s business | 10.00 – 29.99 | 3 |
| |
| measured by the most recent year’s | 5.00 – 9.99 | 2 |
| |
| total sales. Preferably audited numbers. | 2.50 – 4.99 | 1 |
| |
| < 2.50 | 0 |
| ||
| 2. Age of Business | > 10 Years | 3 | 12 | 3 |
| > 5 – 10 Years | 2 |
| ||
| The number of years the borrower | 2 – 5 Years | 1 |
| |
| engaged in the primary line of business | < 2 Years | 0 |
| |
| 3. Business Outlook | Favorable | 3 | Favorable | 3 |
| Critical assessment of medium term | Stable | 2 |
| |
| prospects of industry, market share | Slightly Uncertain | 1 |
| |
| and economic factors. | Cause for Concern | 0 |
| |
| 4. Industry Growth | Strong (10%+) | 3 | Strong (10%+) | 3 |
| Good (>5% – 10%) | 2 |
| ||
| Moderate (1%-5%) | 1 |
| ||
| No Growth (<1%) | 0 |
| ||
| 5. Market Competition | Dominant Player | 2 | Dominant Player | 2 |
| Moderately Competitive | 1 |
| ||
| Highly Competitive | 0 |
| ||
| 6. Entry/Exit Barriers | Difficult | 2 | Difficult | 2 |
| Average | 1 |
| ||
| Easy | 0 |
| ||
| Total Score- Business/Industry Risk | 18 |
| 18 | |
|
|
| ||
| C. Management Risk 12% |
| |||
| 1. Experience | More than 10 years in the related line of business | 5 | More than 10 years in the related line of business | 5 |
| Quality of management based on total | 5–10 years in the related line of business | 3 |
| |
| # of years of experience of the senior | 1–5 years in the related line of business | 2 |
| |
| management in the Industry. | No experience | 0 |
| |
| 2. Second Line/ Succession | Ready Succession | 4 | Ready Succession | 4 |
| Succession within 1-2 years | 3 |
| ||
| Succession within 2-3 years | 2 |
| ||
| Succession in question | 0 |
| ||
| 3. Team Work | Very Good | 3 | Very Good | 3 |
| Moderate | 2 |
| ||
| Poor | 1 |
| ||
| Regular Conflict | 0 |
| ||
| Total Score- Management Risk | 12 |
| 12 | |
|
|
| ||
| D. Security Risk 10% |
| |||
| 1. Security Coverage (Primary) | Fully Pledged facilities/substantially cash covered / Reg. Mortg. for HBL | 4 | Registered Hypothecation (1st Charge/1st Pari passu Charge) | 3 |
| Registered Hypothecation (1st Charge/1st Pari passu Charge) | 3 |
| ||
| 2nd charge/Inferior charge | 2 |
| ||
| Simple hypothecation/Negative lien on assets | 1 |
| ||
| No security | 0 |
| ||
| 2. Collateral Coverage (Property Location) | Registered Mortgage on Municipal corporation/Prime Area property | 4 | No collateral | 0 |
| Registered Mortgage on Pourashava/Semi-Urban area property | 3 |
| ||
| Equitable Mortgage or No property but Plant and Machinery as collateral | 2 |
| ||
| Negative lien on collateral | 1 |
| ||
| No collateral | 0 |
| ||
| 3. Support (Guarantee) | Personal Guarantee with high net worth or Strong Corporate Guarantee | 2 | Personal Guarantee with high net worth or Strong Corporate Guarantee | 2 |
| Personal Guarantees or Corporate Guarantee with average financial strength | 1 |
| ||
| No support/guarantee | 0 |
| ||
| Total Score- Security Risk | 10 |
| 5 | |
| E. Relationship Risk 10% |
| |||
| 1. Account Conduct | More than 3 years Accounts with faultless record | 5 | Accounts having satisfactory dealings with some late payments. | 2 |
| Less than 3 years Accounts with faultless record | 4 |
| ||
| Accounts having satisfactory dealings with some late payments. | 2 |
| ||
| Frequent Past dues & Irregular dealings in account | 0 |
| ||
| 2. Utilization of Limit | More than 60% | 2 | 100.00% | 2 |
| (actual/projection) | 40% – 60% | 1 |
| |
| Less than 40% | 0 |
| ||
| 3. Compliance of Covenants / | Full Compliance | 2 | Some Non-Compliance | 1 |
| Conditions | Some Non-Compliance | 1 |
| |
| No Compliance | 0 |
| ||
| 4. Personal Deposits | Personal accounts of the key business Sponsors/ Principals are maintained in the bank, with significant deposits | 1 | No depository relationship | 0 |
| No depository relationship | 0 |
| ||
| Total Score- Relationship Risk | 10 |
| 5 | |
| Grand Total – All Risk | 100 |
| 69 | |
- S Alam Cold Rolled Steels Ltd. obtains the CRG number total 69. and we finance this organization because their sales, profit, product quality, payment of installment and overall company image is well.
Case-2 (Furnitec Industries Lt d.)
Furnitec Industries Limited
Analysis from Financial Statement
4.FURNITEC INDUSTRIES LIMITED,DHAKA | ||
| FINANCIAL RISK | 2007 | |
| 1.Leverage | ||
| Liability | ||
| Long Term Loan | ||
| SEBL/PB | 31,796,730 | |
| Current Liability | ||
| Bank Overdraft | 34,817,332 | |
| Provision for Tax | 2,249,130 | |
| Sundry Creditors | 135,468 | |
| Outstanding Loan | ||
| Wages | 375,200 | |
| Staff Salary & Allowance | 82,950 | |
| Showroom & Office Rent | 152,500 | |
| Electricity Bill | 6,915 | |
| Telephone & Fax Bill | 16,232 | |
| Audit Fee | 5,000 | |
| Leagal Fee | 10,000 | |
37,850,727 | ||
| Total Liability | 69,647,457 | |
| Equity | ||
| Paid up Capital | 10,000,000 | |
| Share Money Deposit | 17,000,000 | |
| Profit & Loss A/C | 7,966,634 | |
| Total Equity | 34,966,634 | |
| Total Liability/Total Equity | 1.991826179 | |
| 2.Liquidity | ||
| Current Assets | ||
| Priliminary Expenses | 20,500 | |
| Advance Deposit & Pre-Payment | 7,105,000 | |
| Unallocated Revenue Expenditure | 1,209,865 | |
| Closing Stock | 47,364,075 | |
| Raw materials | 30,962,868 | |
| Finish Goods | 16,401,207 | |
| Bills Receivable | 4,499,302 | |
| Cash & Bank Balance | 498,465 | |
| Total Current Assets | 60,697,207 | |
| Current Liability | ||
| Bank Overdraft | 34,817,332 | |
| Provision for Tax | 2,249,130 | |
| Sundry Creditors | 135,468 | |
| Outstanding Loan | ||
| Wages | 375,200 | |
| Staff Salary & Allowance | 82,950 | |
| Showroom & Office Rent | 152,500 | |
| Electricity Bill | 6,915 | |
| Telephone & Fax Bill | 16,232 | |
| Audit Fee | 5,000 | |
| Leagal Fee | 10,000 | |
37,850,727 | ||
| CA/CL | 1.603594219 | |
| 3.Profitability | ||
| Net Profit | 5,622,825 | |
| Add:Bank Interest & Charge | 4,185,383 | |
| Add:Depreciation (Admin) | 27,708 | |
| Add:Depreciation (Factory) | 4,900,083 | |
| EBITAD | 14,735,999 | |
| Sales | 48,875,325 | |
| (EBITAD/Sales)*100 | 30% | |
| 4.Coverage | ||
| EBITAD | 14,735,999 | |
| Interest/Financial Charge | 4,185,383 | |
| EBITAD/Interest | 3.520824498 | |
CREDIT RISK GRADING SCORE SHEET | ||||
|
|
|
|
|
| Reference No.: |
| Date: | 24-Jul-08 | |
| Borrower | Furnitec Industries Ltd | |||
| Group Name (if any) | N/a | Aggregate Score: | 75 | |
| Branch: | Principal Branch | |||
| Industry/Sector | Manufacturing,Trading | Risk Grading: | Acceptable | |
| Date of Financials | 30-Jun-07 | |||
| Completed by | Sayeed Sikder, Internee | |||
| Approved by | Habibur Rahman Molla, SPO | |||
Number | Grading | Short | Score | |
1 | Superior | SUP | Fully cash secured, secured by government guarantee/international bank guarantee | |
2 | Good | GD | 85+ | |
3 | Acceptable | ACCPT | 75-84 | |
4 | Marginal/Watch list | MG/WL | 65-74 | |
5 | Special Mention | SM | 55-64 | |
6 | Substandard | SS | 45-54 | |
7 | Doubtful | DF | 35-44 | |
8 | Bad/Loss | BL | <35 | |
| Criteria Weight | Parameter | Score | Actual Parameter | Score Obtained |
| A. Financial Risk 50% | ||||
| 1. Leverage: (15%) | Less than 0.25× | 15 | 1.99 | 10 |
| Debt Equity Ratio (×) – Times | 0.26× to 0.35 x | 14 |
| |
| Total Liabilities to Tangible Net worth | 0.36× to 0.50 x | 13 |
| |
| 0.51× to 0.75 x | 12 |
| ||
| All calculations should be based on | 0.76× to 1.25 x | 11 |
| |
| annual financial statements of the | 1.26× to 2.00 x | 10 |
| |
| borrower (audited preferred) | 2.01× to 2.50 x | 8 |
| |
| 2.51× to 2.75 x | 7 |
| ||
| More than 2.75× | 0 |
| ||
| 2. Liquidity: (15%) | Greater than 2.74× | 15 | 1.60 | 12 |
| Current Ratio (×) -Times | 2.50× to 2.74 x | 14 |
| |
| Current Assets to Current Liabilities | 2.00× to 2.49 x | 13 |
| |
| 1.50× to 1.99 x | 12 |
| ||
| 1.10× to 1.49 x | 11 |
| ||
| 0.90× to 1.09 x | 10 |
| ||
| 0.80× to 0.89 x | 8 |
| ||
| 0.70× to 0.79 x | 7 |
| ||
| Less than 0.70× | 0 |
| ||
| 3. Profitability: (15%) | Greater than 25% | 15 | 30% | 15 |
| Operating Profit Margin (%) | 20% to 24% | 14 |
| |
| (Operating Profit/Sales) X 100 | 15% to 19% | 13 |
| |
| 10% to 14% | 12 |
| ||
| 7% to 9% | 10 |
| ||
| 4% to 6% | 9 |
| ||
| 1% to 3% | 7 |
| ||
| Less than 1% | 0 |
| ||
| 4. Coverage: (5%) |
| |||
| Interest Coverage Ratio (×) – Times |
| |||
Earning before interest & tax (EBIT) | More than 2.00× | 5 | 3.50 | 5 |
Interest on debt | More than 1.51× Less than 2.00× | 4 |
| |
| More than 1.25× Less than 1.50× | 3 |
| ||
| More than 1.00× Less than 1.24× | 2 |
| ||
| Less than 1.00× | 0 |
| ||
| Total Score- Financial Risk | 50 |
| 42 | |
|
|
| ||
| B. Business/ Industry Risk 18% |
| |||
| 1. Size of Business (in BDT crore) | > 60.00 | 5 | 4.88 | 2 |
| 30.00 – 59.99 | 4 |
| ||
| The size of the borrower’s business | 10.00 – 29.99 | 3 |
| |
| measured by the most recent year’s | 5.00 – 9.99 | 2 |
| |
| total sales. Preferably audited numbers. | 2.50 – 4.99 | 1 |
| |
| < 2.50 | 0 |
| ||
| 2. Age of Business | > 10 Years | 3 | 4 | 1 |
| > 5 – 10 Years | 2 |
| ||
| The number of years the borrower | 2 – 5 Years | 1 |
| |
| engaged in the primary line of business | < 2 Years | 0 |
| |
| 3. Business Outlook | Favorable | 3 | Stable | 2 |
| Critical assesment of medium term | Stable | 2 |
| |
| prospects of industry, market share | Slightly Uncertain | 1 |
| |
| and economic factors. | Cause for Concern | 0 |
| |
| 4. Industry Growth | Strong (10%+) | 3 | Good (>5% – 10%) | 2 |
| Good (>5% – 10%) | 2 |
| ||
| Moderate (1%-5%) | 1 |
| ||
| No Growth (<1%) | 0 |
| ||
| 5. Market Competition | Dominant Player | 2 | Moderately Competitive | 1 |
| Moderately Competitive | 1 |
| ||
| Highly Competitive | 0 |
| ||
| 6. Entry/Exit Barriers | Difficult | 2 | Difficult | 2 |
| Average | 1 |
| ||
| Easy | 0 |
| ||
| Total Score- Business/Industry Risk | 18 |
| 10 | |
|
|
| ||
| C. Management Risk 12% |
| |||
| 1. Experience | More than 10 years in the related line of business | 5 | 1–5 years in the related line of business | 2 |
| Quality of management based on total | 5–10 years in the related line of business | 3 |
| |
| # of years of experience of the senior | 1–5 years in the related line of business | 2 |
| |
| management in the Industry. | No experience | 0 |
| |
| 2. Second Line/ Succession | Ready Succession | 4 | Ready Succession | 4 |
| Succession within 1-2 years | 3 |
| ||
| Succession within 2-3 years | 2 |
| ||
| Succession in question | 0 |
| ||
| 3. Team Work | Very Good | 3 | Very Good | 3 |
| Moderate | 2 |
| ||
| Poor | 1 |
| ||
| Regular Conflict | 0 |
| ||
| Total Score- Management Risk | 12 |
| 9 | |
|
|
| ||
| D. Security Risk 10% |
| |||
| 1. Security Coverage (Primary) | Fully Pledged facilities/substantially cash covered / Reg. Mortg. for HBL | 4 | Registered Hypothecation (1st Charge/1st Pari passu Charge) | 3 |
| Registered Hypothecation (1st Charge/1st Pari passu Charge) | 3 |
| ||
| 2nd charge/Inferior charge | 2 |
| ||
| Simple hypothecation/Negative lien on assets | 1 |
| ||
| No security | 0 |
| ||
| 2. Collateral Coverage (Property Location) | Registered Mortgage on Municipal corporation/Prime Area property | 4 | Registered Mortgage on Pourashava/Semi-Urban area property | 3 |
| Registered Mortgage on Pourashava/Semi-Urban area property | 3 |
| ||
| Equitable Mortgage or No property but Plant and Machinery as collateral | 2 |
| ||
| Negative lien on collateral | 1 |
| ||
| No collateral | 0 |
| ||
| 3. Support (Guarantee) | Personal Guarantee with high net worth or Strong Corporate Guarantee | 2 | Personal Guarantee with high net worth or Strong Corporate Guarantee | 2 |
| Personal Guarantees or Corporate Guarantee with average financial strength | 1 |
| ||
| No support/guarantee | 0 |
| ||
| Total Score- Security Risk | 10 |
| 8 | |
| E. Relationship Risk 10% |
| |||
| 1. Account Conduct | More than 3 years Accounts with faultless record | 5 | Accounts having satisfactory dealings with some late payments. | 2 |
| Less than 3 years Accounts with faultless record | 4 |
| ||
| Accounts having satisfactory dealings with some late payments. | 2 |
| ||
| Frequent Past dues & Irregular dealings in account | 0 |
| ||
| 2. Utilization of Limit | More than 60% | 2 | 80.00% | 2 |
| (actual/projection) | 40% – 60% | 1 |
| |
| Less than 40% | 0 |
| ||
| 3. Compliance of Covenants / | Full Compliance | 2 | Full Compliance | 2 |
| Conditions | Some Non-Compliance | 1 |
| |
| No Compliance | 0 |
| ||
| 4. Personal Deposits | Personal accounts of the key business Sponsors/ Principals are maintained in the bank, with significant deposits | 1 | No depository relationship | 0 |
| No depository relationship | 0 |
| ||
| Total Score- Relationship Risk | 10 |
| 6 | |
| Grand Total – All Risk | 100 |
| 75 | |
Furnitec Industries is a manufacturing and Trading Company. Their need minimum paid up Capital Tk.1 corer and Sales minimum Tk. 50-70 lac. But we consider about their Business.
Case-3 ( Thai Poly Shawn)
THAI POLY SHAWN | ||
2007 | 2006 | |
| A.FINANCIAL RISK | ||
| 1.Leverage | ||
| Liability | ||
| IPDC Loan | 6,606,812 | 9,394,486 |
| South Bank Ltd (Term Loan) | 2,498,656 | 7,527,884 |
| South Bank Ltd (Other) | 49,456,284 | 53,052,999 |
58,561,752 | 69,975,369 | |
| Current Liability | ||
| Creditors for Expenses | 2,877,112 | 2,535,871 |
| Sundry Creditors | 3,004,300 | 1,165,850 |
| Bank Overdraft (SEBL) | 4,981,699 | 5,175,977 |
10,863,111 | 8,877,698 | |
| Total Liability | 69,424,863 | 78,853,067 |
| Equity | ||
| Paid up Capital | 5,600,000 | 5,600,000 |
| Share money Deposit | 18,252,264 | 18,252,264 |
| Profit And Loss A/C | 1,486,755 | 975,398 |
| Tax Holyday Reserve | 998,635 | 657,731 |
26,337,654 | 25,485,393 | |
| Total Liability/ Total Equity | 2.63595471 | 3.094049482 |
| 2.Liquidity | ||
| Currene Asset | ||
| Cash in Hand | 52,226 | 48,334 |
| Cash in Bank | 5,196,757 | 6,777,948 |
| L/C Advance | 593,907 | 290,311 |
| Security Deposit | 354,640 | 354,640 |
| Stock and Stores | 46,385,202 | 51,127,541 |
| Bank Guarantee | 124,150 | 61,365 |
| Salary Advance | 180,998 | 125,164 |
| Total Current Assets | 52,887,880 | 58,785,303 |
| Current Liability | ||
| Creditors for Expenses | 2,877,112 | 2,535,871 |
| Sundry Creditors | 3,004,300 | 1,165,850 |
| Bank Overdraft (SEBL) | 4,981,699 | 5,175,977 |
10,863,111 | 8,877,698 | |
| CA/CL | 4.86857586 | 6.621683121 |
| 3.Profitability | ||
| Operation profit | ||
| Net Profit | 852,261 | 470,815 |
| Add: Depreciation | 96,936 | 100,114 |
| Add: Financial Charge | 5,824,949 | 7,840,655 |
| Interest on Term Loan (SEBL) | 430,773 | 1,673,173 |
| Interest on Loan (IPDC) | 926,558 | 1,816,729 |
| Interest on Short Term Loan(SEBL) | 3,476,290 | 3,046,037 |
| Interest on SEBL C/C A/C | 349,379 | 629,659 |
| Bank Charge & Commission | 641,949 | 675,057 |
| EBITAD | 6,774,146 | 8,411,584 |
| Sales | 229,681,344 | 348,441,361 |
| (EBITAD/Sales)*100 | 3.00% | 2.41% |
| 4.Coverage | ||
| EBITD | 6,774,146 | 8,411,584 |
| Interest/Financial Charge | 5,824,949 | 7,840,655 |
| EBITD/ Interest | 1.1629537 | 1.072816493 |
CREDIT RISK GRADING SCORE SHEET | ||||
|
|
|
|
|
| Reference No.: |
| Date: | 23-Sep-07 | |
| Borrower | Thai Poly Shawn (BD) Ltd. | |||
| Group Name (if any) | Aggregate Score: | 76 | ||
| Branch: | Principal | |||
| Industry/Sector | Manufacturer of plastic based packages wrapping | ` | Acceptable | |
| Date of Financials | 31.08.2007 | |||
| Completed by | Md. Habibur Rahman Mollah | |||
| Approved by | ||||
Number | Grading | Short | Score | |
1 | Superior | SUP | Fully cash secured, secured by government guarantee/international bank guarantee | |
2 | Good | GD | 85+ | |
3 | Acceptable | ACCPT | 75-84 | |
4 | Marginal/Watchlist | MG/WL | 65-74 | |
5 | Special Mention | SM | 55-64 | |
6 | Substandard | SS | 45-54 | |
7 | Doubtful | DF | 35-44 | |
8 | Bad/Loss | BL | <35 | |
Criteria Weight | Parameter | Score | Actual Parameter | Score Obtained |
| A. Financial Risk 50% | ||||
| 1. Leverage: (15%) | Less than 0.25× | 15 | 2.46 | 8 |
| Debt Equity Ratio (×) – Times | 0.26× to 0.35 x | 14 |
| |
| Total Liabilities to Tangible Net worth | 0.36× to 0.50 x | 13 |
| |
| 0.51× to 0.75 x | 12 |
| ||
| All calculations should be based on | 0.76× to 1.25 x | 11 |
| |
| annula financial statements of the | 1.26× to 2.00 x | 10 |
| |
| borrower (audited preferred) | 2.01× to 2.50 x | 8 |
| |
| 2.51× to 2.75 x | 7 |
| ||
| More than 2.75× | 0 |
| ||
| 2. Liquidity: (15%) | Greater than 2.74× | 15 | 4.87 | 15 |
| Current Ratio (×) -Times | 2.50× to 2.74 x | 14 |
| |
| Current Assets to Current Liabilities | 2.00× to 2.49 x | 13 |
| |
| 1.50× to 1.99 x | 12 |
| ||
| 1.10× to 1.49 x | 11 |
| ||
| 0.90× to 1.09 x | 10 |
| ||
| 0.80× to 0.89 x | 8 |
| ||
| 0.70× to 0.79 x | 7 |
| ||
| Less than 0.70× | 0 |
| ||
| 3. Profitability: (15%) | Greater than 25% | 15 | 3.00% | 7 |
| Operating Profit Margin (%) | 20% to 24% | 14 |
| |
| (Operating Profit/Sales) X 100 | 15% to 19% | 13 |
| |
| 10% to 14% | 12 |
| ||
| 7% to 9% | 10 |
| ||
| 4% to 6% | 9 |
| ||
| 1% to 3% | 7 |
| ||
| Less than 1% | 0 |
| ||
| 4. Coverage: (5%) |
| |||
| Interest Coverage Ratio (×) – Times |
| |||
Earning before interest & tax (EBIT) | More than 2.00× | 5 | 1.16 | 2 |
Interest on debt | More than 1.51× Less than 2.00× | 4 |
| |
| More than 1.25× Less than 1.50× | 3 |
| ||
| More than 1.00× Less than 1.24× | 2 |
| ||
| Less than 1.00× | 0 |
| ||
| Total Score- Financial Risk | 50 |
| 32 | |
|
|
| ||
| B. Business/ Industry Risk 18% |
| |||
| 1. Size of Business (in BDT crore) | > 60.00 | 5 | 35.00 | 4 |
| 30.00 – 59.99 | 4 |
| ||
| The size of the borrower’s business | 10.00 – 29.99 | 3 | Sales position as per financial statement as of 31.08.07 is Tk.22.96 crore. We assume that sales position at the end of this year will be more than Tk.35.00 crore. Their last years sales was Tk.34.84 crore. |
|
| measured by the most recent year’s | 5.00 – 9.99 | 2 |
| |
| total sales. Preferably audited numbers. | 2.50 – 4.99 | 1 |
| |
| < 2.50 | 0 |
| ||
| 2. Age of Business | > 10 Years | 3 | 10 | 3 |
| > 5 – 10 Years | 2 |
| ||
| The number of years the borrower | 2 – 5 Years | 1 |
| |
| engaged in the primary line of business | < 2 Years | 0 |
| |
| 3. Business Outlook | Favorable | 3 | Favorable | 3 |
| Critical assesment of medium term | Stable | 2 |
| |
| prospects of industry, market share | Slightly Uncertain | 1 |
| |
| and economic factors. | Cause for Concern | 0 |
| |
| 4. Industry Growth | Strong (10%+) | 3 | Strong (10%+) | 3 |
| Good (>5% – 10%) | 2 |
| ||
| Moderate (1%-5%) | 1 |
| ||
| No Growth (<1%) | 0 |
| ||
| 5. Market Competition | Dominant Player | 2 | Dominant Player | 2 |
| Moderately Competitive | 1 |
| ||
| Highly Competitive | 0 |
| ||
| 6. Entry/Exit Barriers | Difficult | 2 | Difficult | 2 |
| Average | 1 |
| ||
| Easy | 0 |
| ||
| Total Score- Business/Industry Risk | 18 |
| 17 | |
|
|
| ||
| C. Management Risk 12% |
| |||
| 1. Experience | More than 10 years in the related line of business | 5 | More than 10 years in the related line of business | 5 |
| Quality of management based on total | 5–10 years in the related line of business | 3 |
| |
| # of years of experience of the senior | 1–5 years in the related line of business | 2 |
| |
| management in the Industry. | No experience | 0 |
| |
| 2. Second Line/ Succession | Ready Succession | 4 | Ready Succession | 4 |
| Succession within 1-2 years | 3 |
| ||
| Succession within 2-3 years | 2 |
| ||
| Succession in question | 0 |
| ||
| 3. Team Work | Very Good | 3 | Very Good | 3 |
| Moderate | 2 |
| ||
| Poor | 1 |
| ||
| Regular Conflict | 0 |
| ||
| Total Score- Management Risk | 12 |
| 12 | |
|
|
| ||
| D. Security Risk 10% |
| |||
| 1. Security Coverage (Primary) | Fully Pledged facilities/substantially cash covered / Reg. Mortg. for HBL | 4 | Registered Hypothecation (1st Charge/1st Pari passu Charge) | 3 |
| Registered Hypothecation (1st Charge/1st Pari passu Charge) | 3 |
| ||
| 2nd charge/Inferior charge | 2 |
| ||
| Simple hypothecation/Negative lien on assets | 1 |
| ||
| No security | 0 |
| ||
| 2. Collateral Coverage (Property Location) | Registered Mortgage on Municipal corporation/Prime Area property | 4 | No collateral | 0 |
| Registered Mortgage on Pourashava/Semi-Urban area property | 3 |
| ||
| Equitable Mortgage or No property but Plant and Machinery as collateral | 2 |
| ||
| Negative lien on collateral | 1 |
| ||
| No collateral | 0 |
| ||
| 3. Support (Guarantee) | Personal Guarantee with high net worth or Strong Corporate Guarantee | 2 | Personal Guarantee with high net worth or Strong Corporate Guarantee | 2 |
| Personal Guarantees or Corporate Guarantee with average financial strength | 1 |
| ||
| No support/guarantee | 0 |
| ||
| Total Score- Security Risk | 10 |
| 5 | |
| E. Relationship Risk 10% |
| |||
| 1. Account Conduct | More than 3 years Accounts with faultless record | 5 | More than 3 years Accounts with faultless record | 5 |
| Less than 3 years Accounts with faultless record | 4 |
| ||
| Accounts having satisfactory dealings with some late payments. | 2 |
| ||
| Frequent Past dues & Irregular dealings in account | 0 |
| ||
| 2. Utilization of Limit | More than 60% | 2 | >60% | 2 |
| (actual/projection) | 40% – 60% | 1 |
| |
| Less than 40% | 0 |
| ||
| 3. Compliance of Covenants / | Full Compliance | 2 | Full Compliance | 2 |
| Conditions | Some Non-Compliance | 1 |
| |
| No Compliance | 0 |
| ||
| 4. Personal Deposits | Personal accounts of the key business Sponsors/ Principals are maintained in the bank, with significant deposits | 1 | Personal accounts of the key business Sponsors/ Principals are maintained in the bank, with significant deposits | 1 |
| No depository relationship | 0 |
| ||
| Total Score- Relationship Risk | 10 |
| 10 | |
| Grand Total – All Risk | 100 |
| 76 | |
Thus way I had calculated various types of clients CRG with financial statements and to gather practical experience.
Findings
There were some problems while I conducting the orientation program.
Lacking Of The Report
Proprietorship, Private (Home) Limited companies are not interested to maintain their Balance Sheet and they have no accounts department or not healthy because they have no accountability.
Audit firm prepare their Balance sheet basis on favor them. Such as,
Profitable organization———– Show the Banks or Financial Institute, when needs funded.
Loosing organization————- Show the NBR (National Board Revenue), when they provide Tax.
Actual or real B/S—————– Prepares internally for own satisfaction
In particular area can not find out actual Business growth. Because, there have no institute to maintain or collect up to date data.
Small and Medium Entrepreneurs has minimum pain-up capital Tk.1 corer and sales or turnover 50 to 70 lac in a year but CRG manual show, sales must be increased which maximum Tk.60 corer and minimum Tk.2.50 corer. So, they can’t obtain good number.
Most of the time Private (Home) Limited company has no ready succession. This is uncertainty for the Banks.
Most of the banker marking the qualitative judgments depend on own opinion.
A particular business economic situation affected by the Political and natural situation.
As a result, the main objectives of the CRG to minimized the risk, it will be quite destroy
Improvement Of The CRG
Any Banks or financial institute can change or improve The CRG manual depends on their strategy. I am also discuss with the officer about the improve CRG manual and I think,
Proprietorship, Private (Home) Limited companies must be provided Tax return certificate to banks or financial institutes for funded.
NBR (National Board Revenue) should collect information about financial statement of the client from the Banks.
To established an institute by state for collecting latest information.
Strict regulations should be made to ensure transparency and accountability of activities the audit firms.
Conclusion
I have focused and analyzed on Credit Risk Grading system of Southeast Bank Ltd. The Banking sector in any country plays an important role in economic activities. Bangladesh is no exception of that. As because it’s financial development and economic development are closely related. That is why the private commercial banks are playing significant role in this regard.
The Credit Risk Grading minimize this problem because include this methods provide a specific guideline about lending criteria. Well-managed credit risk grading systems promote bank safety and soundness by facilitating informed decision-making. Grading systems measure credit risk and differentiate individual credits and groups of credits by the risk they pose. This allows bank management and examiners to monitor changes and trends in risk levels.
Bangladesh Bank expects all commercial banks to have a well defined credit risk management system which delivers accurate and timely risk grading. This manual describes the elements of an effective internal process for grading credit risk. It also provides a comprehensive, but generic discussion of the objectives and general characteristics of effective credit risk grading system. In practice, a bank’s credit risk grading system should reflect the complexity of its lending activities and the overall level of risk involved.
Some More Parts-
Credit Risk Grading(CRG) In Southest Bank Limited (Part-1)
Credit Risk Grading(CRG) In Southest Bank Limited (Part-2)