5.8 Consumer Credit:
With the steady development of the industrial and the service sectors in Bangladesh, the level of personal consumption has recorded progressive growth. To cater to the growing demand for consumer durables, Sonali Bank Limited has launched the “Consumers’ Credit Scheme”, with the following features
| Eligibility | :Permanent employees with 5 years’ service in Govt., Semi-Govt. organization and Autonomous & recognized bodies. |
| Loan Limit | : Maximum Tk. 1.00 lac. |
| Debt-equity ratio | :75:25 |
| Interest rate(w.e.f. 01, September 2009) | :14.00% |
| Mode of repayment | : Monthly installment. |
| Period of loan | : Maximum 3 years. |
| Security | : a) Hypothecation of consumer goods to be purchased. b) Letter of guarantee from the employer. c) No objection certificate & salary certificate from employer. d) Lien on provident fund/gratuity. |
| Designated Branches | : All district branches and the corporate branches. |
5.9 Loan Facility for Diagonstic Center:
Sonali Bank Limited has launched a new loan scheme for “Diagnostic Center” to promote medical facilities. The salient features of the scheme are as follows:
| Nature of loan | : Cash Credit (Hypothecation). |
| Debt-equity ratio | : 60:40 |
| Interest rate(w.e.f. 01, September 2009) | : 14.00% |
| Primary Security | : Stock of Chemicals, X-ray papers, Injection Syringe, Medicine etc. |
| Collateral Security | : Collateral security twice the value of the loan is required. |
| Period of Loan | : One Year. |
5.10 Special Small Credit Scheme:
Sonali Bank Limited has launched a loan scheme for “Teachers and Employees” to enhance their living standards. The salient features of the scheme are as follows:
| Eligibility | :Permanent employees and teachers with 3 years’ service in Govt., Semi-Govt. organization and Autonomous & recognized bodies. |
| Loan Limit | : Tk.20, 000 to Tk. 9.00 lacs. |
| Margin | : Maximum 20% of loan limit. |
| Interest rate(w.e.f. 01, September 2009) | :12.00% |
| Mode of repayment | : Monthly installment. |
| Period of loan | : Maximum 3 years. |
| Products purchased by the loan | Personal computer, printer, scanner.Sewing and embroidery machine. Refrigerator, freezer, television, furniture and electronic fan. Motor cycle or by cycle. Solar power or bio-gas plant. Nursery or vegetable firm. Poultry, dairy, fishery plant. Marketing of agricultural products.
|
| Designated Branches | : All district branches and the corporate branches. |
5.11 Foreign Employment Credit Scheme:
Sonali Bank Limited has launched a loan scheme for “Foreign employment” to bear their air heir, commission and charges for foreign employment agency. The salient features of the scheme are as follows:
| Eligibility | : Bangladeshi permanent employees in foreign countries who has work permit and visa. |
| Loan Limit | : Maximum Tk. 3.00 lacs. |
| Interest rate(w.e.f. 01, September 2009) | :12.00% |
| Mode of repayment | : Monthly installment. |
| Period of loan | : 3 months grace period and Maximum 3 years. |
| Designated Branches | : All district branches and the corporate branches. |
6.1 Performance at a glance
(Tk. in crore)
| Year | 2008 | 2007 | 2006 | 2005 | 2004 |
| Total Income | 2662.10 | 1429.02 | 2313.17 | 1986.39 | 1575.84 |
| Total Expenses | 2500.41 | 1004.32 | 2012.59 | 1590.03 | 1480.59 |
| Total Operating Profit | 161.69 | 424.70 | 300.58 | 396.36 | 95.25 |
| Net Profit/Net Loss | 231.11 | 97.36 | (3627.56) | 20.80 | 15.75 |
| Paid-up Capital | 900.00 | 900.00 | 500.00 | 327.22 | 327.22 |
| Reserve Fund | 1246.95 | 1196.28 | 283.13 | 303.40 | 283.40 |
| Deposits | 36438.60 | 32899.72 | 30230.30 | 27707.90 | 25223.39 |
| Advances | 23116.66 | 20634.76 | 24102.93 | 22700.96 | 16828.30 |
| Export | 18283.46 | 17022.42 | 17814.40 | 13957.36 | 12759.28 |
| Import | 16420.80 | 8881.96 | 8279.60 | 12984.31 | 9153.89 |
| No. of Employees:Officer Staff | 11507 10332 | 11769 10773 | 12118 11155 | 12380 11553 | 12732 11718 |
| Total | 21839 | 22542 | 23273 | 23933 | 24450 |
| No. of Branches:Urban Rural | 563 619 | 562 621 | 562 621 | 562 621 | 490 696 |
| Total | 1182 | 1183 | 1183 | 1183 | 1186 |
6.2 Common-size Statement (Balance Sheet)
| PROPERTY AND ASSETS | TAKA | % |
| Cash | 20,641,592,198 | 4.1873929 |
| Cash in hand (including foreign currency) | 4,366,813,852 | 0.8858602 |
| Balance with Bangladesh Bank and its agentBank | 16,274,778,346 | 3.3015327 |
| Balance with other Banks and financial institutions | 9,979,717,359 | 2.0245046 |
| In Bangladesh | 5,265,819,000 | 1.0682341 |
| Outside Bangladesh | 4,713,898,359 | 0.9562705 |
| Money at call and short notice | 250,857,360 | 0.0508894 |
| Investments: | 95,093,241,199 | 19.290797 |
| Government | 93,947,843,070 | 19.058439 |
| Others | 1,145,398,129 | 0.2323577 |
| Loans and Advances | 231,166,579,465 | 46.894895 |
| Loans, Cash Credits, Overdrafts etc. | 208,184,384,025 | 42.232683 |
| Bills purchased& discounted | 22,982,195,440 | 4.6622122 |
| Fixed assets including premises, furniture and fixtures | 9,920,927,663 | 2.0125784 |
| Other assets | 125,893,233,074 | 25.538942 |
| Total Assets | 492,946,148,318 | 100 |
| LIABILITIES AND CAPITAL | ||
| Liabilities | ||
| Borrowings from other banks, financial institutions and agents | 545,955,691 | 0.1107536 |
| Deposit and other accounts | 364,385,970,931 | 73.920036 |
| Current Accounts and other Accounts | 98,795,523,389 | 20.041849 |
| Bills payable | 6,642,924,279 | 1.3475963 |
| Savings Bank Deposits | 120,423,161,432 | 24.429273 |
| Fixed Deposits | 138,524,361,831 | 28.101317 |
| Other Deposits | 0 | 0 |
| Other Liabilities | 103,596,507,559 | 21.015786 |
| Total Liabilities | 468,528,434,181 | 95.046576 |
| Capital/ Shareholder’s Equity | ||
| Paid up capital | 9,000,000,000 | 1.8257572 |
| Statutory Reserve | 3,116,476,533 | 0.6322144 |
| Other Reserve | 9,353,019,515 | 1.8973715 |
| Surplus in Profit and Loss A/C / Retained Earnings | 2,948,218,089 | 0.5980812 |
| Total Shareholders’ Equity | 24,417,714,137 | 4.9534243 |
| Total Liabilities and Shareholders’ Equity | 492,946,148,318 | 100 |
6.3 Evaluating Liquidity Position
Current Ratio:
Current Assets
Current Liabilities
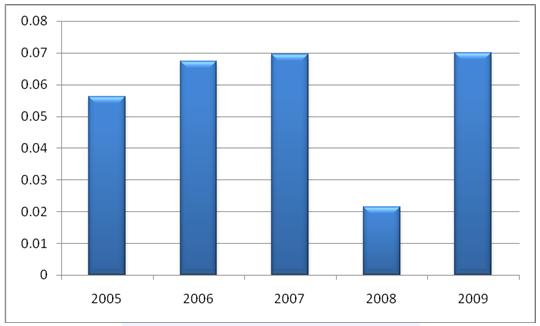
Year | Current Assets | Current Liabilities | Current Ratio |
2005 | 11464318193 | 309692580346 | 0.037018382 |
2006 | 30842225314 | 290140094220 | 0.106301149 |
2007 | 32241852735 | 335987250854 | 0.095961536 |
2008 | 30872166917 | 964931926622 | 0.03199414 |
2009 | 42110002834 | 406211694002 | 0.103665166 |
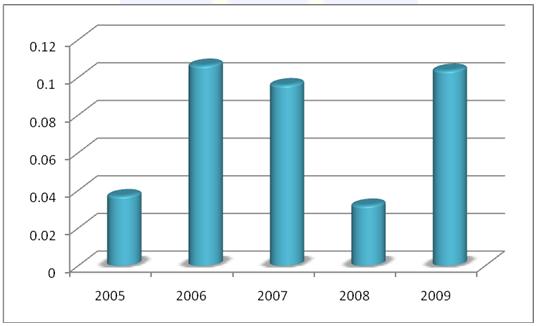
Graph-1: Current Ratio
Interpretation: The current ratio of Sonali Bank limited has increased from year 2005 to 2006 but from year 2007 the current ratio is decreasing. Again in year 2009 ratio is increased. That means it has average liquidity position. The firm can able to pay its current obligations.
Cash Ratio:
Cash+ Marketable Securities
Current Liabilities
Graph-2: Cash ratio
Interpretation: The cash ratios of Sonali Bank limited for the first 3 years are increasing but in the year 2008 the ratio is quite low.That indicates the firm has strong lines of cash available on short notice. In year 2009 again the ratio is increased.
6.4 Evaluation of Operating Efficiency
Net Working Capital:
Current Assets – Current Liabilities
(Taka in Millions)
Year | Current Assets | Current Liabilities | Net Working Capital |
2005 | 11464.31 | 309692.58 | (298228.26) |
2006 | 30842.22 | 290140.09 | (259297.86) |
2007 | 32241.85 | 335987.25 | (303745.39) |
2008 | 30872.16 | 964931.92 | (934059.75) |
2009 | 42110.00 | 406211.69 | (364101.69) |
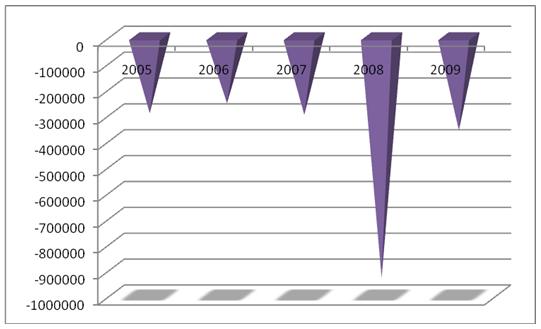
Graph-3: Net Working Capital
Interpretation: Net Working Capital of Sonali bank Limited for the 5 years has shown negative trend. In 2008 it was highest shortfall of net working capital. However in 2009 the bank has improved its level of net working capital. But still net working capital shows negative. The bank should take necessary steps to improve its net working capital level by turning the negative position into positive.
Interest Margin:
Interest Income – Interest Paid
Year | Interest Income | Interest Paid | Interest Margin |
2005 | 11968455635 | 11413075053 | 555380582 |
2006 | 15962873888 | 15039410984 | 923462904 |
2007 | 8962089341 | 6625390799 | 2336698542 |
2008 | 13101861774 | 13965929070 | (864067296) |
2009 | 17683108223 | 15800026939 | 1883081284 |
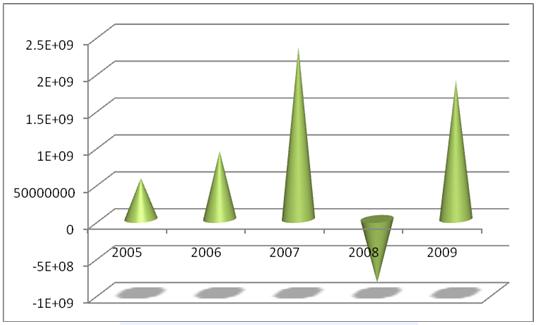
Graph-4: Interest Margin
Interpretation: For first 3 years, Sonali Bank Limited’s Interest margin exhibit increasing trend. But in 2008 the margin became negative. However in 2009 the interest margin position had improved. The bank may take necessary steps to improve further the interest margin.
Cost of Deposit:
Interest Paid X 100
Average Deposit
Year | Interest Paid | Average Deposit | Cost of Deposit (%) |
2005 | 11413075053 | 277079059813 | 4.11 |
2006 | 15039410984 | 302303013211 | 4.97 |
2007 | 6625390799 | 328997209441 | 2.01 |
2008 | 13965929070 | 364385970931 | 3.83 |
2009 | 15800026939 | 406151569403 | 3.89 |
Graph-5: Cost of deposit
Interpretation: Cost of deposit of Sonali Bank limited in 2006 was highest and in 2007 it was lowest. Sonali Bank Limited should take necessary steps to mobilize low cost or no cost deposits to keep the Cost of deposit at minimum.
Return on Credit:
Interest income X 100
Average Loans and Advances
Year | Interest Income | Average Loans and Advances | Return on credit (%) |
2005 | 11968455635 | 227009620206 | 5.27 |
2006 | 15962873888 | 241029268443 | 6.62 |
2007 | 8962089341 | 206347592413 | 4.34 |
2008 | 13101861774 | 231166579465 | 5.67 |
2009 | 17683108223 | 254022504699 | 6.96 |
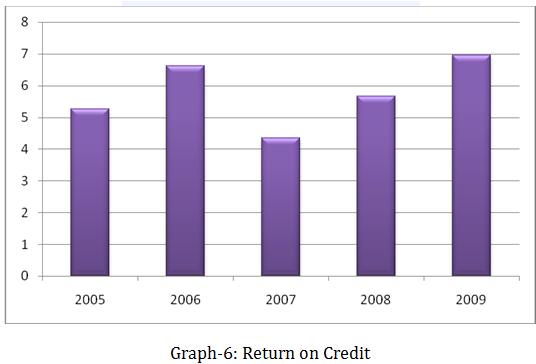
Interpretation: Return on credit of Sonali Bank limited in 2009 was highest and in 2007 it was lowest. Sonali Bank Limited should take necessary steps to mobilize high return on credit to keep the return on credit at maximum.
6.5 Operating Profitability Ratios
Return on Total Assets (ROA):
Net Profit before Tax X 100
Total Assets
Year | Net Profit before Tax | Total Assets | Return on Total Assets (%) |
2005 | 208038723 | 337687117072 | 0.06 |
2006 | (36275634028) | 35293818371 | -10.27 |
2007 | (1834170743) | 461946232939 | -0.39 |
2008 | 1336450387 | 492949148318 | 0.27 |
2009 | 2244267216 | 543969267865 | 0.41 |
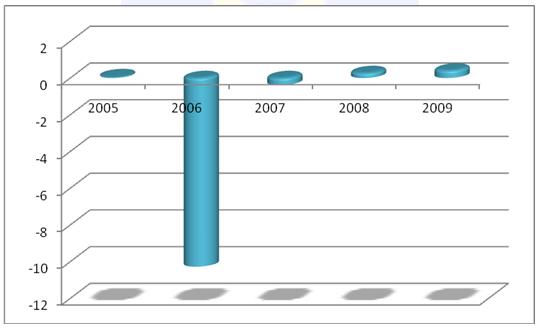
Graph-7: Return on total assets
Interpretation: Return on Total assets of Sonali Bank Limited in 2006 was lowest and after 2006 the return on total assets were increasing. That shows Sonali Bank Limited tries to enhance their net profit before tax generating from assets.
Return on Equity (ROE):
Net Profit after Tax X 100
Total Equity
Year | Net Profit After Tax | Total Equity | Return on Equity (%) |
2005 | 208038723 | 6306200000 | 3.29 |
2006 | (36275634028) | (28444370219) | -127.53 |
2007 | 2311114502 | 21741728899 | 10.62 |
2008 | 973580120 | 24417714137 | 3.98 |
2009 | 1536766608 | 30475358113 | 0.50 |
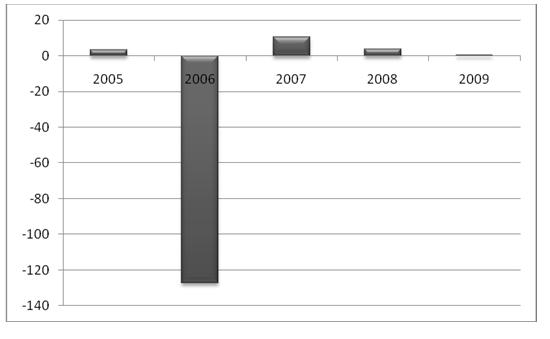
Graph-8: Return on Equity
Interpretation: Return on Equity of Sonali Bank Limited in 2006 was lowest and in 2007 the return on was highest. Sonali Bank Limited should take necessary steps to enhance their net profit after tax using equity.
For more parts of this post, click the following links-
Financial Performance Analysis of Sonali Bank Limited.(part-1)
Financial Performance Analysis of Sonali Bank Limited.(part-2)
Financial Performance Analysis of Sonali Bank Limited.(part-3)
Financial Performance Analysis of Sonali Bank Limited.(part-4)
Financial Performance Analysis of Sonali Bank Limited.(part-5)
Financial Performance Analysis of Sonali Bank Limited.(part-6)