Assignment on Financial Report and Ratio Analysis in
Beximco Pharmaceuticals Limited
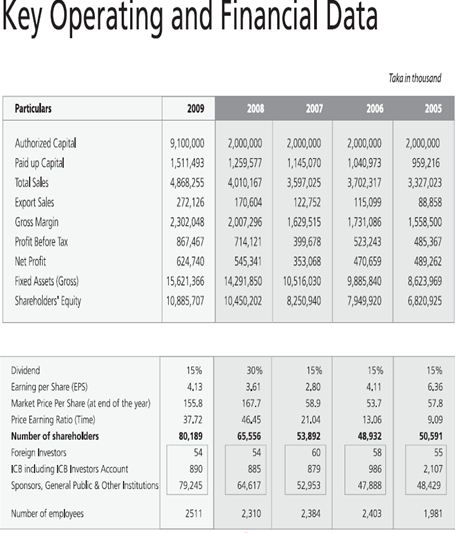
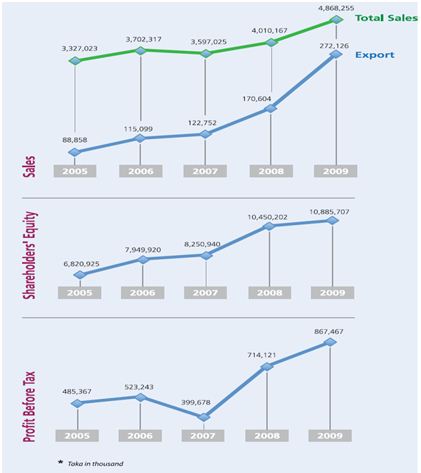
Beximco Pharmaceuticals Ltd. is a leading edge pharmaceutical company based in Dhaka, Bangladesh and is acclaimed for its outstanding product quality, world-class manufacturing facilities, product development capabilities and outstanding professional services. Beximco Pharma is the pioneer in pharmaceutical export from Bangladesh and has received National Export Trophy (Gold), the highest national accolade for export, for record three times.
Introduction
The purpose of accounting is to provide the information that is needed for sound economic decision making. The main purpose of financial accounting is to prepare financial reports that provide information about a firm’s performance to external parties such as investors, creditors, and tax authorities. Managerial accounting contrasts with financial accounting in that managerial accounting is for internal decision making and does not have to follow any rules issued by standard-setting bodies. Financial accounting, on the other hand, is performed according to Generally Accepted Accounting Principles (GAAP) guidelines. Financial Accounting is the process that culminates in the preparation of financial reports on the enterprise as a whole for use by both internal and external parties .Financial Statement are the principles means through which financial information is communicated to those outside an enterprise .These statements provide the company History quantified in money terms .
Financial Statement
Financial statements paint a picture of the transactions that flow through a business. Each transaction or exchange – for example, the sale of a product or the use of a rented a building block – contributes to the whole picture.
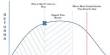
Let’s approach the financial statements by following a flow of cash-based transactions. In the illustration below, we have numbered four major steps:
- Shareholders and lenders supply capital (cash) to the company.
- The capital suppliers have claims on the company. The balance sheet is an updated record of the capital invested in the business. On the right-hand side of the balance sheet, lenders hold liabilities and shareholders hold equity. The equity claim is “residual”, which means shareholders own whatever assets remain after deducting liabilities.The capital is used to buy assets, which are itemized on the left-hand side of the balance sheet. The assets are current, such as inventory, or long-term, such as a manufacturing plant.
- The assets are deployed to create cash flow in the current year (cash inflows are shown in green, outflows shown in red). Selling equity and issuing debt start the process by raising cash. The company then “puts the cash to use” by purchasing assets in order to create (build or buy) inventory. The inventory helps the company make sales (generate revenue), and most of the revenue is used to pay operating costs, which include salaries.
After paying costs (and taxes), the company can do three things with its cash profits. One, it can (or probably must) pay interest on its debt. Two, it can pay dividends to shareholders at its discretion. And three, it can retain or re-invest the remaining profits. The retained profits increase the shareholders’ equity account (retained earnings). In theory, these reinvested funds are held for the shareholders’ benefit and reflected in a higher share price.
This basic flow of cash through the business introduces two financial statements: the balance sheet and the statement of cash flows. It is often said that the balance sheet is a static financial snapshot taken at the end of the year
Rules for analysis of Financial Statement
- Working Capital = Current Assets – Current Liability
- Current Ratio = Current Assets / Current Liability (X)
- Quick Ratio = (Current Assets – Inventory) / Current Liability (X)
- Return on Asset (ROA) = Net Income / Total Asset x100 (%)
- Return on Equity (ROE) = Net Income / Total Stock Holders Equity x100 (%)
- Debt Ratio = Total Debt / Total Asset x100 (%) (Total Debt = Total Liability)
- EPS (Earning Per Share) = Net Income / Number of Share outstanding
(Outstanding Share=Total Value of Share/ Face Value of Share)
- Gross Margin Ratio = Gross Margin / Net Sale x 100 (%)
(Earning Before Interest & Tax)
- Operating Margin Ratio = Operating Profit / Net Sale x 100 (%)
- Net Profit Ratio = Net Profit / Net Sale x 100 (%)
(Net Profit = Net Income)
- Inventory Turnover = COGS / Inventory x 100 (%)
(Cost of Goods Sold)
- Account Receivable Turnover = Sales/ Account Receivable x 100(%)
Solution
Working Capital = Current Assets – Current Liability
2009
Working Capital = 6916737893 – 2321451642
= 66845927251
Comments: The Position of the Company is satisfactory
Current Ratio = Current Assets / Current Liability (2009)
Current Ratio = 6916737893 ÷ 2321451642
= 1.283
Comments: The standard value of current ratio is 2:1, so that the position of the company is not satisfactory.
Quick Ratio = (Current Assets – Inventory) / Current Liability (2009)
Quick Ratio= (6916737893-1722953284)/ 2321451642 = 2.23
Comments: The standard value of current ratio is 1:1, so that the position of the company is satisfactory.
Return on Asset (ROA) = Net Income / Total Asset (2009)
Return on Asset (ROA) = 151149296÷ 19891933422 = 0.759%
Return on Equity (ROE) = Net Income / Total Stock Holders Equity x100 (2009)
Return on Equity (ROE) = 151149296 ÷ 10885706614 = 1.388%
Debt Ratio = Total Asset-Total Equity / Total Asset x100
Debt Ratio = 9006226810÷19891933422 = 45.275%
Comments: The standard value of Gross Margin Ratio is 40%-60%, so that the position of the company is well.
Gross Margin Ratio = Gross Margin / Net Sale x 100
(Earnings before Interest & Tax)
Gross Margin Ratio = 2302048289÷4868254915 = 47.286%
Comments: The standard value of Gross Margin Ratio is 30%-40%, so that the position of the company is excellent.
Operating Margin Ratio = Operating Profit / Net Sale x 100
Operating Margin Ratio =1001282411÷ 4868254915 =20.567%
Comments: The standard value of Gross Margin Ratio is 5%-10%, so that the position of the company is satisfactory.
Net Profit Ratio = Net Profit / Net Sale x 100
Net Profit Ratio = 151149296 ÷ 4868254915
= 3.104%
Comments: The standard value of Net Profit Ratio is 5%-10%, so that the position of the company is not satisfactory.
Inventory Turnover = COGS / Inventory x 100
(Cost of Goods Sold)
Inventory Turnover = 2566206626÷1722953284 = 148.942%
Comments: The Position of the Company is satisfactory.
Account Receivable Turnover = Sales/ Account Receivable x 100
Account Receivable Turnover = 4868254915÷694111730 = 701.364%
Comments: The Position of the Company is satisfactory.
Ending Summary
the financial statements prepared in accordance with International Financial Reporting Standards (IFRSs), including International Accounting Standards (IASs), give a true and fair view of the state of the company’s affairs as of December 31, 2009 and of the results of its operations and its cash flows for the year then ended and comply with the applicable sections of the Companies Act 1994, the Securities and Exchange Rules 1987 and other applicable laws
Balance Sheet of the Beximco Pharmaceuticals Limited as of December 31, 2009 and the related Profit and Loss Account, Statement of Changes in Equity and Statement of Cash Flows for the year then ended. These financial statements are the responsibility of the company’s management.