Comment:
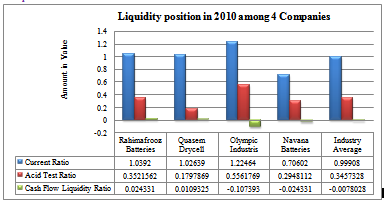
Rahimafrooz Batteries Limited has the cash flow ratio 0.21360 increased indicating stronger short-term solvency compared to the Quasem Drycell Limited (0.18194).On the other hand, Olympic Industries Limited (1.01918) is the strongest short term solvency among them.But Navana Batteries Limited (0.26856) is somewhat stronger short term solvency compared to Rahimafrooz Batteries Limited ,where current ratio and acid test ratio was poor.here,there is increased payable Tk.181173288.(from vertical analysis of Balance sheet).
Competitive Market Position:
The liquidity position of Rahimafrooz Batteries Limited is comparably satisfactory among the four companies.Rahimafrooz Companies captures current ratio 1.03 times compared to industry average 0.99908, acid test ratio 0.3521562 times compared to industry average 0.3457328 times and cash flow liquidity ratio captures 0.024331 compared to industry average -0.0078028 times.So, the market position of Liquidity is satisfactory.
 5. Operating Ratio
Ratio | Method of Computation | Industry average |
Operating Ratio | Operating Expenses Operating Income | (2.4520+1.0819+1.2871+0.4066)/4= 1.3069 |
Comparison of Four companies:
Ratio | Rahimafrooz Batteries Ltd | Quasem Drycell Ltd | Olympic Industries Ltd. | Navana Batteries Ltd. |
Operating Ratio: | 355,830,694 145,118,837 = 2.4520 | 91,128,721 84,232,428 = 1.0819 | 39287085 30523417 = 1.2871 | 41,442,055 101,924,274 = 0.4066 |
Comment:
Rahimafrooz Batteries Limited has the highest ratio of 2.4520 where Quasem Drycell Limited has 1.0819 ,Olympic Industries Limited has 1.2871,Navana Batteries Limited has 0.4066.Where, the industry average is 1.3069. Navana Batteries Limited has the lowest ratio among the companies.So, Rahimafrooz Batteries Limited has high expenses incurred in gaining operating income.So, the company needs to minimize cost avoiding unnecessary administrative expenses from increased administrative expenses Tk 5599449,i,e,1.91% (from vertical income statement analysis).
6. Administrative Expense to Sales percentage:
Ratio | Method of Computation | Industry average |
Administrative Expense to Sales percentage | Administrative Expense Total Sales | (11.4487+5.4714+3.4691+1.7822)%/4 = 5.5429% |
Comparison of Four companies:
Ratio | Rahimafrooz Batteries Ltd | Quasem Drycell Ltd | Olympic Industries Ltd. | Navana Batteries Ltd. |
Administrative Expense to Sales percentage | 298,264,314 2,605,227,370 = 11.4487% | 51,162,699 935,094,525 = 5.4714% | 8,526,204 245,775,310 = 3.4691% | 8,887,858 498,689,132 = 1.7822% |
Comment:
From horizontal income statement analysis, Rahimafrooz Batteries Limited has the highest percentage of 11.4487% where Quasem Drycell Limited has 5.4714%,Olympic Industries Limited has 3.4691%,Navana Batteries Limited has 1.7822%.Where, the industry average is 5.5429%. Navana Batteries Limited has the lowest ratio among the companies.So, Rahimafrooz Batteries Limited needs to minimize cost avoiding unnecessary administrative expenses from increased administrative expenses Tk 5599449, i, e, 1.91% (from vertical income statement analysis) to pool up net profit.
7. Marketing and selling expenses to Sales percentage:
Ratio | Method of Computation | Industry average |
| Marketing and Selling Expenseto percentage | Marketing and Selling Expense Total Sales | (2.20965+4.27401+12.51585+6.52795)%/4 = 6.38187% |
Comparison of Four companies:
Ratio | Rahimafrooz Batteries Ltd | Quasem Drycell Ltd | Olympic Industries Ltd. | Navana Batteries Ltd. |
| Administrative Expense to Sales percentage | 57,566,380 2,605,227,370 = 2.20965% | 39,966,022 935,094,525 = 4.27401% | 30,760,881 245,775,310 = 12.51585% | 32,554,197 498,689,132 = 6.52795% |
Comment:
Rahimafrooz Batteries Limited has the lowest 2.20965% of sales where Quasem Drycell Limited has 4.27401% of sales ,Olympic Industries Limited has 12.51585% of sales ,Navana Batteries Limited has 6.52795% of sales.Where, the industry average is 6.38187% of sales. Olympic Industries Limited has the highest percentage 12.51585% of sales among the companies. So, Rahimafrooz Batteries Limited has minimizing expenses to gain operating income. So, the performance of the company is satisfactory.
THE CASH CONVERSION CYCLE MODEL
Finish goods and sell them
|
Inventory conversion period:
The days inventory held is the average number of days it takes to sell inventory to customers. This ratio measures the efficiency of the firm in managing its inventory. Generally, a low number of days inventory held is a sign of efficient management; the faster inventory sells, the fewer funds tied up in inventory. On the other hand, too low a number could indicate understocking and lost orders, a decrease in prices, a shortage of materials, or more sales than planned. A high number of days inventory held could be the result of carrying too much inventory or stocking inventory that is obsolete, slow-moving, or inferior; however, there may be legitimate reasons to stockpile inventory, The type of industry is important in assessing days inventory held.
Ratio | Method of Computation | Industry average |
Inventory conversion period | Inventory Average daily cost of sales | (81.6919+106.4410+50.8454+114.17)/4= 88.287075 |
Comparison of Four companies
Ratio | Rahimafrooz Batteries Ltd | Quasem Drycell Ltd | Olympic Industries Ltd. | Navana Batteries Ltd. |
Inventory conversion period | 470,966,115 5,765,145 = 81.6919842 | 221,552,994 2,081,461 = 106.4410823 | 24,512,371 482,095 = 50.84548164 | 111,150,844 973,487 = 114.1780311 |
Comment: Rahimafrooz company takes 82 days to convert material into finished goods and then to sell these. a sign of efficient management; the faster inventory sells, the fewer funds tied up in inventory compared to industry average 88 days. Where, , Olympic Industries Limited (51 days) is more efficient in managing inventory and Navana Batteries Limited (114 days) and Quasem Drycell Limited (106 days) have not so efficient management of inventory.
Receivable collection period:
The average collection period of accounts receivable is the average number of days required to convert receivables into cash. The ratio is calculated as the relationship between net accounts receivable (net of the allowance for doubtful accounts) and average daily sales (sales/365 days).
Ratio | Method of Computation | Industry average |
Receivable collection period | Receivable Sales per day | (20.488+9.4311+ 2.0113+42.87757)/4 = 18.70210142 days |
Comparison of Four companies:
Ratio | Rahimafrooz Batteries Ltd | Quasem Drycell Ltd | Olympic Industries Ltd. | Navana Batteries Ltd. |
Receivable collection period | 146238314 (2605227370/365) = 20.488416 days | 24161564 (935094525/365) = 9.431100 days | 1354329 (245775310/365) = 2.011308 days | 58582418 (498689132/365) = 42.877578 days |
Comment: Rahimafrooz Batteries Limited takes 20 days after sales to convert Receivables into cash compared to the industry average 18.7 days and Navana Batteries Limited (43 days),they are so kind in collecting accounts receivable.On the other hand , Quasem Drycell Limited (9 days) and Olympic Industries Limited (2 days) are restristive. The average collection period helps gauge the liquidity of accounts receivable, the ability of the firm to collect from customers. It may also provide information about a company’s credit policies. The loosening of credit could be necessary at times to boost sales, but at an increasing cost to the firm. On the other hand, if credit policies are too restrictive, as reflected in an average collection period that is shortening and less than industry competitors, the firm may be losing qualified customers.
Payment deferral period:
Ratio | Method of Computation | Industry average |
Payment deferral period | Payable Average daily cost of sales | (28.2986+2.65944+39.45599 +186.1075)/4=64.13041 |
Comparison of Four companies:
Ratio | Rahimafrooz Batteries Ltd | Quasem Drycell Ltd | Olympic Industries Ltd. | Navana Batteries Ltd. |
Payment deferral period | 163,145,791 5,765,145 = 28.29864603 | 5535542 2,081,461 = 2.659449873 | 19,021,551 482,095 = 39.45599233 | 181,173,288 973,487 = 186.1075325 |
Comment: The days payable outstanding is the average number of days it takes to pay payables in cash.This ratio offers insight into a firm’s pattern of payments to suppliers.. Rahimafrooz is taking lesser days to pay suppliers compared to industry average 28.2986 days, Olympic Industries Limited (39.4559 days) and Navana Batteries Limited (186.1075 days),Quasem Drycell Limited (2.659 days). delaying payment of payables as long as possible, but still making payment by the due date, is desirable.
Cash conversion cycle: (in days)
Company Name | Inventory conversion period: | Add : Receivable collection period: | Deduct: Payment deferral period: | Result |
| Rahimafrooz Batteries Ltd | 81.6919842 | 20.488416 days | 28.29864603 | 73.881 |
| Quasem Drycell Ltd | 106.4410823 | 9.431100 days | 2.659449873 | 113.212 |
| Olympic Industries Ltd | 50.84548164 | 2.011308 days | 39.45599233 | 13.400 |
| Navana Batteries Ltd | 114.1780311 | 42.877578 days | 186.1075325 | -29.05 |
| Average | 42.8608 | |||
Comment:
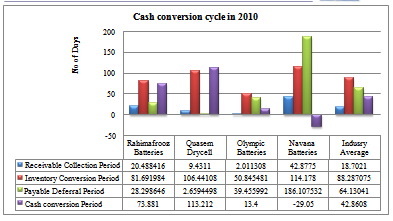
The cash conversion cycle helps the analyst understand why cash flow generation has improved or deteriorated by analyzing the key balance sheet accounts—accounts receivable, inventory, and accounts payable—that affect cash flow from operating activities. Rahimafrooz Batteries Limited has improved its cash conversion cycle is 73.881 days with comparison to industry average is 42.8608 days, Quasem Drycell Limited (113.212 days), Olympic Industries Limited (13.400days).Here,we see that Navana Batteries Limited has cash conversion cycle less than 1.
Rahimafrooz Batteries Limited has improved its cash conversion cycle is 73.881 days compared to 42.8608 days where by approximatiely improving collection of accounts receivable, efficient management of moving inventory faster, and taking leser time to pay accounts payableThat’s why a mismatching of cash inflows and outflows in the future, Rahimafrooz should be able to improve further the days inventory held and the cash conversion cycle.
Activity Ratios: Asset Liquidity, Asset Management Efficiency:
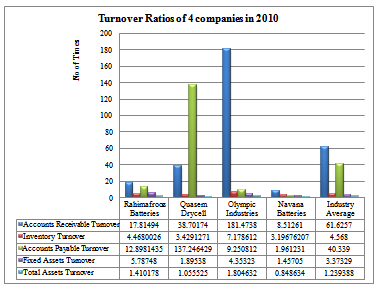
8. Accounts Receivable Turnover Ratio:
Ratio | Method of Computation | Industry average |
Accounts Receivable Turnover Ratio
| Net Sales Net Accounts Receivable | (17.81494+38.70174 +181.47386+8.51261)/4 = 61.62579 times |
Comparison of Four companies:
Ratio | Rahimafrooz Batteries Ltd | Quasem Drycell Ltd | Olympic Industries Ltd. | Navana Batteries Ltd. |
Accounts Receivable Turnover Ratio | 2605227370 146238314 = 17.81494 times | 935094525 24161564 = 38.70174 times | 245775310 1354329 = 181.47386 times | 498689132 58582418 = 8.51261 times |
9.Inventory Turnover Ratio:
Ratio | Method of Computation | Industry average |
Inventory Turnover Ratio | Cost of goods sold Inventory | (4.4680+3.4291+7.1786+3.1967)/4 = 4.568 |
Comparison of Four companies:
Ratio | Rahimafrooz Batteries Ltd | Quasem Drycell Ltd | Olympic Industries Ltd. | Navana Batteries Ltd. |
Inventory Turnover Ratio | 2,104,277,839 470,966,115 = 4.468002627 | 759,733,376 221,552,994 = 3.429127101 | 175,964,808 24,512,371 = 7.178612302 | 355,322,803 111,150,844 = 3.196762078 |
10.Accounts Payable Turnover Ratio:
Ratio | Method of Computation | Industry average |
Accounts Payable Turnover Ratio: | Cost of goods sold Accounts Payable | (12.8981+137.2464+9.25081 +1.9612)/4 =40.339 |
Comparison of Four companies:
Ratio | Rahimafrooz Batteries Ltd | Quasem Drycell Ltd | Olympic Industries Ltd. | Navana Batteries Ltd. |
Accounts Payable Turnover Ratio: | 2,104,277,839 163,145,791 = 12.89814359 | 759,733,376 5535542 = 137.2464297 | 175,964,808 19,021,551 = 9.250812828 | 355,322,803 181,173,288 =1.961231741 |
Comment: The accounts receivable, inventory, and payables turnover ratios measure how many times, on average, accounts receivable are collected in cash, inventory is sold, and payables are paid during the year. These three measures are mathematical complements to the ratios that make up the cash conversion cycle, and therefore, measure exactly what the average collection period, days inventory held, and days payable outstanding measure for a firm; they are merely an alternative way to look at the same information.
Rahimafrooz Batteries Limited converted accounts receivable into cash 17.81494 times compared to the industry average 61.62 times and compared to Quasem Drycell Limited (38.70 times), Olympic Industries Limited (181.47 times) .On the other hand,Navana Batteries Limited has the lowest 8.5126 times to be converted from accounts receivable into cash. Inventory turned over 4.468002627 times compared to 4.568 times in industry average, meaning that inventory was selling slightly slower. The lower payables turnover 12.898 times compared to 40.33 indicates that the firm is taking longer to repay payables.and Navana Batteries Limited payable turnover 1.961231741 times is so low indicating longer time needed to repay payables (payment deferral period 186.1075 days).
11. Fixed Assets Turnover Ratio:
The fixed asset turnover considers only the firm’s investment in property, plant, and equipment and is extremely important for a capital-intensive firm, such as a manufacturer with heavy investments in long-lived assets
Ratio | Method of Computation | Industry average |
Fixed Assets Turnover Ratio | Total Sales Fixed Assets | (5.78748+1.89538+4.35323+1.45705)/4 = 3.37329 |
Comparison of Four companies:
Ratio | Rahimafrooz Batteries Ltd | Quasem Drycell Ltd | Olympic Industries Ltd. | Navana Batteries Ltd. |
Fixed Assets Turnover Ratio | 2,605,227,370 450,148,876 = 5.78748 | 935,094,525 493,354,302 = 1.89538 | 245,775,310 56458194 = 4.35323 | 498,689,132 342,258,655 = 1.45705 |
12. Total Assets Turnover Ratio:
The total asset turnover measures the efficiency of managing all of a firm’s assets.
Ratio | Method of Computation | Industry average |
Total Assets Turnover Ratio | Total Sales Total Assets | (1.410178+1.055525 +1.804632+.848634)/4 = 1.239388 |
Comparison of Four companies:
Ratio | Rahimafrooz Batteries Ltd | Quasem Drycell Ltd | Olympic Industries Ltd. | Navana Batteries Ltd. |
Total Assets Turnover Ratio | 2,605,227,370 1,847,445,449 = 1.410178 | 935,094,525 885904358 = 1.055525 | 245,775,310 136,191,376 = 1.804632 | 498,689,132 587,637,508 = 0.848634 |
Comment:
The fixed asset turnover and total asset turnover ratios are two approaches to assessing management’s effectiveness in generating sales from investments in assets..
Rahimafrooz Batteries Limited has higher ratio 5.78748 times in Fixed assets turnover compared to 3.3729 and with Quasem Drycell Limited (1.89 times), Olympic Industries Limited (4.353) and Navana Batteries Limited (1.45 times) and on the other hand, total assets turnover is 1.4101 times compared to industry average 1.2393 and with the Quasem Drycell Limited (1.0555), Olympic Industries Limited (1.80463) and Navana Batteries Limited (0.848634).These ratios are higher, the smaller are the investment required to generate sales and thus the more profitable is the firm. The increase in total asset turnover is the result of improvements in inventory and accounts receivable turnover.
When Quasem Drycell Limited has asset turnover ratios low relative to the industry, either the investment in assets is increased too heavy (1500%) and sales are sluggish decreased by(-3.519%). Navaana batteries limited has low asset turnover 0.848634 times compared to industry average.There is high purchase of fixed asset Tk.214,369,352.
Leverage Ratios: Debt Financing and Coverage:
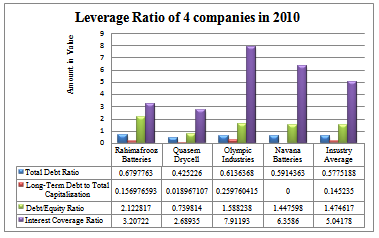
13. Total Debt Ratio:
Ratio | Method of Computation | Industry average |
Total Debt Ratio | Total Liabilities Total Assets | (.679776+.425226+.613636 +0.591436)/4= 0.5775188 |
Comparison of Four companies:
Ratio | Rahimafrooz Batteries Ltd | Quasem Drycell Ltd | Olympic Industries Ltd. | Navana Batteries Ltd. |
Total Debt Ratio | 1,255,849,606 1,847,445,449 = 0.6797763 | 376,709,576 885904358 = 0.4252260 | 83572038 136,191,376 = 0.6136368 | 347550126 587,637,508 = 0.5914363 |
14. Long-Term Debt to Total Capitalization:
Ratio | Method of Computation | Industry average |
Long-Term Debt to Total Capitalization: | Noncurrent Liabilities Noncurrent Liabilities + Stockholder’s Equity | (0.156976+0.018967 +0.25976+0.15697)/4 = 0.145235 |
Comparison of Four companies:
Ratio | Rahimafrooz Batteries Ltd | Quasem Drycell Ltd | Olympic Industries Ltd. | Navana Batteries Ltd. |
Long-Term Debt to Total Capitalization: | 110,159,100 701,754,943 = 0.156976593 | 9844677 519,039,459 = 0.018967107 | 18,464,861 71,084,199 = 0.259760415 | Nil |
15. Debt/Equity Ratio:
Ratio | Method of Computation | Industry average |
Debt/Equity Ratio | Total Liabilities Owner’s Equity | (2.12281+0.739814+1.588238+1.447598)/4 = 1.474617 |
Comparison of Four companies:
Ratio | Rahimafrooz Batteries Ltd | Quasem Drycell Ltd | Olympic Industries Ltd. | Navana Batteries Ltd. |
Debt/Equity Ratio | 1,255,849,606 591,595,843 = 2.122817 | 376,709,576 509194782 = 0.739814 | 83572038 52619338 = 1.588238 | 347550126 240087382 = 1.447598 |
Comment on the above three ratios:
Each of the three debt ratios measures the extent of the firm’s financing with debt. The amount and proportion of debt in a company’s capital structure is extremely important to the financial analyst because of the trade-off between risk and return. Use of debt involves risk because debt carries a fixed commitment in the form of interest charges and principal repayment. Failure to satisfy the fixed charges associated with debt will ultimately result in bankruptcy. A lesser risk is that a firm with too much debt has difficulty obtaining additional debt financing when needed or finds that credit is available only at extremely high rates of interest. Although debt implies risk, it also introduces the potential for increased benefits to the firm’s owners.
Debt ratio considers the proportion of all assets that are financed with debt.
The ratio of long-term debt to total capitalization reveals the extent to which long term debt is used for the firm’s permanent financing (both long-term debt and equity).
The debt-to-equity ratio measures the riskiness of the firm’s capital structure in terms of the relationship between the funds supplied by creditors (debt) and investors (equity).
Each of the three ratios has increased somewhat in Rahimafrooz Batteries Limited
Debt ratio: Rahimafrooz Batteries Limited has the higher proportion of debt 0.67977 compared to the industry average 0.5775188 compared to Quasem Drycell Limited (0.6797763) and Olympic Industries Limited (0.6136368) and Navana Batteries Limited (0.5914363), so, the company has the greater the degree of risk because creditors must be satisfied before owners in the event of bankruptcy. The equity base provides, in effect, a cushion of protection for the suppliers of debt. The ratio indicates the company’s degree of leverage .It also indicates the company’s ability to withstand losses without impairing the interests of creditors. Therefore, the percentage of debt to total assets is higher so, the risk of inability to meet its maturing obligation .So, the company should utilize its assets and financial flexibility.
Long Term Debt To Total Capitalization :for Rahimafrooz Batteres Limited. The company’s Long term debt to total capitalization has 0.1569 compared to industry average 0.145235 and with the Quasem Drycell Limited (0.0189671),Olympic Industries Limited (0.259760415).
Debt-Equity ratio: On the other hand Rahimafrooz Batteries Limited has 2.122817 compared to industry average 1.474617 and with the Quasem Drycell Limited (0.7398),Olympic Industries Limited (1.58828) and Navana Batteries Limited (1.447598)
Equity Injection –the company needs to quickly equity injection by lowering the debt-equity ratio. That means raising equity capital and utilizing the fullest resources of the company.
The debt ratios for Rahimafrooz Batteries Limited reveal a steady increase in the use of borrowed funds 299,960,412(31.380%).Total debt has risen relative to total assets(18.294%), has increased as a proportion of the firm’s permanent financing, and external or debt financing has increased relative to internal financing. Given the greater degree of risk implied by borrowing, it is important to determine why debt has increased the main cause is from Cash flow statement shows that Rahimafrooz Batteries Limited has substantially increased its investment in capital assets 100010000 Take (3.157%) when additions to property, plant, and equipment accounted for 2.324% of the total cash outflows. These investments have been financed largely by borrowing intercompany loan Tk.129781126.and long term loan Tk.98474158.
Financial leverage:
Ratio | Method of Computation | Industry average |
Financial leverage | Total Assets Stockholder’s Equity | (3.122816821+2.68935+ 7.91193+6.35860)/4 = 2.474617 |
Comparison of Four companies:
Ratio | Rahimafrooz Batteries Ltd | Quasem Drycell Ltd | Olympic Industries Ltd. | Navana Batteries Ltd. |
Financial leverage | 1,847,445,450 591,595,843 = 3.122816821 | 885,904,358 509194782 =1.73981429 | 136,191,376 52,619,338 = 2.588238 | 587,637,507 240,087,382 = 2.44759 |
Comment: Rahimafrooz Batteries Limited has high 3.1228 times stockholder’s equity to Total assets compared to the industry average 2.4746 17.Financial leverage means the company also highly dependent on equity/own financing in investing projects or purchasing fixed assets. Where other firms are below the industry average.
16. Interest Coverage Ratio
Ratio | Method of Computation | Industry average |
Interest Coverage Ratio | Earning before interest and Tax Interest Expenses | (3.20722+2.68935+ 7.91193+6.35860)/4 = 5.04178 |
Comparison of Four companies:
Ratio | Rahimafrooz Batteries Ltd | Quasem Drycell Ltd | Olympic Industries Ltd. | Navana Batteries Ltd. |
Interest Coverage Ratio | 166,395,387 51881470 = 3.20722 | 87,594,227 32,570,755 = 2.68935 | 30183198 3,814,895 = 7.91193 | 97,803,177 15,381,235 = 6.35860 |
Comment: This ratio provides an indication of the company’s ability to meet interest payments as they come due. This represents the amount available to cover interest. In order for a firm to benefit from debt financing, the fixed interest payments that accompany debt must be more than satisfied from operating earnings. The higher the times interest earned ratio the better. So, Rahimafrooz batteries Limited has 3.20722 times less than industry average 5.04178.On the other hand, Olympic has the highest 7.91193 times interest coverage ratio among four companies. So, Rahimafrooz Batteries Limited has not so sufficient interest coverage ratio it needs to accelerate as quickly as possible.
Profitability Ratios:
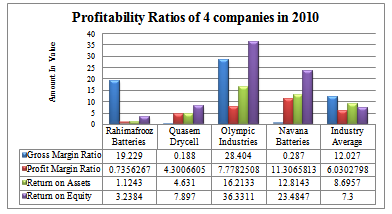
17. Gross Margin Ratio
Ratio | Method of Computation | Industry average |
Gross Margin Ratio | Gross Profit Total Sales | (19.229+0.188+28.404+0.287)%/4 = 12.027% |
Comparison of Four companies:
Ratio | Rahimafrooz Batteries Ltd | Quasem Drycell Ltd | Olympic Industries Ltd. | Navana Batteries Ltd. |
Gross Margin Ratio | 500,949,531 2,605,227,370 = 19.229% | 1,753,611 935,094,525 = 0.188% | 69,810,502 245,775,310 = 28.404% | 1,433,663 498,689,132 = 0.287% |
Comment: The gross profit margin, which shows the relationship between sales and the cost of products sold, measures the ability of a company both to control costs of inventories or manufacturing of products and to pass along price increases through sales to customers .In gross profit margin, Rahimafrooz Batteries Limited has 19.229 % improved apparently to control the growth of operating expenses compared to Quasem Drycell Limited 0.188% and industry average 12.027% and Navana Batteries Limited 0.287%. Olympic Industries Limited has earned highest percentag of gross profit percentage of 28.404%.
18. Profit Margin Ratio
Ratio | Method of Computation | Industry average |
Profit Margin Ratio | Net Profit Total Sales | (0.73562+4.3006+7.7782+11.306581)/4 = 6.0302798% |
Comparison of Four companies:
Ratio | Rahimafrooz Batteries Ltd | Quasem Drycell Ltd | Olympic Industries Ltd. | Navana Batteries Ltd. |
Profit Margin Ratio | 19,164,748 2,605,227,370 = 0.7356267% | 40,215,241 935,094,525 = 4.3006605% | 19117020 245,775,310 = 7.7782508% | 56,384,692 498,689,132 = 11.3065813% |
Comment: The gross profit margin, which shows the relationship between sales and the cost of products sold, measures the ability of a company both to control costs of inventories or manufacturing of products and to pass along price increases through sales to customers.
The net profit margin measures profitability after consideration of all revenue and expense, including interest, taxes, and nonoperating items.
There was also a huge decrease in net profit margin in Rahimafrooz Batteries Limited 0.73562% compared to the industry average 6.03027798%,Operating expenses is high in Rahimafrooz Batteries Limited.On the other hand Navana Batteries Limited has earned huge income by getting huge nonoperating income.
19. Return on Assets Ratio
Ratio | Method of Computation | Industry average |
Return on Assets Ratio | Net Profit Average Total Assets | (1.1243+4.6310+16.2133 +12.8143)%/4 = 8.6957% |
Comparison of Four companies:
Name of the companies | Calculation | Calculation | Result |
Rahimafrooz Batteries Ltd | 19,164,748 (1847445449+1561737558)/2 | 19,164,748 1,704,591,504 | = 1.1243% |
Quasem Drycell Ltd | 40,215,241 (885904358+850897245)/2 | 40,215,241 868400801.5 | = 4.6310% |
Olympic Industries Ltd. | 19117020 (136191376+99628328)/2 | 19117020 117909852 | = 16.2133% |
Navana Batteries Ltd. | 56,384,692 (587637508+292391878)/2 | 56,384,692 440,014,693 | = 12.8143% |
Comment: It measures how efficiently the company uses its assets to generate sales. Rahimafrooz Batteries Limited has 1.1243% compared to the industry average 8.6957%.Where other companies Quasem Drycell Limited (4.6310%), Olympic Industries Limited (16.2133%) and Navana Batteries Limited (12.814%).So, the company needs to accelerate net profit or selling unprofitable fixed assets.
20. Return on Equity Ratio:
Ratio | Method of Computation | Industry average |
Return on Equity Ratio | Net Profit Owner’s Equity | (3.2384+7.897+36.331 +23.484)%/4 = 7.30% |
Comparison of Four companies:
Name of the companies | Calculation | Result |
Rahimafrooz Batteries Ltd | 19,164,748 591595843 | = 3.2384% |
Quasem Drycell Ltd | 40,215,241 509198782 | = 7.8970% |
Olympic Industries Ltd. | 19117020 52619338 | = 36.3311% |
Navana Batteries Ltd. | 56,384,692 240,087,382 | = 23.4847% |
Comment: Return on equity measures the return to common shareholders; It measures profitability from the common stockholder’s viewpoint. How many taka of net income were earned for each taka invested by the owners. The rate of return on common stockholder’s equity is 3.2009% compared to 28.73% in industry average,Quasem Drycell Limited has 7.9704%,Olympic Industries Limited has 43.41911% and Navana Batteries Limited has 60.3552%.
So, the company needs increase its return through efficient strategy for cost control and quality improvement of product to push up the profit by reducing avoidable expenses.
21. Basic Earnings Power Ratio
Ratio | Method of Computation | Industry average |
Basic Earnings Power Ratio | Earning before interest and Tax[1] Total Assets | (9.0067+9.88754+22.162341 +16.643453)/4 = 14.4250316% |
Comparison of Four companies:
Ratio | Rahimafrooz Batteries Ltd | Quasem Drycell Ltd | Olympic Industries Ltd. | Navana Batteries Ltd. |
Basic Earnings Power Ratio | 166,395,387 1,847,445,449 = 9.0067822% | 87,594,227 885904358 = 9.8875489% | 30183198 136,191,376 = 22.1623416% | 97,803,177 587,637,508 = 16.6434538% |
Comment:
Rahimafrooz has not so much adequate EBIT percentage of total assets 9.0067822% compared to the industry average 14.4250316%. and other competitors is the lowest.So, the company where their interest expenses is huge with respect to the percentage of sales ,interest coverage ratio 3.20722 not equal to industry average needs to cut down operating expenses to design the financial scenario well-off.
Market Ratios:
22. Earnings per Share Ratio
Ratio | Method of Computation | Industry average |
Earnings per Share Ratio | Net Profit Average No of Share Outstanding | (17.2049+2.09454+8.23365 +3.06934)/4 = 7.65062 |
Comparison of Four companies:
Name of the companies | Calculation | Result |
Rahimafrooz Batteries Ltd | 19,164,748 (1,113,909+1,113,909)/2 | = 17.20495 |
Quasem Drycell Ltd | 40,215,241 (19200000+19200000)/2 | = 2.09454 |
Olympic Industries Ltd. | 19117020 (2321817+2321817)/2 | = 8.23365 |
Navana Batteries Ltd. | 56,384,692 (18370269+18370269)/2 | = 3.06934 |
Comment: The earnings per share ratio provides the investor with a common denominator to gauge investment returns.Rahimafrooz Batteries Limited has the highest EPS at 17.20495 compared to the industry average 7.65062 and other companies are lower than average industry EPS. So, it is a good sign of profitability.
23.Dividend Payout Ratio:
Ratio | Method of Computation | Industry average |
Dividend Payout Ratio | Dividend Paid Net Income | (1.74368+0.82485 +0.09585)/3 = 0.888126637 |
Comparison of Four companies:
Ratio | Rahimafrooz Batteries Ltd | Quasem Drycell Ltd | Olympic Industries Ltd. | Navana Batteries Ltd. |
Dividend Payout Ratio | 33,417,270 19,164,748 = 1.74368 | 33,171,341 40,215,241 = 0.82485 | 1,832,378 19,117,020 = 0.09585 | nil 56,384,692 = nil |
Comment: Rahimafrooz batteries Limited has the highest 1.74368 times from net income paid as dividend compared to the industy average 0.8881266 and Quasem Drycell Limited has0.82485 ,Olympic Industries Limited has 0.09585.So, the company’s Dividend payout ratio is highly satisfactory. the overall long-term impact to be extremely favorable to shareholders and has committed to maintaining excellent dividend payment
Relating the Ratios—The Du Pont System:
The Du Pont System helps the analyst see how the firm’s decisions and activities over the course of an accounting period—which is what financial ratios are measuring—interact to produce an overall return to the firm’s shareholders, the return on equity. By reviewing this series of relationships, the analyst can identify strengths and weaknesses as well as trace potential causes of any problems in the overall financial condition and performance of the firm.
Name of Company | Net profit margin | × | Total asset turnover | = | Return on investment |
| Rahimafrooz Batteries Limited | 0.7356267% | × | 1.410178 | = | 1.037% |
| Quasem Drycell Limited | 4.3006605% | × | 1.055525 | = | 4.539% |
| Olympic Industries Limited | 7.7782508% | × | 1.804632 | = | 14.037% |
| Navana Batteries Limited | 11.3065813% | × | 0.848634 | = | 9.595% |
Comparison of Four companies:
Name of Company | Return on investment | × | Financial leverage | = | Return on equity |
| Rahimafrooz Batteries Limited | 1.037% | × | 3.122816821 | = | 3.2384% |
| Quasem Drycell Limited | 4.539% | × | 1.73981429 | = | 7.8970% |
| Olympic Industries Limited | 14.037% | × | 2.588238 | = | 36.3311% |
| Navana Batteries Limited | 9.595% | × | 2.447598 | = | 23.4847% |
Comment:
Specifically, Rahimafrooz Batteries Limited has added debt to finance incestments and has used its debt effectively. Although debt carries risk and added cost in the form of interest expense, debt has the positive benefit of financial leverage when debt is employed successfully in 2010. Improvement in inventory management has impacted the firm favorably, showing up in the high total asset turnover ratio compared to the industy average. Rahimafrooz Batteries Limited could not control fixed costs while increasing sales during expansion has negatively impacted the net profit margin.
Return on equity of Rahimafrooz Batteries Limited is below compared to the industry average 7.30%.So, the company is not improved compared to the other firms.Because, In profit margin ratio only 0.7356267% and Total asset turnover ratio is almost better is 1.410178 times and on the other hand , the financial leverage system is very good is cpaturing 3.1228168 in the industy average 2.474617 times. The combination of increased debt (financial leverage) but not improved in profitability and asset utilization has produced an poor overall return relative to other companies.
Trend Analysis |
Short-Term Liquidity:
Rahimafrooz Batteries Limited
Ratio name | Particulars | 2010 | 2009 | 2008 | Average |
Current Ratio | Current asset | 1,190,640,768 | 944420225 | 1193918033 | |
Current Liabilities | 1,145,690,506 | 891977511 | 1040219331 | ||
Ratio = | 1.03923 | 1.05879376 | 1.147756052 | 1.081927 | |
Acid Test Ratio | Liquid Asset[2] | 393,684,725 | 277738971 | 527236779 | |
Liquid Liabilities[3] | 1,117,926,145 | 829416777 | 1007361396 | ||
Ratio = | 0.213601 | 0.33486057 | 0.523383943 | 0.4034669 | |
Cash flow liquidity | Cash +Marketable securities + CFO[4] | 244720081 | 296764529 | 106213738 | |
Current Liabilities | 1,145,690,506 | 891977511 | 1040219331 | ||
Ratio = | 0.213600514 | 0.33270405 | 0.10210706 | 0.2623224 | |
Receivable collection period | Accounts Receivable | 146238314 | 172342511 | 303519588 | |
Sales /365 | 2605227370/365 | 9194075.94 | 9003494.529 | ||
No. of Days: | 20.488416 | 18.7449519 | 33.71130921 | 24.314892 | |
Inventory conversion period | Inventory | 470,966,115 | 362108817 | 439441974 | |
Cost of Sales/365 | 5,765,145 | 6483497.09 | 6735070.529 | ||
No. of Days: | 81.6919842 | 55.850849 | 65.24682587 | 67.596553 | |
Payment deferral period | Accounts payable | 163,145,791 | 18983999 | 236201761 | |
Cost of Sales/365 | 5,765,145 | 6483497.09 | 6735070.529 | ||
No. of Days: | 28.29865 | 2.92804928 | 35.07042131 | 22.099039 | |
CCC[5] | No. of Days | 73.88175 | 71.6677516 | 63.88771 | 69.81241 |
CFO | Amount in Taka | 234,364,346 | 187,474,669 | 86,303,108 | 169,380,707.7 |
Comment: Liquidity analysis involves the prediction of the future ability of the firm to meet prospective needs for cash.This prediction is made from the historical record of the firm, and no one financial ratio or set of financial ratios or other financial data can serve as a proxy for future developments.
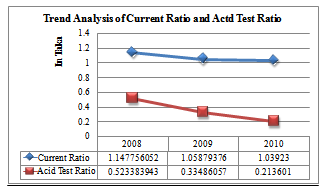
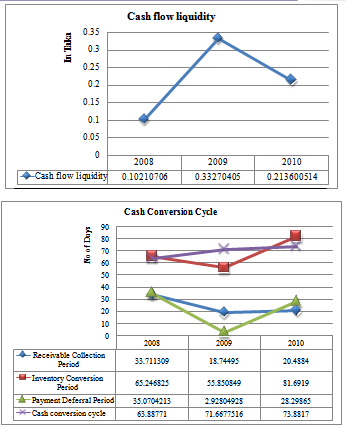
The current and quick ratios have trended downward over the three year period, indicating a deterioration of short-term liquidity. On the other hand, the cash flow liquidity ratio improved strongly in 2009 after that year a negative cash generation in 2010.
The average collection period for accounts receivable and the days inventory held ratio—after
Improvement in 2009, there was worse in 2010.These ratios measure the quality or liquidity of accounts receivable and inventory. Here, company needs to emphasize more in collecting accounts receivable with following their policy. Days payable outstanding has varied each year, but has increased in 2008 huge. In 2009, company quickly paid due money quickly had 2.928 days but in 2010, it is increased to 28.29865 days. As long as the company is not late paying bills, this should not be a significant problem. The payment deferral period increased in 2010 due to an increasing collection period 20.4884 days and longer number of days inventory 81.6919 was held. In 2010, not a significant improvement in management of current assets and liabilities has caused the cash conversion cycle to 73.8817 days . Compared to industry average 79.82, the cash conversion cycle is good.
The common-size balance sheet for Rahimafrooz Batteries Limited revealed that inventories now
comprise about one forth (25%) of the firm’s total assets.The growth in inventories has been necessary to satisfy the requirements associated with the lauching new battery Globatt Battery by Rahimafrooz Batteries Limited but has been accomplished by reducing holdings of cash and cash equivalents.This represents a tradeoff of highly liquid assets for potentially less liquid assets. The efficient management of inventories is a critical ingredient for the firm’s ongoing liquidity.
Cash flow from operations are being increased at regular interval. It is also a positive improvement for efficient liquidity position.
Operating Efficiency:
Rahimafrooz Batteries Limited
Ratio name | Particulars | 2010 | 2009 | 2008 | Average |
Accounts receivable turnover | Net Sales | 2605227370 | 2970760616 | 2971427428 | |
Net accounts receivable | 146238314 | 172342511 | 303519588 | ||
Ratio = | 17.81494 | 17.2375382 | 9.78990334 | 14.94746 | |
Inventory turnover | Cost of goods sold | 2,104,277,839 | 2366476437 | 2458300743 | |
Inventory | 470,966,115 | 362108817 | 439441974 | ||
Ratio = | 4.468002627 | 6.53526323 | 5.594141863 | 5.53246924 | |
Accounts payable turnover | Cost of goods sold | 2,104,277,839 | 2,366,476,437 | 2458300743 | |
Accounts payable | 163,145,791 | 18,983,999 | 236201761 | ||
Ratio = | 12.89814359 | 124.6563718 | 10.4076309 | 49.32072 | |
Fixed asset turnover | Net sales | 2,605,227,370 | 2970760616 | 2971427428 | |
Fixed asset | 450,148,876 | 517307333 | 509551210 | ||
No. of Days: | 5.78748 | 5.742738265 | 5.83145986 | 5.787226 | |
Total asset turnover | Net sales | 2,605,227,370 | 2970760616 | 2971427428 | |
Total asset | 1,847,445,449 | 1565253956 | 1703469243 | ||
No. of Days: | 1.410178 | 1.897941612 | 1.74433876 | 1.684153 |
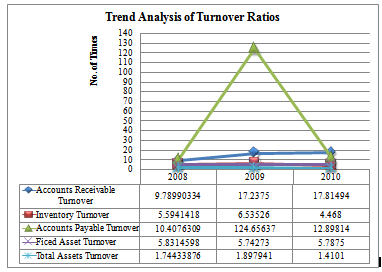
The turnover ratios measure the operating efficiency of the firm. The efficiency in managing the company’s accounts receivable, inventory, and accounts payable was analyzed in the short-term liquidity analysis. Rahimafrooz Batteries Limited ’s fixed asset turnover has decreased to 5.74273 times in 2009 compared to 2008 and is now 5.7875 times above the industry average 5.7872 by 0.0003 times. As noted earlier, Rahimafrooz Batteries Limited has increased its investment in investing projects not in fixed assets. The asset turnover ratios reveal a upward trend in the efficiency with which the firm is generating sales from investments in investing projects and total assets. The fixed asset turnover ratio declined in 2009, a result of expanding offices and retail outlets. The total asset turnover rose in 2010, progress traceable to improved management of inventories and receivables. Accounts payable turnover was fantastic in 2009, where 124.6563 times compared to 49 times, now decreased to 12.89814 times compared to industry average not so satisfactory but is subject to due time.
Capital Structure and Long-Term Solvency:
Rahimafrooz Batteries Limited
Ratio name | Particulars | 2010 | 2009 | 2008 | Average |
Debt to total assets | Total liabilities | 1,255,849,606 | 959405591 | 1153236788 | |
Total assets | 1,847,445,449 | 1565253956 | 1703469243 | ||
Ratio = | 0.6797763 | 0.612939253 | 0.67699302 | 0.6565695 | |
Long-term debt to total capitalization | Long-term debt | 110159100 | 63911683 | 113017457 | |
Long-term debt + Stockholders’ equity | 701,754,943 | 669760047 | 663249912 | ||
Ratio = | 0.156976593 | 0.095424747 | 0.170399505 | 0.1409336 | |
Debt to Equity | Total liabilities | 1255849606 | 959405591 | 1153236788 | |
Stockholders’ equity | 591595843 | 605848364 | 350232455 | ||
Ratio = | 2.1228 | 1.5836 | 3.2928 | 2.3331 | |
Times Interest Earned | Operating profit | 166,395,387 | 100172269 | 101483712 | |
Interest expense | 51881470 | 72655887 | 94631490 | ||
No. of Days: | 3.20722 | 1.3787 | 1.0724 | 1.8861 |
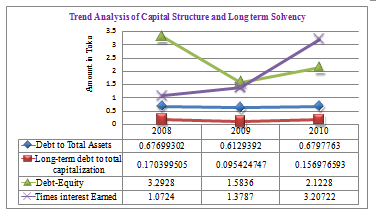
The analytical process includes an evaluation of the amount and proportion of debt in a firm’s capital structure as well as the ability to service debt. Debt implies risk because debt involves the satisfaction of fixed financial obligations. The disadvantage of debt financing is that the fixed commitments must be met in order for the firm to continue operations. The major advantage of debt financing is that, when used successfully, shareholder returns are magnified through financial leverage. Debt ratios for Rahimafrooz Batteries Limited reveal a steady increase in the use of borrowed funds. Total debt has risen relative to total assets, long-term debt has increased as a proportion of the firm’s permanent financing, and external or debt financing has increased relative to internal financing. Given the greater degree of risk implied by borrowing Tk. 98,474,158 (3.587%),investing in share money deposit that is increased by 6635806 (6.635% growth compared to 2009).Times interest earned ratio
Also tends to increase at a increasing rate.
Profitability:
Rahimafrooz Batteries Limited
Ratio name | Particulars | 2010 | 2009 | 2008 | Average |
Gross Profit | Gross profit | 500,949,531 | 640284178 | 513126685 | |
Net Sales | 2,605,227,370 | 2970760616 | 2971427428 | ||
% = | 19.229% | 21.5529% | 17.2687% | 19.3502% | |
Net Profit Margin | Net Profit | 19,164,748 | 100172269 | 101483712 | |
Net Sales | 2,605,227,370 | 2970760616 | 2971427428 | ||
%= | 0.7356267% | 3.3719% | 3.4153% | 2.5076% | |
Return On Assets | Net Profit | 19,164,748 | 100172269 | 101483712 | |
Total Assets | 1,704,591,504 | 1565253956 | 1703469243 | ||
% = | 1.1243% | 6.3997% | 5.9575% | 4.4938% | |
Return on Equity | Net Profit | 19,164,748 | 100172269 | 101483712 | |
Stockholder’s Equity | 591595843 | 605848364 | 550232455 | ||
% | 3.2384% | 16.5342% | 18.4438% | 12.7388% |
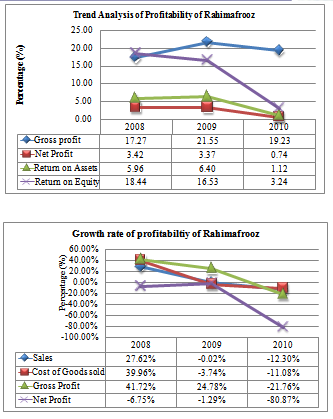
All the sales,cost of goods sold , gross profit and net profit are being decreased from 2008.In 2010, Net profit is dramatically so decreased (-80.868%) in respect to last year. That’s why the net profit margin is 0.74%.On the other hand, Gross profit is also huge decreased by -21.761% more over both sales (-12.304%) and cost of goods sold (-11.08%) decreased at a decreasing rate.
Relating the Ratios—The Du Pont System:
YEAR | NPM[1] | × | TAT[2] | = | ROI[3] | × | × FL[4] | = | ROE[5] |
2008 | 3.4153% | × | 1.74433876 | = | 5.957% | × | 3.095908334 | = | 18.442% |
2009 | 3.3719% | × | 1.897941612 | = | 6.400% | × | 2.583573793 | = | 16.535% |
2010 | 0.7356267% | × | 1.410178 | = | 1.037% | × | 3.122816821 | = | 3.238% |
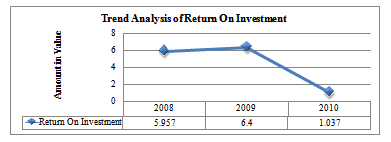
Return on equity is below earlier year levels since its high point in 2008.The Du Pont System helps provide clues as to why these changes have occurred. Both the profit margin and the asset turnover are lower in 2010 than in 2009 and 2008. The combination of increased debt (financial leverage) 3.12281 in 2010 higher than 2009 and 2008 and the deterioration in profitability and asset utilization has produced an declined overall return in 2010 relative to the two previous years is 3.238% .Specifically, the firm has added debt to finance investment projects and has used its debt effectively.
Although debt carries risk and added cost in the form of interest expense, debt has the positive benefit of financial leverage when debt is employed successfully, which is the case for Rahimafrooz Batteries Limited. The 2010 deterioration in inventory management has impacted the firm not favorably, showing up in the decreased total asset turnover ratio. The firm’s ability to control operating costs is low while decreased sales having decreased net profit margin.
The overall return on investment is now decreasing as a result of these combined factors.
SW(Strength Weakness) Analysis:
|
The analysis of any firm’s financial statements consists of a mixture of steps and pieces that interrelate and affect No one part of the analysis should be interpreted in isolation. Short-term liquidity impacts profitability; profitability begins with sales, which relate to the liquidity of assets. The efficiency of asset management influences the cost and availability of credit, which shapes the capital structure. Every aspect of a firm’s financial condition, performance, and outlook affects the share price.
The last step of financial statement analysis is to integrate the separate pieces into a whole, leading to conclusions about the business enterprise. The specific conclusions drawn will be affected by the original objectives established at the initiation of the analytical process. The major findings from the analysis of. Rahimafrooz Batteries Limited’s financial statements can be summarized by the following strengths and weaknesses.
Strengths
- Company is one of 9 SBUs of Rahimafrooz Group, well-positioned geographically to benefit from expected economic and industry growth, intercompany funds of profitable SBU is transterred to nonprofitable SBUs of the company.
- Aggressive marketing and expansion strategies determined by balance scorecard prepared by Kaplan-Norton Pladdium Group,England.
- Recent improvement in management of accounts receivable and inventory
- Effective control of operating costs
- Increased profitability in 2007 and strong, positive generation of cash flow from
- OperationsTimes Interest Earned Ratio tends to Increase from 1.3787 in 2009 to 3.20722 in 2010.
- Accounts Receivable turnover increase from 17.2375 in 2009 to 17.81494 times. in 2010
- Fixed Assets turnover tends increase from 5.74273 in 2009 to 5.7875 times in 2010
- 9. Payment deferral period also increased from 2.9280 days in 2009 to 28.29865 days.
- 10. Cash balance increases from 2009 in 2010 Tk. 1065874 (11.474%)
- 11. Rahimafrooz has not so much adequate EBIT percentage of total assets 9.0067822% compared to the industry average 14.4250316%. and other competitors is the lowest.
- The earnings per share ratio provides the investor with a common denominator to gauge investment returns.Rahimafrooz Batteries Limited has the highest EPS at 17.20495 compared to the industry average 7.65062 and other companies are lower than average industry EPS. So, it is a good sign of profitability.
Weaknesses
- Highly sensitive to economic fluctuations in 2010
- Negative cash flow from operating activities in 2010
- Historical problems with inventory management and some weakness in overall asset management efficiency
- Increased risk associated with debt financing
- The firm’s ability to control operating costs is low while decreased sales having decreased net profit margin.
- Return on Investment tends to declining from 6.4% in 2009 to 1.037% in 2010
- Return on Equity tends to declining from 16.535% in 2009 to 3.238% in 2010
- Return on Assets tends to decreasing from 6.40% in 2009 to 1.12%. in 2010
- Net Profit Margin tends decrease -1.29% in 2009 to -80.87% in 2010
- Gross profit Margin tends to decrease from 21.55% in 2009 to 19.23%. in 2010
- Debt Equity tends to increase from 1.5836 in 2009 to 2.1228 times in 2010
- Long term Debt to total capitalization tends to increase from 0.095424747 in 2009 to 0.156976593 times. in 2010
- Total Debt –Total Assets tends increase from 0.6129392 in 2009 to 0.6797763 times. in 2010
- Inventory turnover decreased from 6.53526 in 2009 to 4.468 times in 2010
- Accounts Payable turnover highly decreased from 124.65637 in 2009 to 12.89814 times in 2010.
- Receivable collection period tends increase from 18.74495 in 2009 to 20.4884 in 2010.
- Inventory conversion period tends increase from 55.850849 in 2009 to 81.6919 in 2010.
- Cash conversion cycle tends increase from 71.6677 times in 2009 to 73.8817 times in 2010.
- Current Ratio 1.03923 times in 2009 from 1.05879376 times in 2010.
- Acid test ratio also decreased 0.213601 times in 2010 from in 0.33486057 times
- Cash inflow decreases from 2009 in 2010 Tk. -411830755.
Chaper# 5 Conclusion and Recommendation |
Items to be discussed:
Page No.
Conclusion 111
Recommendation 112-113
Conclusion
|
Rahimafrooz is one of the well-known business houses in Bangladesh. It has endured turbulences of the last 53 years and has been able to transform itself from a small trading company into a leading diversified corporate body.Some years back, Rahimafrooz was running monopoly business in battery market by its flagship brand, Lucas. But now days there are many other competitors in the battery market like Navana, Volvo, Hamco etc. So there is a question of market sustainability.
After the analysis of the financial statements of Rahimafrooz Batteries Limited,Quasem Drycell Limited,Navana Batteries Limited and Olympic Industries Limited ,we have seen that all four companies are group company.Among them, Rahimafrooz Batteries Limited is capturing majority of the market share. The Liquidity position is satisfactory, Rahimafrooz Batteries Limited has improved its cash conversion cycle is 73.881 days compared to 42.8608 days where by approximatiely improving collection of accounts receivable, efficient management of moving inventory faster, and taking leser time to pay accounts payableThat’s why a mismatching of cash inflows and outflows in the future, Rahimafrooz should be able to improve further the days inventory held and the cash conversion cycle. Turnover ratios are also approximately satisfactory according to the industry average. The debt ratios for Rahimafrooz Batteries Limited reveal a steady increase in the use of borrowed funds 299,960,412(31.380%).Total debt has risen relative to total assets(18.294%), has increased as a proportion of the firm’s permanent financing, and external or debt financing has increased relative to internal financing. Huge decrease in net profit margin in Rahimafrooz Batteris Limited also focusing the pivotal issue to take into consideration for cost control. Rahimafrooz has not so much adequate EBIT percentage of total assets 9.0067822% compared to the industry average 14.4250316%. and other competitors is the lowest.Highest EPS is good sign for profitability for the company. From Du pont analysis, the company making combination of increased debt (financial leverage) but not improved in profitability and asset utilization has produced an poor overall return relative to other companies. , Rahimafrooz Batteries Limited has increased its investment in investing projects not in fixed assets. The asset turnover ratios reveal a upward trend in the efficiency with which the firm is generating sales from investments in investing projects and total assets. The 2010 deterioration in inventory management has impacted the firm not favorably, showing up in the decreased total asset turnover ratio. The firm’s ability to control operating costs is low while decreased sales having decreased net profit margin.
To convert financial statement data into formats that facilitates the evaluation of a firm’s financial condition and performance, both over time and in comparison with industry competitors,the techniques applied will help the interested parties to use this report.
Recommendation
|
After analyzing the financial statements of Rahimafrooz Batteries Limited and comparison with other three competitors and comparison with past three years, I want to recommend some of the issues that will help the company to improve better in the next year. These are as follows:
- Company needs to quickly complete feasibility test of Globatt Battery and launcing the product in the right place so that cost can be reduced, net proft can be improved, operating ratio will be better, profitability ratio will be better and ultimately it impacts on the return on equity.
- Company as early as possible start their activity of making strategy through Balance scorecard.
- To improve the cash conversion cycle, company needs to change the policy to maintain a good relationship with the customer and suppliers.
- Company needs to increase the internal funds, because a big amount of money is transferred from the company to outside party through interest, ultimately company suffers loss.So, company needs to quickly take attainable target profit and to attain this company limits loan policy so that the risk of liquidity or tremendous loss or in recession the company can easily recoup from the reserve from the profit in future. To improve times interst earned, interst expese must be decreased or profit should be extended, debt equity ratio should be below the industry average should be must availed.
- Efficiency in managing inventory, accounts receivable, accounts payable should be strengthened quickly upto the company policy standard to get favourable fixed assets,total assets , accounts receivable ,accounts payable turnover ratio.
- With a view to survey,Rahimafrooz Batteries Limited company can take the following steps to improve market share:
- Price should be considered
- Plant capacity should be increased as the market border is expanding every year.
- Distribution channel should be more smooth and quick.
- The advertisement should be more vibrant and target-oriented
- The company should arrange consumer meeting at different automobile showroom to introduce Locus with new users.
- Product should diversify so as to meet the varied categories of engine of new model of automobile.
- For becoming more aggressive, acquisition of other existing battery market should be considered with significance right now.The company should render more social responsibilities to make the brand friendly, familiar and responsible.
- From the trend analysis, we can see which factors of the ratio is being dropped/harmed/improved, a careful investigation should be taken to improve the ratio.
- From vertical and horizontal analysis, we can see which line items of the statements of cash flow, income statements; balance sheet goes down or up, a powerful scrutiny needs to be applied to rescue the information to impair the line items of the respective statements.
- Through Statement of Changes in Equity, we can easily see which items of the current assets and liabilities is different compared to the other competitors, sound project analysis, CVP analysis, master budget preparing, ABC costing ,standard costing etc. can be applied to improve the internal control over the working capital requirement.
- Quality of reporting is high but the unavailability of information in the annual report compared to Quasem Drycell Limited ,Chartered accountants( K.M.Hasan & Co) needs to clarify the trend anlaysis, chart presentation, adequate notes should be adherewith for following full discosure principle.
Bibliography |
Annual report of Aftab automobiles Limited collected from Mothjil 128/A, Riaj Tower
Annual report of Rahimafrooz Batteries Limited collected from Nakhalpara, Lucas Mor.
Annual report of Quasem Drycell Limited collected from, DSE shop.
Annual report of Olympic Industries Limited collected from, Third party, Motijil
Fraser M.L., and Alieen Ormiston (2010), “Understanding Financial Statements”8th Edition, Prentice-
Hall of India Private Limited.,Chapter-6,pp-192-220
http://www.how-to-start-a-small-business.com/analyzing-financial-statements/,browsing
date:15/04/2011 ,Browsing date:15/04/2011
http://www.google.com/#sclient=psy&hl=en&site=&source=hp&q=vertical+analysis&aq=f&aqi=g
0&aql=&oq=&psj=1&bav=on.2,or.r_gc.r_pw.&fp=1219d79d7d7a617 Browsing date:15/04/2011
http://www.google.com/#sclient=psy&hl=en&site=&source=hp&q=financial+statments+analysis&aq
=o&aqi=&aql=&oq=&pbx=1&bav=on.2,or.r_gc.r_pw.&fp=1219d79d7d7a617Browsing
date:15/04/2011
Lesikar and Pettit, Business Communication (2004-2005.) (6th edition),A.I.T.B.S. Publishers &
Distributors,
Salmi, T., and Martikarainen a, T (1981), ” A Review of the Theoretical and Empirical Basis of
Financial Ratio Analysis”, Finnish Journal of Business Economics 1, 20-45.
Weygandt Jerry.J.,Donald E.Kieso & Paul D.Kimmel,”Accounting Principles”,7th edition,Chapter-19
pp-769-772.

Some are parts:
Financial Statement Analysis of Rahimafrooz Batteries Limited (Part 1)
Financial Statement Analysis of Rahimafrooz Batteries Limited (Part 2)
Financial Statement Analysis of Rahimafrooz Batteries Limited (Part 3)