5.CASE STUDY
Effective Credit Management can ensure good recovery of loan and advance and good yield. Premier Bank is in the preparation stage of a written policy that will clearly state how to deal with documentation, supervision, follow-up and monitoring. Apart from this, the authorized credit officer has to show his level of managerial capability in efficiently managing the loans and advances.
In this section, the entire process practiced by Premier Bank, which starts from the application for credit facility by a customer and ends at the decision of sanction of credit to that applicant, will be covered. For this, an example of credit appraisal of a loan proposal from a steel manufacturer has been illustrated.
5.1APPLICATION FOR CREDIT FACILITY
In order to obtain a credit for their new project, Venus Steel Mills Ltd. applied to the Managing Director of The Premier Bank Limited in their letterhead pad on January 25, 2008. Through their application they applied for the following credit facilities:
Mode of Facility Proposed for
L/C. Facility (For both Local & Import) Tk. 35.00 Crore
LTR Facility (For both Local & Import) 1k. 16.00 Crore
Overdraft facility Tk. 2.00 Crore
The application also included filling up of a Request for Credit Limit form. This form, in effect, serves as a project feasibility report Through this standardized form, Premier Bank is able to elicit essential information about the project. The given information is analyzed in detailed by the officers of Premier Bank to measure the viability of the project.
5.2CIB REPORT
After receiving the credit request letter on January 25, 2008 from the applicant, the bank asked Bangladesh Bank on January 31, 2008 to provide them with CIB report. CIB Report in this regard dated March 03, 2008 containing position as on January 01, 2007 (Monthly) and December 12, 2006 (Quarterly) reflects that the total liabilities of the Venus Group is Tk 39,004.00 Lac (Funded Tk 34,036.00 Lac and Non Funded Tk 4,968.00). The total liabilities stand unclassified. But As per CIB Report the total Over-Due Loan of the group is Tk. 4,063.00 Lac out of which Tk 2,373.00 Lac has been shown in the name of Venus Steel Mills Ltd. Premier Bank enquired the matter with the applicant. Afterwards, Venus Steel Ltd. confirmed that the over-due loan of Tk 2,373.00 Lac had already been regularized. They also informed the bank that such over dues can occur only occasionally but they take prompt actions in such cases to ensure that dues are regularized without delay.
Venus Steel Mills Limited (VSML), one of the top three players in the industry has been operating since long back with good reputation. VSML has established Cold Rolling Mill under the same umbrella of the Mills for manufacturing CR Coil, main raw-materials of CI/GP sheet and would start operation with the capacity of 120,000 MT per annum from March 2008. It is a backward linkage industry for Venus Steel Mills Ltd., one of the largest and modern CI/GP sheet manufacturers in Bangladesh and has been working since 1987. After having discussion with PHP, T.K. & A.K. Group, top players in the industry, Premier Bank understood that annual turnover in the industry is 6.00 Lac MT and Venus is having share of 15.00%. PHP Group informed that Venus had been purchasing CR Coil from them through Local L/Cs. PHP also informed that their payment was regular along the way of business with Venus.
5.3 COLLECTION OF DOCUMENTS
As the CIB report and subsequent information provided by the applicant was positive, the bank collected required documents from the applicant. The following documents were collected:
a. Request for Credit Limit
b. Minutes of the meeting of the Board of Directors of the company regarding the proposal of availing credit from the Premier Bank Limited
c. Information Memorandum about the Project
d. Copy of Trade License and TIN Certificate
e. Copy of Memorandum and Articles of Association
f. 3 (Three) Years Balance Sheet and Profit & Loss A/C
g. Statement of Bank Outstanding with Limits
h. Statement of Raw Materials purchased for the year 2001, 2009 and 2006
i. Duty structure for HR Coil, CR Coil and CI/GP Sheet (Import Stage)
j. Bank-wise working capital limits with Outstanding as on February 15, 2008
k. Long Term Loan for CR Coil Mills and CGL Line
I. Assessment of Working Capital for CR Coil Unit
m. Performa Invoice
n. Names of sister/allied concerns and liabilities with other Banks
o. Shareholding Structure of the company
p. Net Worth Statement of the Shareholders of the company
5.4 SCRUTINIZING DOCUMENTS
The Bank inspected the project for which the loan is applied. Here project existence, its distance from the bank, monitoring cost and possibilities etc. are examined. Two Executives from the bank met Mr. Md. Motaoaqquel Billah, Managing Director of Venus Steel Mills Limited at their Head Office in Safura Tower. Many issues were discussed towards making a profitable deal.
Also they have visited the factory site of the project premises at Pagar, Tongi, Gazipur. They have seen two continuous galvanizing lines in the same shade which were operative and CR Coil producing machine in a separate shade which was ready for operation. All major machines (CGLs, CR Coil) have been supplied by Japanese manufacturer, Nippon Denro. They were quite satisfied with the overall factory condition and its operation. The following facts were revealed in the meeting and factory visit:
Venus Steel Mills Limited (VSML), established for manufacturing CR Coil which is the main raw materials of CI/GP sheet will start operation with the capacity of 120,000 MT pa from March, 2008. Venus Steel Mills Limited is one of the largest and modern CJ/GP sheet manufacturers in Bangladesh and has been operating since 1987. Mr. Md. Motaoaqquel Billah informed them that they expect import of Tk. 400 Crore this year through Venus Steel Mills Limited.
Venus group started its corrugated iron sheet manufacturing business in 1987 and now established itself as one of the largest corrugated iron/galvanized plain sheet manufacturers in Bangladesh. Venus Steel Mills Limited is currently operating a continuous galvanizing line (CGL) with a capacity of 130,000 MT pa. Venus Steel Mills Umited is the main cash cow of the group. It has made a fabulous profit of 1k. 29 Crore where annual turn over was 1k. 260 Crore in 2006. Bank’s target customer, Venus Steel Mills Limited as the backward integration project, will strengthen Venus Group’s leadership position further in the industry because of better cost efficiency, ensured quality, reduced lead time, low inventory maintenance and just in time delivery. Moreover, business is being run by a group of competent professionals those who have long experience in the related field. Considering the concept of backward integration, high demand of the product (CR Coil) and good reputation, Venus Steel Mills Umited could be one of the bank’s prospective customers.
5.5 ANALYSIS OF COLLECTED INFORMATION
All the information collected from Venus Steel Mills Ltd. were evaluated through financial spread sheet analysis consisting of a series of quantitative techniques to judge their financial soundness and worthiness. Besides, Lending Risk Analysis was also undertaken by the bank to measure the borrower’s ability to repay the loan considering various risks associated with the loan. Lending Risk analysis of Venus Steel Mills Ltd. is presented in the Appendix of this Report. The findings of these analyses are presented in the credit proposal.
5.6 MACRO ENVIRONMENT ANALYSIS
5.6.1 GLOBAL ECONOMIC SITUATION
Global output growth was moderate in 2006. The major economies employed accommodative monetary policies and fiscal stimulus to counteract the lingering after effects of the equity price bubble burst, and the uncertainties associated with the Iraq war eased off as major hostilities ended quick The September 2006 IMF WEO Projections estimate global output growth of 3.2 percent for 2006, against 3.0 percent of 2009.
The developing economies as a group (with 38.1 percent share in 2009 global output) were projected to grow by 5.0 percent in 2006, while the advanced economies as a group (with 55.7 percent share in 2009 global output) were projected to grow by 1.8 percent. World trade growth for 2006 was projected at 2.9 percent, markedly lower than previous forecasts and also lower than the projected global output growth. Consumer price inflation was low both in advanced economies and developing countries, with deflation risk a concern for some countries with very low inflation.
5.6.2REVIEW OF BANGLADESH ECONOMY
Although improving, infrastructure to support transportation, communications, and power supply is poorly developed. The country has large reserves of natural gas and limited reserves of coal and oil. While Bangladesh’s industrial base is weak, unskilled labor is inexpensive and plentiful.
Since independence in 1971, Bangladesh has received more than $30 billion in grant aid and loan commitments from foreign donors, about $15 billion of which has been disbursed. Major donors include the World Bank, the Asian Development Bank, the UN Development Program, the United States, and Japan, Saudi Arabia, and West European countries. Bangladesh has historically run a large trade deficit, financed largely through aid receipts and remittances from workers overseas. Foreign reserves dropped markedly in 1995 and 1996 but have now stabilized.
MOVES TOWARD A MARKET ECONOMY
Efforts to achieve Bangladesh’s macroeconomic goals have been problematic. The privatization of public sector industries has proceeded at a slow pace, due in part to worker unrest in affected industries. The government also has proven unable to resist demands for wage hikes in government-owned industries. Economic growth has been further slowed by a largely dysfunctional banking system which has impeded access to capital-state-owned banks, which control about three-fourths of deposits and loans, and carry classified loan burdens of about 50%. Some efforts are being made to alleviate this problem through micro credit programs such as Grameen Bank
5.7 STEEL INDUSTRY IN BANGLADESH
5.7.1 DEMAND FOR CR COIL AND CIIGP SHEET
CR Coil is the main raw material of C Sheet industry and the only major market of CR Coil are the manufacturers of CJ/GP Sheets.
The consumption of CJ/GP sheets has increased substantially over the years due to growing demand for building rural domestic houses. With the socio-economic development and increase in per capita income, households are continuously being converted into tin-roof houses, which raise the security and social standard. In addition to the income effect, increase in population growth, urbanization and industrialization influences the growth of demand trend for CI and GP sheets in the country.
Industry experts conservatively opined that the industry sub-sector is operating on average at 80°Io capacity. Based on this, the total producing of GP and CI sheets in the country stands at 0.435 MT pa. It is to be noted that a small quantity of CI sheet is currently being imported under HS Code 7210.41 and it is quite insignificant compared to local production. On the basis of information available from the industry personnel and secondary sources, production of corrugated iron sheets constitutes around 80 of the total production.
Although official statistics is not available for the demand of CI sheet in the country, on apparent consumption basis, the total annual demand for CI sheet presently stands at 0.435 million MT pa. It has been observed that there is a strong correlation between the import figures of CR Coil, the main raw material of C sheets, and GDP growth rate. In line with the GDP growth rate, the demand growth for CI sheet can be estimated at 5%. The following figure shows the projected demand of CI sheets assuming availability of 0.435 million MT in Ft 07-08 as the base year.
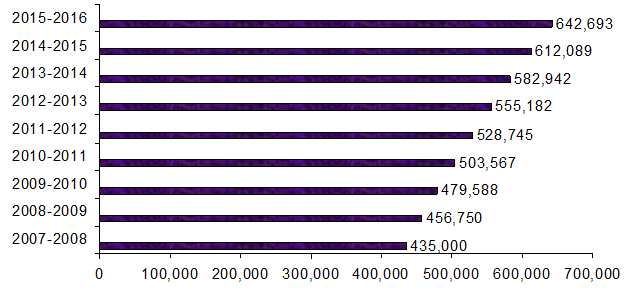
Figure 5.1: Year-wise Demand of CI sheet in the country, on apparent consumption basis.
5.7.2 SUPPLY OF CR COIL
Till 1987, Bangladesh was mainly dependent on imported CI sheets and the supply of C sheets from Chittagong Steel Mills Ltd., a state-owned enterprise. Production of CI and GP sheets in private sector started in 1987. Presently 19 producers are in operation in Bangladesh with installed capacity of 0.538 million MT pa. Of them, 11 are operating in Chittagong and the rest are located in and around Dhaka. Till September 1999, the countries demand for CR Coil was totally met through import from mainly Japan, Korea, Thailand, Taiwan and India. Though the country is presently having four CR Coil plants, import is still a main source of raw material for CI/GP Sheet producers. However, a couple of CR Coil plants are in an advanced stage of
implementation. The existing plants that are in operation and the pipeline plants that are expected to be in operation by 2009.
At present, total installed capacity of the existing CI/GP Sheet plants in the country is about 883,000 MT per annum. Taking into consideration the exist capacity and the capacity at an advanced stage of installation/planning, the total installed capacity for CI/GP sheet in the country would be about 1.0 million metric ton pa by year 2008
5.7.3 DEMAND SUPPLY GAP OF CR COIL
Particulars | Existing (MT) | Expected by end of 2008 (MT) | Expected by end of 2009 (MT) |
| Total Estimated Demand | 618,100 | 700,000 | 700,000 |
| Total estimated Supply | 271,000 | 371,400 | 563,400 |
| Total Market Gap | 347,100 | 328,600 | 136,600 |
Table: 5.3: Demand –Supply Gap
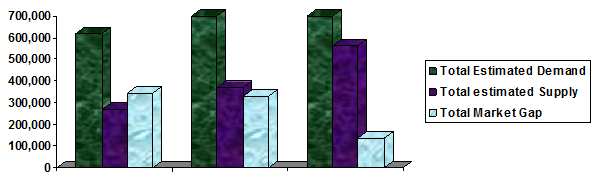
Figure 5.2: Year-wise Demand-Supply gap of CR Coil
The above table shows that presently there is a supply gap of 347,100 MT per annum which will be reduced to 136,600 MT per annum assuming all the projects under advanced stage of planning and implementation would go into commercial operation within this timeframe and demand side will be stagnant. Hence even after implementation of all the planned projects, the country will continue to import a reasonable part of its CR Coil requirement. The CR Coil to be produced by VSML will be entirely consumed by its own CI/GP Sheet-manufacturing units.
5.8 COMPANY ANALYSIS
Venus Steel Mills Limited is one of the largest Corrugated Iron/Galvanized Plain Sheet (CI/GP Sheet) manufacturers and marketers in Bangladesh. The inception of the Venus Group dates back in 1987 when a group of entrepreneurs, who were in the trading business of imported CI Sheet for many years, established Venus Steel Mills Ltd. (VSML), one of the first generation CI/GP Sheet manufacturing plants in the country. It was a Sheet-to-Sheet galvanizing line with a rated capacity of 20,000 MT per annum, which was enhanced to 40,000 MT per annum in 1993.
The success of VSML inspired the sponsors to establish a modern, cost efficient and more productive Continuous Galvanizing Line (CCL) in 1997 under the umbrella of Venus Steel Mills Ltd. (VSML) in order to make the best use of the marketing strength that they gained in course of their over 40 years of experience in the business of CI/GP Sheet. While implementing the project, the sponsors kept adequate provision for installing another line in future. The 1 CCL of VSML turned out to be an immensely successful venture for the company and in the year 2000, the sponsors decided to go for further expansion by incorporating another CCL, the implementation of which is currently under progress. The 2nd CGL has been financed by a Syndicated Lease of BDT 240.0 M that was arranged by IDLC. After the successful commercial operation of the two CGLs, VSML would have a combined capacity of prodding 130,000 MT of CI/GP Sheet per annum from March 2008 onwards.
5.8.1THE PRODUCT
INTERMEDIATE PRODUCT: COLD ROLLED COIL
The usage of CR Coil stems from two sources, namely Corrugated Iron (CI) Sheet industry and Galvanized Plain (GP) Sheet Industry. CI Sheet is used for roofing and building materials mainly by rural people whereas GP Sheet is mainly used for making body of cargo vessel, bus, refrigerator, storage vessels etc. Because of the smooth and dense surface, improved strength and controlled mechanical properties, CR Coil is used in construction, automobile, and engineering industry. It is also used as raw material for making body of cargo vessel, small ship, steel furniture, drum, oil pot, milk pot, color pot etc. and also for civil construction work.
FINISHED PRODUCT: CI/GP SHEET
Galvanized Sheets are used in two forms, namely Galvanized Plain (GP) Sheet and Corrugated Iron (CI) Sheet. GP and CI Sheets find a number of applications:
- Housing: CI Sheets are mainly used for roofing and side fencing by rural people, urban people and different industries. Although the rural people are the main users of the CI Sheets, NGOs and donor agencies often buy these products for their programs as well.
- Industrial Use: GP Sheets are used for Sheeting, ducting and container making.
- Agricultural Use: GP Sheets are used for making storage bins and silos.
- Outdoor Applications: CR Sheets are used for making vehicle body, hoarding and sign-boards.
5.8.2 THE PRODUCT MIX
The company is intending to produce the CR Coil of different thickness mainly to cater its captive requirement for the two CGLs. The following table depicts the finished product mix for the CR
Mill:
Thickness MM) | Size (Feet) | Mix |
0.18 MM | 6´3, 7´3, 8´3,9´3,10´3 | 20% |
0.20 MM | 6´3, 7´3, 8´3,9´3,10´3 | 10% |
0.22 MM | 6´3, 7´3, 8´3,9´3,10´3 | 20% |
0.25 MM | 6´3, 7´3, 8´3,9´3,10´3 | 10% |
0.28 MM | 6´3, 7´3, 8´3,9´3,10´3 | 20% |
0.34 MM | 6´3, 7´3, 8´3,9´3,10´3 | 10% |
0.45 MM | 6´3, 7´3, 8´3,9´3,10´3 | 10% |
Total | 100% |
Table 5.4: Finished Product Mix for CR Mill
5.8.3 THE PROJECT
UNIT 1: CONTINUOUS GALVANIZING LINE (THE EXISTING UNIT)
Incorporated in 1994, VSML pioneered the introduction of Continuous Galvanizing Line (CGL) in Bangladesh when it installed a state-of-the-art Japanese CGL in 1997 at Pagar, Tongi, Gazipur, about 20 KM away from Dhaka city. The plant has a capacity of producing 58,000 MT of CI/GP Sheet per annum and it has been in commercial operation since 1997.
UNIT II: CONTINUOUS GALVANIZING LINE (IN OPERATION FROM MARCH 2008)
Inspired by the success and huge profitability of the 1st CGL, VSML decided to install a 2nd CGL in order to cater the huge demand for its products. The new plant has a capacity of 72,000 MT pa and has been procured from the same Japanese manufacturer, Nippon Denro. The plant and machinery are already at site and expected to go into commercial production in March 2008. With the 2nd CGL in operation, the VSML would have the capacity of producing 130,000 MT of CI/GP Sheet per annum.
EXPANSION PROJECT: COLD ROLLED COIL UNIT (PROPOSED PROJECT)
After establishing VSML as one of the largest CI/GP Sheet manufacturing concerns, the sponsors of VSML has made a strategic move to go for downstream expansion by incorporating a Cold Rolled Coil (CR Coil) plant at the same premises under the umbrella of VSML. The proposed CR Coil plant would have a capacity of producing 120,000 MT of CR Coil per annum, which is the main raw material for the manufacturing of CJ/GP Sheet. The total cost for establishing the CR Coil plant is estimated to be BDT 1.1 billion, which would be financed by a syndicated loan and lease of BDT 750 million while the rest would be financed by equity. The plant is expected to go into commercial operation in April 2009.
5.8.4RATIONALE OF THE CR COIL PROJECT
CR Coil is the main raw material for the production of CI/GP Sheet. There are about 51 C Sheet manufacturing lines in the country which are producing around 618,100 MT of CI/GP Sheet per annum. Keeping pace with the production of CI/GP Sheet, the backward linkage industry of CR Coil is yet to be adequately developed in the country. At present, even though the country has two CR Coil plants in operation and a couple of others under implementation, import will continue to be a major source of raw material for CI/GP Sheet manufacturers. The total CR Coil manufacturing capacity in the country is expected to be around 563,400 MT per annum by the year 2009 after VSML commissions its CR Coil plant.
In order to be cost effective and to offer CI/GP Sheet to the end users at competitive price, own CR Coil source plays a critical role. With the addition of the 2nd CGL line, VSML’s own CR Coil requirement will be around 130,000 MT per annum. In view of that, VSML has decided to go for backward integration by adding a CR Coil unit with a capacity of 120,000 MT per annum. The proposed CR Coil plant of VSML will entirely feed its own CGLs for producing CI/GP Sheet. The main reasons for the backward integration are cost efficiency and synergy in the form of more control over the source of raw material. The project will also comply with the government policy that allows advantage to backward-linkage industry to have tariff benefit.
5.8.5COST EFFICIENCY
The cost of own produced CR Coil will be cheaper than that of imported quality. At the present market situation, locally produced CR Coil is around 8-10% cheaper than that of imported ones, mainly due to duty structure and cheap labor of the country.
Duty Structure: The present custom duties for CR Coil and HR Coil are 15% and 5% of the assessable value respectively. Had the custom duty of CR Coil been brought down to the level equal to NRC, i.e., at 5%, the selling price of locally produced CR Coil and imported CR Coil would be very competitive. Even then the locally produced CR Coil will have an edge over the imported one because of the following factors:
Investment in Inventory and Other Costs: Longer lead-time for CR Coil means higher investment in inventory that leads to higher working capital requirement. End result is higher financial expenses. Other than the investment in inventory, the CI/GP Sheet producers also incur extra costs for the import of CR Coil at a higher value in the form of UC charges, bank interest and transportation cost,
Quality: As the import takes a few months in transit which causes rust (also known as “scales”) on the surface of the CR Coil. As a result, CI/GP Sheet producers need to spend more time and cost to clean this rust before going into the galvanizing process, whereas the locally produced material has minimal scales which ultimately save Ume and cost of the manufacturers.
5.8.6SYNERGY
For a CIIGP Sheet manufacturer, the backward integration in the form of a cold rolling mill would provide more control over the source of the primary raw material – the CR Coil along with the cost efficiency achieved. The availability of CR Coil in the international market is relatively lower than HR Coil as most of the international CR Coil producers have their own steel finishing fadlities such as galvanizing, tin coating and skin passing. On the other hand, HR Coil is freely available in the international market. HR Coil suitable for galvanizing and color coating can be procured from neighboring Asian countries such as South Korea, Taiwan, Japan, India and China, all of which have excess capacity of HR Coil production. Thus a cold rolling mill would help a CIIGP Sheet manufacturer to achieve synergy in the form of more control over the raw material sources and prices, thus helping VSML to maintain its strong leadership.
5.9 MANAGEMENT ANALYSIS
5.9.1 MANAGEMENT/SPONSORS
MR. MOHAMMAD YOUNUS
Chairman
Mr. Mohammad Younus startled his business career in 1960 in trading. He is the founder Chairman of the City Bank Ltd., a scheduled Commercial Bank in the private sector. He is the main sponsor of Phoenix group of Industries that includes Phoenix Leasing Company Ltd. and Phoenix Insurance Company Ltd. Mr. Mohammad Vounus was awarded the F’loulana Akram Khan Gold Medal in 1991 for his outstanding contribution towards the industrialization in the country. He was a member of the Executive Committee of Dhaka chamber of Commerce and Industry, Consultative Committee for the Ministry of Energy and Mineral Resources and Committee of the Ministry of Industries for formation of Draft Industrial Policy in 1997.
MR. MD. MOTAOAQQUEL BILLAH
Managing Director
Mr. Md. Motaoaqquel Billah started his career in 1980 as a partner of Billah Brothers. He is also involved in Billah Steel and Re-rolling Industries Limited and is a founder director of Bank Asia Ltd., a commercial bank in the private sector. Mr. Billah has been involved in all key decision making of VSML since its inception. He has thorough knowledge about the various aspects of the steel industry, both CI/GP Sheet and CR Coil, including marketing and technical aspects.
MR. MD. ANISUR RAHMAN
Director
Mr. Md. Anisur Rahman started his business career in 1960 in trading by importing and marketing CI Sheets and GP Sheets from USA, Japan and Australia and gradually established himself as a major importer in the country. With extensive experience in CI and GP Sheet market, Mr. Rahman played a significant role in establishing Venus Steel Mills Ltd. in 1987 for the manufacturing of CI Sheets and established the brand “Venus” as a popular brand name in the country within a short span of time.
MR. MD. MOAZZEM BILLAH
Director
Mr. Billah started his career in 1975 as a partner of Billah Brothers, a trading house of CI/GP Sheet. He is the main sponsor of Billah Steel & Re-rolling Industries Ltd. He joined VSML in 1987 and is the proprietor of Venus Trade International, a trading concern.
MR. A Ashraf (59)
General Manager
Mr. Ashraf looks after finance, commercial and administrative affairs of the company and is also involved in all key decision making of the company. He has participated in a number of professional training programs on sales, marketing, finance, planning and exports in UK, Hong Kong, India and Pakistan. He has worked for Rhone Poulenc. Mr. Ashraf, who has been with Venus for the last 10 years, is a key contributor for the development of VSML and presently monitors and develops business activities and plans for the company.
ZAHIRUL HOQUE KHAN (57)
Deputy General Manager Mr. Zahir is in charge of the factory operations including planning, designing, erection of civil and mechanical installation and commercial production.He has advised and assisted the Naval Chief in formulating technical and strategic policies for the Navy. Mr. Zahir joined VSML in 1995.
MR. HAMID UDDIN (51)
Chief Accountant
Mr. Hamid is responsible for overall supervision of accounts, taxation, fund management, cost management, and auditing. He has worked as Accounts Manager of Monno Group and Ventura Group and as chief Accountant of Gazi Automobiles. He has been working at Venus Group since 1991.
5.9.2 EXPERIENCE OF THE SPONSORS
The Sponsors of VSML have experience in marketing and selling of CI/GP Sheet for over four decades. For two generations, they have been able to build up a very strong wholesale chain throughout the country. At present, there are 120 wholesaler of VSML, spread all over the country. Sales are controlled and organized by the sales office at Naya Bazar as well as by the head office at Safura Tower in Dhaka. There are 38 head count in the sales department of the company. The wholesalers collect delivery orders from the de order from Sales office or from Head office and take delivery of sheets from the factory at Pagar, Tongi, Gazipur. The retailers collect their goods from their respective wholesalers and sell it to the end users. The sales office of VSML is manned with qualified sales personnel who regularly conduct surveys and market research in order to facilitate smooth sates and protect imitation by unscrupulous trader. On the basis of their surveys, the sales office provides necessary recommendations to Corporate Head Office regarding sales trend and forecasts. The direct delivery from the factory to Wholesaler/Institutions avoids any undue advantage that might be taken by middlemen. It thus ensure fair price, which goes to the benefit of end users.
5.10INFRASTRUCTURE ANALYSIS
5.10.1 LAND
The factory of VSML is located at Pagar, Tongi, Gazipur and 20 KM away from the Dhaka City covering an area of 12.39 acres. The sponsors purchased the and in 1994 and completed developmental work in 1995-97. The factory premise is two and half feet above the highest flood level of 1988. 2 CGL line is located in the same premises and under the same factory building. Necessary provisions for incorporating the second line were done during the implementation of the 1 CGL. VSML has acquired additional 0.87 acres of land adjacent to the present factory. Additional warehouses for CR coil storage have been constructed besides the CGL factory building. This enables smooth workflow between CR and CGL5. The new land will also cater to the HR Coil storage yard.
5.10.2 BUILDING AND CIVIL CONSTRUCTION
CONTINUOUS GALVANIZING LINES
The existing factory building is constructed on RCC column, grade beam, brick wall of 12 feet height having a total area of 98,000 square feet including the 21(1 line. The roof of the factory shed is prepared of asbestos sheet with support of MS angle. The height of the main shed is 40 feet and has a foundation of 80 feet to accommodate heavy machinery of CGL. The factory shed has been designed and constructed to accommodate the 2 line and as such no major dvii construction was required for the 2” line. The factory is designed to withstand a wind velo City of 280 km/hr. and earthquake of 7.0 on the Richter scale
COLD ROLL MILL
CR mill factory building has been constructed on RCC column, grade beam brick wall of 262 feet height with a total area of 111,527 square feet. The factory roof is prepared of Asbestos Sheet with support of MS angle. The building will house the complete cold reversing mill including the pickling line, rewinding line and the roll grinder. Just like the CGL factory building the CR mill building is designed to withstand wind velocity of 280 km/hr and earthquake of 7.0 on the Richter scale
CONTINUOUS GALVANIZING LINE WAREHOUSES
There are three warehouses for raw materials, all in the factory: warehouse for zinc has a floor area of 1,452 sif, warehouse of ammonia has a floor area of 1,452 sIt and warehouse of CR coil has a floor area of 6,435 sft with a stacking-height of 27 feet. For the new line, the existing warehouse has been expanded by an area of 13,185 sft to make provision for CR coil, zinc and ammonia which are within the total floor space of 98,000 sft.
5.10.3 UTILITIES
POWER
The maximum load for the first CGL plant is 200 KW and electricity has been supplied by DESA through a substation of 1,000 KVA. Besides, two diesel generators of 500 KVA each arid another diesel generator of 90 KVA is acting as stand-by source of power for the existing project. The maximum load for 2 CCL line is 310 KW. The load for the 2 plant is higher due to its higher installed capacity than that of Vt line and also due to the fact that the 2 line is accompanied by an Automatic Feeding Machine to the shearing Line, Rotary Shearing Machinery and Auto Pillar. The power will be 10.00 MW. The power will be supplied by 33 KVA national grids through a substation of step-down 11 KVA transformer. The company has installed 1,100 KVA Waukesha Gas Generator from USA in 2009 to keep both the CGLs running in case of power failure.
GAS
Presently the factory has gas connection of 5,512 CFT/15 lb psi. The maximum consumption of natural gas for the existing project is 336,000 CuM/Month which is available.
WATER
The company has its own deep tube well for meeting the water requirement of the project. The average consumption for the project is 0.45 Cusec. The existing arrangement is sufficient to meet the demand.
AIR
The project has an air compressor with a capacity of 4 CuM/Min to controlling the pneumatic valves of the plant.
STEAM
The project has a boiler with a capacity of delivering 2,000 Kg/Hr of steam at a pressure of 5-7 Kg/Sq cm. A new Cleaver Brooks Boiler of 3.25 MT has been set to feed the two CGLs and another boiler with a capacity of 6.5 MT has been provisioned for the CR Mill project.
5.11 Financial Analysis
5.11.1 Project Cost And Means of Finance
Project Cost & Means of Finance | BDT Million |
| Project Cost | 2008 |
| Land Purchase | 7.81 |
| Land Development | 6.94 |
| Electricity Installation | 3.81 |
| Telephone Installation | 1.11 |
| Factory Building | 67.04 |
| Office Building | 3.98 |
| Office Furniture | 0.19 |
| Plant & Machinery | 444.80 |
| Vehicle & Transport | 1.45 |
| Air Conditioner | 0.67 |
| Water Installation | 0.92 |
| Tools & Equipment | 0.10 |
| Office Equipment | 3.25 |
| Boiler Machine | 1.24 |
| Gas Installation | 0.66 |
| Lathe Machine | 0.21 |
| Scale | 0.77 |
| Typewriter | 0.04 |
| Bonded Warehouse | 0.46 |
| Computers | 0.27 |
| Generator Installation | 6.31 |
| Transformer Installation | 0.99 |
| Forklift | 8.77 |
| Trademark | 0.01 |
| Preliminary & Pre- Operating Expenses | 9.68 |
| Others | 0.02 |
| Fixed Cost of the Project | 612.50 |
| Net Working Capital | 1,091.28 |
| Total Project Cost | 1,703.78 |
Table: 5.5: Project Cost
Means of Finance | BDT Million |
| Equity: |
|
| Sponsor’s Capital | 118.58 |
| Retained Earnings of the Existing Line | 659.82 |
| Total Equity | 778.40 |
| Long Term Liabilities: | |
| Syndicated lease Finance | 240.00 |
| Total Long Term Liabilities | 240.00 |
| Short Term loan | 465.49 |
| Directors loan | 219.89 |
| Total Liabilities | 925.38 |
| Total Equity and other Liabilities | 1,703.78 |
Table: 5.6: Means of Finance
5.11.2 Historical Performance
Balance Sheet | 2008 | 2009 | 2010 |
| Assets | |||
| Fixed Assets | 350.26 | 356.56 | 369.86 |
| Current Assets | 499.42 | 750.79 | 746.58 |
| Current Liabilities | 435.53 | 605.99 | 394.79 |
| Net Current Assets | 63.89 | 144.80 | 351.79 |
| Deferred Expenses | 13.27 | 18.22 | 9.68 |
| Other Assets | 2.91 | 0.02 | 0.02 |
| Total Assets | 430.33 | 519.60 | 731.35 |
| Liabilities | |||
| Equity: | |||
| Paid Up Capital | 10.00 | 50.00 | 50.00 |
| Reserve for Depreciation | 7.22 | 41.16 | 69.77 |
| Retained Earnings | 27.42 | 152.07 | 391.69 |
| Total Equity | 44.64 | 243.23 | 511.46 |
| Debt: | |||
| Loan from Sister Concerns | 142.41 | 33.08 | |
| Loan from Directors | 243.28 | 243.28 | 219.89 |
| Total Debt | 385.69 | 276.35 | 219.89 |
| Total Equity & Debt | 430.33 | 519.58 | 731.35 |
Income Statement | 2008 | 2009 | 2010 |
| Sales | 371.98 | 1,727.93 | 1,648.63 |
| COGS | 304.45 | 1,339.74 | 1,249.26 |
| Gross Profit | 67.53 | 388.19 | 399.37 |
| Administrative Expenses | 4.97 | 41.51 | 59.01 |
| Selling & Distribution Expenses | 44.13 | 238.31 | 108.99 |
| Operating Profit | 18.43 | 108.37 | 231.37 |
| Add: Other Income | 8.98 | 16.28 | 8.25 |
| Net: Profit | 27.41 | 124.65 | 239.62 |
Financial Ratios | 2008 | 2009 | 2010 |
| Gross Margin | 18.15% | 22.47% | 24.22% |
| Operating Margin | 4.95% | 6.27% | 14.033% |
| Net Margin | 7.37% | 7.21% | 14.53% |
| Return on Equity | 61.40% | 51.25% | 46.85% |
| Return on Paid up Capital | 274.10% | 249.30% | 479.24% |
| Return on Assets | 6.37% | 23.99% | 32.76% |
Table: 5.8: Historical Performance of the Company
Financial Analysis and Comments on Above Financials
GP margin is high and static. NP margin trend is positive and static even after taking high debt burden, which indicates efficiency of the Company towards managing the business. Return on Assets and Return on Equity have negative trend, because of increases in fixed assets over the last three years and because of injection of additional capital by the sponsors.
5.12 FINANCIAL PROJECTIONS
512.1 ASSUMPTIONS TO FINANCIAL PROJECTIONS
- The expansion project is assumed to operate at a capacity of 45%, 65%, 75%, 80% and 85% in the 1 2 3 4 and 5 years of operation.
- The existing plant is assumed to operate at the same capacity as it is currently operating.
- The weighted average selling price of C sheets is estimated at BOT 46,934/MT. A price discount of 3.5% has been assumed on sales price.
- VSML has to pay VAT @ BDT 1,200/MT.
- The expansion project will have a tax holiday period for 5 years.
- Depreciation has been charged on the portion of machinery financed by the sponsors.
5.12.2 INCOME PROJECTION OF THE EXPANSION PROJECT
The company will be able to generate a net income of BUT 364.64 M in Year 1 at a capacity utilization of 45%. It has been mentioned that the new line will be similar to the existing CGL line that VSML is operating at a capacity above 90%. Hence the estimated capacity utilization for the expansion line is very Conservative because of assured market. Net income for the subsequent years is BDT 451.60 M, 595.26 ft 591.54 ft 631.88 M and 671.03 M. The exchange rate of USD has been kept constant as any raise in USD will be immediately offset by a proportionate increase in selling price.
5.12.3 Projected Balance Sheet
Projected Blanch Sheet | 2005 | 2006 | 2007 | 2008 | 2009 | 2010 | 2011 |
| Assets | |||||||
| Fixed Assets | 369.86 | 432.56 | 432.56 | 432.56 | 432.56 | 432.56 | 432.56 |
| Less: Accumulated Depreciation | 75.49 | 109.82 | 149.25 | 190.39 | 231.52 | 272.66 | 313.79 |
| Net: Fixed Assets | 294.37 | 322.74 | 283.31 | 242.17 | 201.04 | 159.90 | 118.77 |
| Current Assets | |||||||
| Inventories | 432.95 | 432.95 | 858.61 | 1,065.37 | 1,169.14 | 1,225.77 | 1,283.50 |
| Accounts Receivables | 143.38 | 143.38 | 208.71 | 255.39 | 277.25 | 289.08 | 299.86 |
| Advance, Deposit, Prepayments | 48.80 | 54.68 | 54.68 | 54.68 | 54.68 | 54.68 | 54.68 |
| Cash & Bank Balance | 18.25 | 369.55 | 562.42 | 1,029.42 | 1,581.70 | 2,220.47 | 2,898.39 |
| Other Current Assets | 137.32 | 137.71 | 137.71 | 137.71 | 137.71 | 137.71 | 137.71 |
| Total Current Assets | 780.70 | 1,138.27 | 1,822.13 | 2,542.57 | 3,220.48 | 3,927.71 | 4,674.41 |
| Other Assets |
|
|
|
|
|
|
|
| Pre-Operating Expenses | 9.68 | 6.97 | 4365 | 2.32 | – | – | – |
| Other Assets | 0.02 | 0.02 | 0.02 | 0.02 | 0.02 | 0.02 | 0.02 |
| Total other Assets | 9.70 | 6.99 | 4.67 | 2.34 | 0.02 | 0.02 | 0.02 |
| Total Assets | 1,084.77 | 1,468.00 | 2,110.11 | 2,787.08 | 3,421.54 | 4,087.63 | 4,792.93 |
| Current Liabilities |
|
|
|
|
|
|
|
| Short Term Loan | 214.99 | 214.99 | 455.49 | 587.20 | 650.20 | 684.25 | 718.50 |
| Accounts Payable | 0.05 | 0.05 | 0.05 | 0.05 | 0.05 | 0.50 | 0.50 |
| Other Current Liabilities | 179.74 | 179.74 | 179.74 | 179.74 | 179.56 | 179.74 | 179.74 |
| Total Current Liabilities | 394.78 | 394.78 | 365.28 | 766.99 | 829.81 | 864.04 | 898.29 |
|
|
|
|
|
|
| |
| Net Assets | 689.99 | 1,073.22 | 1,474.83 | 2,020.09 | 2,591.73 | 3,223.59 | 3,894.64 |
| Represented By: | |||||||
| Equity: | |||||||
| Paid- Up Capital | 50.00 | 118.58 | 118.58 | 118.58 | 118.58 | 118.58 | 118.58 |
| Tax Holiday | 24.31 | 170.17 | 350.81 | 588.91 | 825.53 | 1,078.27 | 1,346.69 |
| Retained Earnings | 445.79 | 664.58 | 935.55 | 1,292.71 | 1,647.62 | 2,026.74 | 2,429.37 |
| Total Equity | 520.10 | 953.33 | 1,404.94 | 2,000.00 | 2,591.73 | 3,223.59 | 3,894.64 |
|
|
|
|
|
|
| |
| Debt: |
|
|
|
|
|
|
|
| Debt from Directors | 169.89 | 119.89 | 69.89 | 19.89 | – | – | – |
| Total Loan | 169.89 | 119.89 | 69.89 | 19.89 | – | – | – |
|
|
|
|
|
|
| |
| Total Equity & Debt | 689.99 | 1,073.22 | 1,474.83 | 2,020.09 | 2,591.73 | 3,223.59 | 3,894.64 |
Table 4.9: Projected Balance Sheet
5.12.4 Projected Income Statement
Projected Income Statement |
| 2005 | 2006 | 2007 | 2008 | 2009 | 2010 | 2011 |
| Capacity Utilization | 91% | 41% | 66% | 77% | 82% | 85% | 88% | |
| Gross production | MT | 8,766 | 52,597 | 76,897 | 99,397 | 106,597 | 110,197 | 113,797 |
| Add: Beginning WIP | MT | 458 | 458 | 458 | 1,808 | 2,408 | 2,708 | 2,858 |
| Less: Closing WIP | MT | 458 | 458 | 1,808 | 2,408 | 2,708 | 2,858 | 3,008 |
| Goods Manufactured | MT | 8,766 | 52,597 | 75,547 | 98,797 | 106,297 | 110.047 | 113,647 |
| Add: Beginning Finished Goods | MT | 3,092 | 3,092 | 3,092 | 6.242 | 7,642 | 8,342 | 8,692 |
| Goods Available for Sales | MT | 11,858 | 55,689 | 78,639 | 105,039 | 113,939 | 118.389 | 122,339 |
| Less: Closing Finished Goods | MT | 3,092 | 3,092 | 6,242 | 7,642 | 8,342 | 8,692 | 9,042 |
| Goods Sold | MT | 8,766 | 52,597 | 72,397 | 97,397 | 105,597 | 109,697 | 113,297 |
| Sales Revenue | 397,03 | 2,382.21 | 3,287.94 | 4,475.86 | 4,903.26 | 5,145.53 | 5,368.35 | |
| Less: VAT | 10.52 | 63.12 | 86.88 | 116.88 | 126.72 | 131.64 | 135.96 | |
| Net Sales Revenue | 386.51 | 2,319.09 | 3,201.06 | 4,358.98 | 4,776.54 | 5,013.89 | 5,232.39 | |
| Cost of Goods Sold: | ||||||||
| Raw Materials | 296.13 | 1,776.78 | 2,452.33 | 3,338.35 | 3,657.13 | 3,837.82 | 4,004.02 | |
| Salary & Wages | 1.42 | 8.50 | 10.26 | 11.24 | 11.80 | 12.39 | 13.01 | |
| Electricity Expenses | 0.59 | 3.55 | 8.67 | 10.83 | 11.37 | 11.64 | 12.54 | |
| Gas Expenses | 0.65 | 3.92 | 7.59 | 9.18 | 9.64 | 10.12 | 10.63 | |
| Maintenance | 2.70 | 16.18 | 21.31 | 23.89 | 25.08 | 26.34 | 27.65 | |
| Other Factory Overhead | 0.13 | 0.76 | 0.94 | 1.04 | 1.09 | 1.14 | 1.20 | |
| Depreciation | 5.72 | 34.33 | 39.43 | 41.13 | 41.13 | 41.13 | 41.13 | |
| Cost of Good Sold | 307.34 | 1,844.02 | 2,540.543 | 3,435.66 | 3,757.24 | 3,940.88 | 4,110.18 | |
| Gross Profit | 79.17 | 475.07 | 660.53 | 923.32 | 1,019.30 | 1,073.01 | 1,122.21 | |
| Advertising Expenses | 4.07 | 24.39 | 28.49 | 29.85 | 29.85 | 29.85 | 29.85 | |
| Selling & Distribution Expenses | 5.02 | 30.13 | 32.99 | 36.97 | 38.55 | 39.55 | 40.49 | |
| Operating Profit | 70.08 | 420.55 | 599.05 | 856.50 | 950.90 | 1,003.61 | 1,051.87 | |
| Interest Expenses | 5.73 | 34.40 | 64.46 | 74.48 | 93.95 | 104.00 | 109.48 | |
| Lease Rental | – | – | 59.90 | 75.87 | 75.87 | 75.87 | 75.87 | |
| Amortization of Per-operating Expenses | 0.39 | 2.32 | 2.32 | 2.32 | 2.32 | – | – | |
| Non-operating Expenses | 6.12 | 36.72 | 123.68 | 152.67 | 172.14 | 179.87 | 185.35 | |
| Income Before WPPF | 63.96 | 383.83 | 475.37 | 703.83 | 778.76 | 823.74 | 866.52 | |
| Contribution to WPPF | 3.20 | 19.19 | 23.77 | 35.19 | 38.94 | 41.19 | 43.33 | |
| Income Before Tax | 60.76 | 364.64 | 451.60 | 668.64 | 730.82 | 782.55 | 823.19 | |
| Income Tax | – | – | – | 73.38 | 148.28 | 150.67 | 152.16 | |
| Net Income after Tax | 60.76 | 364.64 | 451.60 | 595.26 | 591.54 | 631.88 | 671.03 | |
| Appropriations: | ||||||||
| Dividend payable | – | – | – | – | – | – | – | |
| Tax Holiday Reserve | 24.31 | 145.85 | 180.63 | 238.10 | 236.63 | 252.76 | 268.40 | |
| Retained Earnings | 36.45 | 218.79 | 270.97 | 357.16 | 354.91 | 379.12 | 402.63 | |
| Cumulative Retained Earnings | 445.79 | 664.58 | 935.55 | 1,297.71 | 1,647.62 | 2,026.74 | 2,429.37 | |
| Margins: | ||||||||
| Gross Margin | 20.5% | 20.5% | 20.6% | 21.2% | 21.3% | 21.4% | 21.4% | |
| Operating Margin | 18.1% | 18.1% | 18.7% | 19.6% | 19.9% | 20.0% | 20.1% | |
| Net Margin | 15.7% | 15.7% | 14.1% | 13.7% | 12.4% | 12.6% | 12.8% | |
| Return on Equity | 11.7% | 38.2% | 32.1% | 29.8% | 22.8% | 19.6% | 17.2% | |
| Return on Paid up Capital | 121.5% | 307.5% | 380.8% | 502.0% | 498.9% | 532.9% | 565.9% | |
| Return on Assets | 5.6% | 24.8% | 21.4% | 21.4% | 17.3% | 15.5% | 14.0% |
Table: 5.10: Projected Income Statement
5.12.5 Projected Cash Flow Statement
Projected Cash Flow Statement | 2005 | 2006 | 2007 | 2008 | 2009 | 2010 | 2011 |
| Cash Flow from Operating Activities |
|
|
|
|
|
|
|
| Net Profit Before Tax | 60.76 | 364.64 | 451.60 | ||||
| Add. Depreciation | 5.72 | 34.33 | 39.43 | ||||
| Add. Amortization of Pro-operating Exp. | 0.39 | 2.32 | 2.32 | ||||
| Decreases/ (Increase) IN Inventory | – | – | – | – | – | – | – |
| Decreases/ (Increase) In Accounts Receivables | – | – | (235.66) | (196.76) | (205.25) | (180.40) | (194.33) |
| Decrease/ (Increase) In Advance, Deposit | – | – | (180.46) | (233.50) | (233.50) | (266.50) | (289.50) |
| Increase/(Decrease) in Accounts Payable | – | (5.88) | – | – | – | – | |
| Cash Flow from Operating Activities | 66.87 | 395.41 | 149.23 | 208.45 | 196.24 | 226.11 | 228.33 |
| Cash Flow from Investing Activities | |||||||
| Fixed Assets Addition | – | – | – | – | – | – | |
| Pro-operating Expenses | – | (62.70) | – | – | – | – | |
| Cash Flow form Investing Activities | – | (62.70) | – | – | – | – |
|
| Cash Flow from Financing Activities | |||||||
| Sponsors Equity Investment | – | – | – | – | – | – | – |
| Long Term Loan | – | 68.58 | – | – | – | – | – |
| Dividend Paid | – | – | – | – | – | – | – |
| Directors Loan | (50.00) | (50.00) | (50.00) | (50.00) | (50.00) | – | – |
| Short Term Loan | – | ||||||
| Cash Flow from Financing Activities | (50.00) |
|
|
|
|
|
|
| Net Cash Flow | 16.87 | ||||||
| Beginning Cash Balance | 1.37 | ||||||
| Cumulative Cash Balance | 18.24 |
Table 5.11: Projected Cash Flow Statement
5.12.6 Debt-Service Coverage Ratio
Projected Cash Flow Statement | 2005 | 2006 | 2007 | 2008 | 2009 | 2010 | 2011 |
| Interest Expenses: | |||||||
| Interest on Directors Loan | 0 | 0 | 0 | 0 | 0 | 0 | 0 |
| Interest on Short Term Loan | 5.73 | 34.4 | 64.46 | 74.48 | 93.95 | 104 | 109.48 |
| Total Interest Payment | 5.73 | 34.4 | 64.46 | 74.48 | 93.95 | 104 | 109.48 |
| Lease Rental: | |||||||
| Syndicated Lease Rental | 0 | 0 | 56.9 | 75.87 | 75.87 | 75.87 | 75.87 |
| Total Lease Rental | 0 | 0 | 56.9 | 75.87 | 75.87 | 75.87 | 75.87 |
| Total Debt/ Lease Obligation | 5.73 | 34.4 | 121.36 | 150.35 | 169.82 | 179.87 | 185.35 |
| Earnings Before Interest & Taxes | 70.09 | 420.56 | 599.06 | 856.5 | 950.89 | 1003.6 | 1051.87 |
| Depreciation | 5.72 | 34.33 | 39.43 | 41.13 | 41.13 | 41.13 | 41.13 |
| Amortization | 0.39 | 2.32 | 2.32 | 2.32 | 2.32 | 0 | 0 |
| Earnings Available Doe Debt Service | 76.2 | 457.21 | 640.81 | 899.95 | 994.34 | 1044.73 | 1093 |
| Interest Coverage | 13.3 | 13.3 | 9.9 | 12.1 | 10.6 | 10. | 10.0 |
| Debt/ Service Coverage Ratio | 13.3 | 13.3 | 5.3 | 6.0 | 5.9 | 5.8 | 5.9 |
Table: 5.12: Projected Debt / Service Coverage Ratio
5.12.7 Break Even Analysis
Break Even Analysis
Expansion Project
Based on year-2006 of Operation
Particulars | Variable | Fixed Cost | Variable Cost | Total Cost |
| Raw Materials | 100% | – | 296,130,000.00 | 296,130,000.00 |
| Salary & Wages | 0% | 1,420,000.00 | – | 1,420,000.00 |
| Electricity Expenses | 50% | 295,000.00 | 295,000.00 | 590,000.00 |
| Gas Expenses | 90% | 65,000.00 | 585,000.00 | 650,000.00 |
| Maintenance | 75% | 675,000.00 | 2,025,000.00 | 2,700,000.00 |
| Other Factory Overheads | 0% | 130,000.00 | – | 130,000.00 |
| Deprecation | 0% | 5,720,000.00 | – | 5,720,000.00 |
| Administrative Expenses | 0% | 4,070,000.00 | S- | 4,070,000.00 |
| Selling & Distribution Expenses | 50% | 2,510,000.00 | 2,510,000.00 | 5,020,000.00 |
| Interest Expenses | 0% | 5,730,000.00 | – | 5,730,000.00 |
| Lease Rental | 0% | – | – | – |
| Amortization of Pre-Operating Expenses | 0% | 390,000.00 | – | 390,000.00 |
| Total | 0% | 21,005,000.00 | 310,545,000.00 | 322,550,000.00 |
Table: 5.13: Break Even Analysis
Net Sales at Utilized Capacity Taka 385,510,000.00
Variable Cost Taka 301,545,000.00
Contribution Margin Taka 84,965,000.00
Break Even Sales Taka 95,552,787.00
Break Even Units MT 2,167.13
5.12.8 Internal Rate of Return
Expansion Project | Dec-09 | Dec-10 | Dec-11 | Dec-12 | Dec-13 | Dec-14 |
| Capital Outlay | -68.58 | |||||
| Earning Before Tax | 0 | 88.53 | 301.73 | 369.11 | 405.86 | 442.79 |
| Add: Depreciation | 0 | 5.1 | 6.81 | 6.81 | 6.81 | 6.81 |
| Add: Amortization | 0 | 0 | 0 | -62.82 | 0 | 0 |
| Increases in Net Working Capital | -5.88 | -250.5 | -121.72 | 0 | -34.23 | -34.25 |
| Tax | 0 | 0 | 0 | 313.1 | 0 | 0 |
| Operating Cash Flow | -74.46 | -156.87 | 186.82 | 378.44 | 415.35 | |
| IRR | 83% |
Table 5.14: Calculation of Internal Rate of Return
Assumptions:
Lease Financing has not been included in the capital outlay
NWC increases has been assumed as the increase in Inventory, Accounts Receivables and Advances
NWC has been realized at the end of the project.
5.12.9 Financial Ratios
Financial Ratios | 2005 | 2006 | 2007 | 2008 | 2009 | 2010 | 2011 |
| Operating Profitability Ratios: |
|
|
|
|
|
|
|
| Gross Margin | 20.5% | 20.5% | 20.6% | 21.2% | 21.3% | 21.4% | 21.4% |
| Operating Margin | 18.1% | 18.1% | 18.7% | 19.6% | 19.9% | 20.0% | 20.1% |
| Net Margin | 15.7% | 15.7% | 14.1% | 13.7% | 12.4% | 12.6% | 12.8% |
| Return on Equity | 12.4% | 49.6% | 38.3% | 35.0% | 25.8% | 21.7% | 18.9% |
| Return on Paid up Capital | 121.5% | 432.6% | 380.8% | 502.0% | 498.8% | 632.8% | 565.9% |
| Return on Assets | 5.6% | 28.6% | 25.2% | 24.3% | 19.1% | 16.8% | 15.1% |
| Operating Efficiency Ratios: | |||||||
| Total Asset Turnover | 0.56 | 2.63 | 2.51 | 2.49 | 2.07 | 1.72 | 1.47 |
| Inventory turnover | 0.71 | 4.26 | 3.90 | 3.55 | 3..36 | 3.29 | 3.28 |
| Equity Turnover | 0.79 | 3.15 | 2.71 | 2.56 | 2.08 | 1.72 | 1.47 |
| Internal Liquidity Ratios: | |||||||
| Current Ratios | 2.0 | 2.9 | 2.8 | 3.3 | 3.9 | 4.5 | 5.2 |
| Quick Ratios | 0.9 | 1.8 | 1.5 | 1.9 | 2.5 | 3.1 | 3.8 |
| Receivable Turnover | 2.7 | 16.2 | 18.2 | 18.8 | 17.9 | 17.7 | 17.8 |
| Cash Flow Ratios: | |||||||
| Interest Coverage | 13.3 | 13.3 | 9.9 | 12.1 | 10.6 | 10.0 | 10.0 |
| Debt/Service Coverage Ratio | 13.0 | 13.3 | 5.3 | 6.0 | 5.9 | 5.8 | 5.9 |
Table: 5.15: Financial Ratios for the Projected Figures
5.13 STRENGTHS AND WEAKNESSES
5.13.1 STRENGTHS
- VSML is a good name in the industry.
- Sponsors and management are well experienced since long back.
- VSML is the only player in the industry who has continuous galvanized lines. VSML has its own backward linkage CR coil producing mill.
- Financially strong with positive trend of growth.
5.13.2 WEAKNESSES
- Imported HR Coil is the main raw material of the CR Coil industry, any increase in price of FIR Coil will make the import costlier.
- The main raw material, HR Coil, will be imported, and there is a risk of non availability of raw material.
- Devaluation of BDT may erode profit margin.
- Substitute products like Asbestos Sheet, Fiber Sheet, Plastic Corrugated Sheet and Tile
- Roofing are now creating threat to CI/GP sheet Industry.
5.14 JUSTIFICATION FOR THE PROPOSED FACILITY
Venus Steel Mills Limited (VSML), one of the top three players in the industry has been operating since long back with good reputation. VSML has already been sanctioned a syndicated loan of Tk. 175 crore (Lease- 15 crore, Term Loan- 60 crore and Working Capital- 100.00 crore) by 7 banks and 4 NBFIs. Price of HR coil was USD 220 per MT and CR coil was USD 320 per MT in the international market, when the estimation was done for working capital requirement. But after one and half years down the line, price of HR and CR Coil in the international market have been jumped up to USD 570 per MT and USD 490 per MT for CR and HR coil respectively. That is why VSML requires additional working capital.
5.15 LEGAL ASPECT
The collateral provided by the applicant are properly submitted and are regular and up-to-date.
5.16 CREDIT PROPOSAL
Based on the analysis of collected information, the Corporate Marketing Division prepared a credit proposal in the Bank’s format for the perusal of Head Office Management Committee. A format of the Credit Proposal is furnished in the Appendix. The Credit Proposal was submitted to the Head Office Management Committee in the form of a memo.
5.17 HEAD OFFICE MANAGEMENT COMMITTE
The memo was discussed in the meeting of Head Office Management Committee (MANCOM). MANCOM discussed the memo and submitted it to the Board/Executive Committee for approval from the Board of Directors. The Board after detailed discussion in its meeting approved the credit line and advised the Credit Division to send an approval letter in the form of a Sanction Advice to Banani Branch for disposal of the credit.
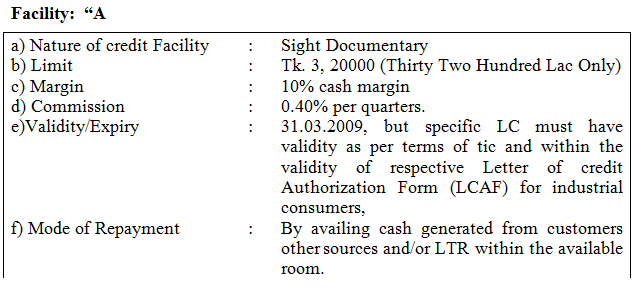
5.18 SANCTION ADVICE
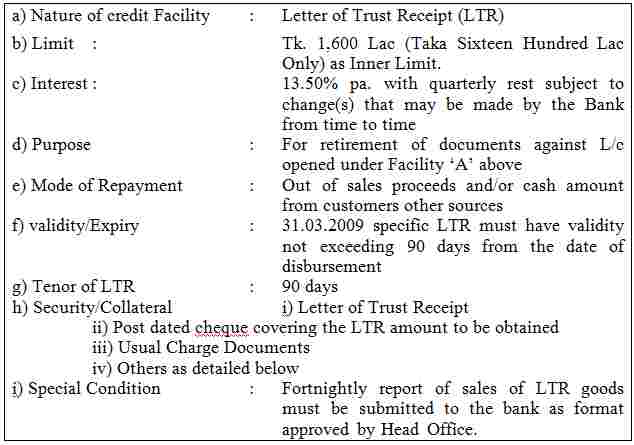
As per the approval of the Board/Executive Committee, Head Office Credit Division issued a Sanction Advice in favor of Venus Steel Mill Limited to Banani Branch as per the following terms and conditions:
Facility: “A
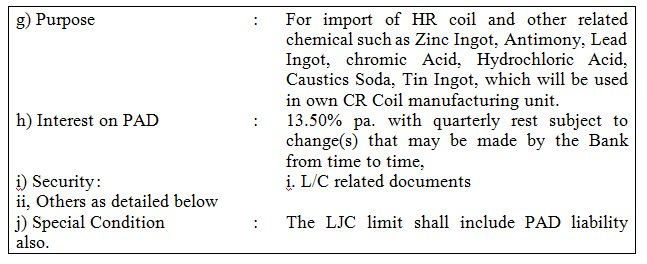
Facility: “B
Facility: “C
Nature of Credit Facility : Overdraft
Amount : 150.00lac (One Hundred Fifty Lac Only) Purpose For payment of utilities like Gas, Water & Electricity. Payment by means of Payment Order in favour of Govt. Authorities.
Rate of interest : 13.50% p.a. at quarterly rest subject to change(s) that may be made by the Bank from time to time.
Mode of adjustment : Daily sales proceeds have to be deposited in the OD account and the entire liability along with interest should be adjusted h within validity.
Validity/Expiry : 31.03.2009
Security i. Post dated Cheques covering the OD limit to be obtained
ii. Others as detailed below
5.18.1 SECURITIES AGAINST ALL THE FACILITIES
- 1st ranking Charge with other lenders, i.e., Standard Chartered Bank, BRAC Bank Ltd., IFIC Bank Ltd., State Bank of India, Uttara Bank Ltd., Prime Bank Ltd., Eastern Bank Ltd., IDLC of Bangladesh Ltd IPDC of Bangladesh Ltd., Uttara Finance and Investment Ltd. and Bangladesh Industrial Finance Company Ltd. on the Fixed and Floating Assets (both existing and future) of the company valuing Tk. 38,418.66 Lac With RJSC (3 Months’ Deferral is required from the date of first draw down/opening of L/C to complete the agreement as they have eleven lenders presently. Venus Steel Mills Limited has to provide Premier Bank with an undertaking in this regard which would be supported by board resolution of the company). NOC from existing lenders for the pari-passu charges must be obtained before extending the facility.
- U. Personal Guarantee of all the Directors of the company and their spouses.
5.18.2 PRE-DISBURSEMENT COMPLIANCE
- A declaration to be obtained from the customer to the effect that no Director/Sponsor of The Premier Bank Ltd. or any of their family members/dependents has got any direct or indirect interest in their Business.
- An undertaking to be obtained from the customer to the effect that they have no classified liabilities with any Bank in their name or in the name of their sister/allied concern(s).
5.18.3 OTHER CONDITIONS
- L/Cs will be subject to compliance of all Exchange Control Regulations of Bangladesh Sank and Import Control Orders issued by CCI&E, GOB.
- L/Cs will be opened with the Branch’s entire satisfaction observing documentation and other necessary formalities to protect Bank’s interest.
- All necessary formalities shall be observed regarding documentation and exchange control requirements including Import Policy Order of the Government.
- Sanction of the limits is subject to further review, changes, in case there is any new regulation from Bangladesh Bank. Bank itself may also review the limit from time to time.
- Balance Confirmation Certificate/Letter must be obtained from the customers regularly as on 30 June and 31 December of each calendar year.
- Any material or adverse change in business condition will cause the amount due to the Bank immediately repayable.
- Board Resolution to borrow in conformity with the Memo and Articles of Association of the company will be submitted. Personal Guarantees of all the directors of the company will be obtained in the Bank’s prescribed form.
- The borrower shall explicitly undertake that all information supplied by him to the Bank in connection with the approved credit lines are correct.
- The Bank reserves the right to cancel or call back the sanctioned loan or alter, amend the terms and conditions of this sanction letter wholly or partly at its discretion without assigning reason whatsoever.
5.18.4 CHARGE DOCUMENTS TO BE OBTAINED
The following charge documents should be obtained from the customer:
- D.P. Note
- U. Letter of Agreement Hi. Letter of Continuity
- Letter of Revival
- Personal Guarantees of the Directors of the company & their spouses
- Letter of Trust Receipt and any other documents as considered necessary.
The terms and conditions of the facility must be communicated to the customer in a separate sanction advice and such terms and conditions must be accepted duly signed by the customer in the duplicate copy of the same.
5.19 DISBURSEMENT OF CREDIT
After getting the sanction advice from the Head Office, Banani Branch disbursed the loan through a loan account in the name of the borrower after obtaining all the charge documents.
More parts of this post-
Credit Management Of Premier Bank (Part-1)
Credit Management Of Premier Bank (Part-2)