The analysis can be used to analyze the determinants of a firm’s reported earnings’ thereby replying to identify the potential strengths and weaknesses of the firm’s performance. The entire job helps us to have practical exposure with theoretical knowledge. In this paper’ the performance of Qasem Drycells Limited is thoroughly evaluated based on the information given in the annual reports of the firm.
EXECUTIVE SUMMARY
The object of financial analysis is an evaluation of the firm’s performance. Financial analysis can be used to analyze the determinants of a firm’s reported earnings’ thereby replying to identify the potential strengths and weaknesses of the firm’s performance. The entire job helps us to have practical exposure with theoretical knowledge.
In this paper’ the performance of ‘QASEM DRYCELLS LIMITED’ is thoroughly evaluated based on the information given in the annual reports of the firm.
As given in the first part of the report’ it has the ‘Corporate Review’ including the mission statement’ management apparatus’ the general information about the firm.
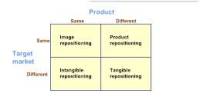
In the second part of the paper is presented the ‘Ratio Analysis’ that uses the financial statement in a unique manner to provide a different perspective about the firm.
The third part contains the summary of the financial report along with some recommendations.
A consolidated balance sheet and profit loss account of the three years’ 2000, 2001, 2002. is provided in the conclusive part.
Limitations of Financial Statement analysis
Financial analysis, particularly ratio analysis, is widely used by the firm’s managers, its creditors, and potential investors in it’s stock .it is an important technique, and anyone wishing to have a complete understanding of managerial finance must be familiar with it .
Nevertheless, financial analysis has limitations and potential problems, including the following:
- Based as it is on accrual accounting data and historical costs, the current period’s figures may not be closely related to cash flows.
- Because of alternative accounting treatments, comparisons among firms may be difficult. Furthermore, one firm’s accounting procedures may change over time, making trend analysis less reliable.
- Many large corporations have multiple divisions operating in multiple industries, making difficult the compilation of the industry averages that will be used for a benchmark.
- Inflationary periods can significantly distort a firm’s recorded values relative to the actual market values. Both inventory costs and depreciation charges are well known in this regard, and both affect the calculation of profits. Inflation can distort the comparison of ratios for several firms, or one firm’s ratios over time.
- Financial analysis may be distorted by what is termed window dressing whereby a firm attempts to make the financial statements look better for at least a short period of time. An example of window dressing would be borrowing long-term to improve the liquidity ratios at the end repaying the loan shortly thereafter.
SUMMARY OF THE ANALYSIS
(Findings)
We may summarize the ratios & attempts to draw some rough conclusion. All the information needed for a conclusive judgment about the company is not available in the financial statements. Such conclusions may require information that only management has.
Here, as evidence by current & quick ratio, the firm’s liquidity seems to be relatively low. This may be because the company is purposefully aggressive in its working capital management. However, creditors & even the stockholders may not like a relatively low liquidity position.
The firm’s collection period is quite longer indicating a very loose credit policy. The firm is unable to show efficiency in managing its assets.
Quasem Drycells Ltd. is extremely dependent on debt finance that has resulted in decreasing profit & even loss recently. Finally, the company fails to prove any outstanding performance in all spheres of activities.
Recommendations
- The company should increase their current asset.
- The company should try to manage its stock with efficiency.
- The receivable policy should be revised.
- Company’s management should make attempts to increase its fixed asset turnover as well as total asset turnover.
- The firm should lessen aggressive use of debt.
- The firm should emphasize on its performance from the four groups of financial ratios.
QUASEM DRYCELLS LTD.
Balance Sheet for 2003, 2002, 2001
| Particulars | 2003 | 2002 | 2001 |
| Assets | |||
| Non-current assets | 2,376,453,323 | 2,446,497,969 | 2,625,531,100 |
| Property plant & equipment-carrying value | 2359978194 | 2451265131 | 2610225674 |
| Long term security deposits | 16475129 | 15232838 | 15305426 |
| Current assets | 3,207,736,844 | 3,429,909,798 | 2,957,175,284 |
| Inventories | 119491404 | 1463658446 | 1449089396 |
| Trade receivables | 2034774542 | 1897476400 | 1505335016 |
| Advances, deposits & Prepayments | 51763872 | 50330420 | 19335370 |
| Cash & cash equivalents | 1707026 | 18444532 | 1415502 |
| Total Assets | 5,584,190,167 | 5,896,407,767 | 5,600,706,384 |
| Equity & Liabilities | |||
| Shareholders equity | 1,422,946,056 | 1,704,883,039 | 1,524,133,144 |
| Issued share capital | 880000000 | 880000000 | 880000000 |
| Tax holiday reserve | 364001557 | 364001557 | 309776588 |
| Accumulated profit | 198944499 | 460881482 | 334356556 |
| Non-current liabilities | 839,367,534 | 1,127,350,106 | 1,483,377,636 |
| 14% Debentures-net of :current maturity (Secured) | 107933495 | 162188243 | 136896000 |
| Long term borrowings-net of: current maturity (Secured) | 731434039 | 965161863 | 1346481636 |
| Current liabilities & Provision: | 3,301,876,577 | 3,064,174,622 | 2,593,195,604 |
| Short term borrowings (Secured) | 1374184276 | 1249133432 | 1205849841 |
| 14% Debenture-current maturity (Secured) | 106959411 | 58298903 | 94530599 |
| Long term borrowings- Current maturity (Secured) | 929972326 | 571076303 | 357724697 |
| Trade creditors | 625065647 | 1017510899 | 617051852 |
| Other payables | 265694917 | 168155085 | 230038615 |
| Total Liabilities & Shareholders Equity | 5,584,190,167 | 5,896,407,767 | 5,600,706,384 |
QUASEM DRYCELLS LTD.
Profit & Loss Account of 2003, 2002, 2001
Particulars | 2003 | 2002 | 2001 |
| Revenue | 2,892,292,131 | 2,991,581,342 | 2,703,693,437 |
Cost of revenue | ( 2,465,339,414) | (2,233,028,315) | 1,939,770,057 |
| Gross profit | 426,952,717 | 758,553,027 | 763,923,380 |
| Administrative expenses and distribution | ( 96,066,008) | ( 87,412,653) | 87,952,209 |
Profit from operations | 330,886,709 | 671,140,374 | 675,971,171 |
| Finance cost | ( 548,823,692) | (481,352,985) | 410,414,235 |
| Contribution to workers participation / welfare fund | |||
| Net profit / (loss) for the year | |||
| Tax holiday reserve | |||
| Surplus / (deficit) for the year | |||
Surplus brought forward | |||
Appropriation of dividend declared for 2001 | |||
Available surplus carried forward | |||
Basic earnings per share (par value Taka 100/-) | |||
Number of shares used to compute EPS | |||
MISSION STATEMENT
Mission
Each of our activities must benefit and add value of the common wealth of our society. We firmly believe that, in the final analysis we are accountable to each of the constituents with whom we interact; namely: our employees, our customers, our business associates, our fellow citizens and our shareholders.
Different types of Ratios
Financial analysis typically is associated with ratio analysis, defined as the analysis of relationship among various financial statement items both at a point in time and over time .It uses the financial statements in a unique manner to provide a different perspective about the firm.
To carry out a ratio analysis, the financial statements are used to compute a set of ratios. Each ratio emphasizes a particular aspect of the balance sheet and or income statement.
Traditionally, four groups of financial ratios have been used to assets a firm’s performance:
- Liquidity Ratio
- Activity Ratio
- Leverage Ratio
- Profitability Ratio
Liquidity Ratio:
Liquidity ratio measures the extent to which the firm can service its immediate obligations, in effect assessing the firm’s ability to meet short run financial contingencies. The two commonly used liquidity ratios are:
- Current Ratio.
- Quick Ratio.
Activity Ratio:
Activity ratios are supposedly indicates how well the firm manages its assets by relating important asset accounts to operating results. These ratios are called turnover ratios because they show rapidly assets are being converted into sales. Activity ratios involve accounts receivables, inventory, fixed assets & total assets. Activity ratio includes-
1. Inventory Turnover
2. Average collection period
3. Fixed assets turnover
4. Total assets turnover
Leverage Ratio:
Leverage ratios indicate to what extent the firm has financed its investments by borrowing. These ratios focus on the firm’s financial structure.
Leverage ratio includes-
- Debt equity ratio.
- Debt ratio.
- Time interest earned.
Profitability Ratio:
Profitability ratios measure the profits of the firm relative to sales, assets, or equity. It’s important to emphasize that profitability ratios describe the firm’s past profitability, especially because it is tempting to over emphasize these ratios when making an evaluation.
Profitability ratio includes-
- Profit margin.
- Return on assets (ROA).
- Return on equity (ROE).
EQUATIONS TO CALCULATE RATIOS
(USED IN THIS PROJECT)
1. Current ratio:
Current Ratio = Current assets/Current Liabilities
2. Quick Ratio:
Quick Ratio = Current assets – Inventories./Current liabilities
3. Inventory Turnover:
Inventory turnover = Sales/Inventory
Profit Margin
Profit margin = Net income After Tax
Sales
Return on assets ( ROA)
ROA= Net Income
Total Assets
Return on Equity (ROE)
ROE = Net income after tax
Common equity
QUASEM DRYCELLS
A PERFORMANCE EVALUATION
Current ratio:
This ratio indicates the ratio of current assets to current liabilities.
Current Ratio = Current assets
Current Liabilities
Current Ratio of different years:
Years (1) | Current assets (2) | Current Liabilities (3) | Current ratio (2 / 3) |
2001 | 242,742,437 | 187,517,027 | |
2002 | 282,231,937 | 210,797,148 | |
2003 | 268,837,528 | 237,180,970 |
Quick Ratio:
It indicates the current assets less inventories divided by current liabilities.
Quick Ratio = Current assets – Inventories.
Current liabilities
Quick Ratio of different years:
Years (1) | Current assets (2) | Inventories (3) | Current liabilities (4) | Quick ratio (2-3 / 4) |
2001 | 242,742,437 | 117,448,644 | 187,517,027 |
|
2002 | 282,231,937 | 140,686,956 | 210,797,148 |
|
2003 | 268,837,528 | 160,680,880 | 237,180,970 |
|
Inventory Turnover:
It means the ratio of sales to inventories.
Inventory turnover = Sales
Inventory
Inventory turnover of different years:
Years (1) | Sales (2) | Inventory (3) | Inventory turnover ratio (2 / 3) |
2001 | 788,118,240 | 117,448,644 | |
2002 | 804,764,587 | 140,686,956 | |
2003 | 695,186,498
| 160,680,880 |
Average Collection Period:
It indicates the average time period between sales & receipts of payment for those sales.
Average collection period = Receivables
Sales per day
Here, Sales per day = Sales
365
Average collection period of different years:
| Years (1) | Receivables (2) | Sales (3) | Sales per day = Sales / 365 (4) | Average Collection Period Ratio (2 / 4) |
| 2001 | ||||
| 2002 | ||||
| 2003 |
Fixed Asset Turnover
It indicates the ratio of sales to net fixed assets.
Fixed assets turnover = Sales
Fixed assets
Fixed asset turnover of different year
Year (1) | Sales (2) | Fixed asset (3) | Fixed asset turnover ratio = (2 / 3) |
2001 |
|
|
|
2002 |
|
|
|
2003 |
|
|
|
Total Asset Turnover:
It indicates the ratio of total asset.
Total asset turnover = Sales
Total assets
Total assets turnover of different tears:
| Years (1) | Sales (2) | Total assets (3) | Total asset turnover = (2 / 3) |
| 2001 | |||
| 2002 | |||
| 2003 |
Debt Equity Ratio:
It is the ratio of total debt to stockholders equity.
Debt equity ratio = Debt/Equity
Debt equity of different years:
Years (1) | Debt (2) | Equity (3) | Debt equity ratio (2 / 3) |
2001 |
| ||
2002 |
| ||
2003 |
|
Debt Ratio:
It is the ratio total debt to total assets.
Debt ratio = Total debt /Total assets
Debt ratio of different years:
Years (1) | Debt (2) | Equity (3) | Debt equity ratio (2 / 3) |
2001 |
| ||
2002 |
| ||
2003 |
|
Times Interest Earned:
It indicates the ratio of earnings before interest & taxes to interest changes.
Time interest earned = Net operating Income /Interest expenses
Time Interest Earned For Different Years
Years (1) | Net operating income (2) | Interest Expenses (3) | Time Interest Earned Ratio (2 / 3) |
2001 |
| ||
2002 |
| ||
2003 |
|
Profit Margin
It’s the Ratio of Net Profit after Taxes to Sales
Profit margin = Net income After Tax/Sales
Profit Margin for different years
Years (1) | Net income after tax (2) | Sales (3) | Profit margin ratio (2 / 3) |
2001 |
| ||
2002 |
| ||
2003 |
|
Return on assets ( ROA)
It’s the ratio of net income to total assets
ROA= Net Income /Total Assets
ROA for Different years
Years (1) | Net income (2) | Total assets (3) | Return on assets ratio (2 / 3) |
2001 |
| ||
2002 |
| ||
2003 |
|
Return on Equity ( ROE)
It indicates the rate of return earned on the Book value of the owners equity
ROE = Net income after tax
Common equity
ROE for different Years:
Years (1) | Net income after tax (2) | Common equity (3) | Return on equity ratio (2 / 3) |
2001 |
| ||
2002 |
| ||
2003 |
|
QUASEM DRYCELLS LTD
BALANCE SHEET FOR THREE YEARS:
Sl no | Subject matter | Year 2003 | Year 2002 | Year 2001 |
1 | Sources of Fund | |||
| I. Shareholders’ Fund | |||
| a) Share Capital | 192000000 | 192000000 | 192000000 |
| b) Share Premium Account | 198000000 | 198000000 | 198000000 |
| c) Reserves & Surplus | 68837379 | 65777576 | 63710164 |
| d) Revaluation Surplus | 73069546 | 76049528 | 79174629 |
| 531906925 | 531827104 | 532884793 | |
| ||||
2 | Application of Fund | |||
| I. Fixed Assets | |||
| a) Gross Block | 768567380 | 690162538 | 670249632 |
| b) Less: Depreciation | 279438130 | 241353112 | 204533333 |
| c) Net Block | 489129250 | 448809426 | 465716299 |
| ||||
| 2.Investment | 1145425 | 732205 | 120186 |
| 3. Current Assets, Loans & Advances | |||
| a) Inventories | 160,680,880 | 140,686,956 | 117,448,644 |
| b) Sundry Debtors-Unsecured | 17862084 | 25528125 | 36138200 |
| c) Advance, Deposits & Prepayments | 59909857 | 76624204 | 56609046 |
| d) Advance Income Tax | 21277441 | 32901123 | 28220702 |
| e) Cash & Bank Balances | 9107297 | 6491529 | 4325846 |
|
268837528 |
282231937 |
242742437 |
BALANCE SHEET OF THREE YEARS
(contd):
| Sl No | Subject matter | Year 2003 | Year 2002 | Year 2001 |
| 4.Less:Current Liabilities & Provisions | ||||
| a) Bank loan, Cash Credit & Overdrafts-Secured | 195548190 | 149545335 | 119428004 | |
| b) For Goods Supplied- Unsecured | 3692836 | 7228902 | 12144977 | |
| c) For Expenses-Unsecured | 9078130 | 9132070 | 13955316 | |
| d) For Other Finance – Unsecured | 13925585 | 18155521 | 18580594 | |
e) Liabilities & Provision For Income Tax | 14936229 | 26735320 | 23408136 | |
237180970 | 210797148 | 187517027 | ||
| 5.Net Current Assets (3- 4) | 31656559 | 71434789 | 55225410 | |
| 6.Miscellaneous |
|
|
| |
a)Expenditure to the extent not written off or adjusted | 9975691 | 10850684 | 11822898 | |
531906925 |
531827104 |
5328847 |
Particulars | Year 2003 | Year 2002 | Year 2001 |
| Turnover / Sales Less: Vat | 695,186,498 90,793,178
| 804,764,587 105,059,447 | 788,118,240 102,863,452 |
| Net Turnover/Sales Less: Cost of Goods Sold | 604,393,320 485,665,663 | 699705141 579810132 | 685254788 566171075 |
| Gross Profit
Less: Operating Expenses: Administrative Expenses Selling & Dist.Expenses Financial Expenses
| 118,727,658
42,167,424 32,510,719 19,747,421
94,425,564 | 119895009
42166747 31899134 19884148
93,950,129 | 119083713
38731472 29648323 17184795
85564590 |
| Operating Profit Add: Non operating Income | 24,302,093
7,02,052 | 25944880
716342 | 33519123
3863581 |
| Net Profit Before WPPF Less: Contribution to WPPF | 25,004,146
1,190,674 | 26661221
1269583 | 37382704
1780129 |
| Net Profit Before Tax Less: Provision for tax | 23,813,472 4,418,158 | 25391638 3327184 | 35602575 5105321 |
| Net Profit after Tax Less: Tax Holiday Reserve | 19,395,314
—- | 22066454
5720410 | 30497254
6304783 |
| Net Profit After tax Holiday Reserve Less: prior year adjustment |
19,395,314
1,15,493 |
16344044
82143 |
24192471
—- |
|
Net Profit after prior year’s Adjustments Add: Transfer from Revaluation Reserve Inappropriate Surplus brought forward |
19,279,821
29,79,982
18,53,797 |
16261901
3125101
2666795 |
24192471
3277574
1236750 |
| Surplus Available for Appropriate Less: Appropriation: Proposed dividend General reserve Income tax reserve Dividend equalization fund |
24,113,600
192,000,00 19,200,00 1,000,000 1,000,000
23120000 |
22053797
19200000 — 1,000,000 —-
20200000 |
28706795
2304000 1000000 1000000 1000000
2604000 |
| Inappropriate surplus carried forward
|
993600 |
1853797 |
2666795 |