
Executive Summary : Libra Infusions Ltd is playing a vital role in medicine sector of Bangladesh. I have discussed about the general marketing performance of Libra Infusions Ltd, Mirpur , Dhaka. It committed manufacturing world class Quality Products using modern technology. It maintaining Quality Management System (QMS) through documentation of all activities of the Company complying with International standard requirement of ISO 9001 through developing employees at all levels by regular training participation.
It highly committed customer satisfaction through service up to their level of expectation. Libra reviews activities and performance of its operation to ensure compliance with commitment.
Chapter 1
Introduction
Internship program is the practical aspect of our theoretical learning. It makes a bridge between the gap of class room learning and practical learning. In this view, Internship plays a pivotal role for each professional degree like BBA. The study will help formulate suitable policies taking into consideration different ideas, suggestions and feelings of the customer and producer. Further more, it may note that Libra Infusions Ltd executives who are really executing the policies undertaken by the top management will have a chance to communicate their interaction and necessary feedback. Pharmaceutical companies are very much essential for all the people of the country especially for the patient. And the medicines of Libra Infusions Ltd are plying like a new life to a patient.
Origin of the Report
Now we are living in the age of competition at anything in any place. From that tendency recently education is also in the age of competition. So the procedures and standards of teaching are upgraded by different universities and institutions in our country. In respect to that, internship is mandatory for our BBA program offered by NationalUniversity. This program is partial fulfillment of our BBA curriculum. To do so I decided to complete my internship in Libra Infusions Ltd. In connecting, HRD of Libra Infusions Ltd sent me to the Sylhet Branch and assined to prepare this report.
So, the report entitled “Marketing Management of Libra Infusions Ltd” has been prepared as a partial fulfillment of BBA program authorized by the Director of BBA program, Department of BBA, MohammadpurKendriyaCollege.
Rationale of the study
Due to the increased competition of the increased number of medicine industry and growing economy, the expectations of the customers have also increased than ever before
Realizing the present condition, pharmaceutical companies are trying to elevate their medicine service as much as reachable to their customers. So it is the duty of the top management of the medicine sector to work with the situation.
Benefits to the Institution through the Report
The Company will get an overall picture on marketing management of the company through this report. It may take steps to overcome shortage or weakness; at the same time it may explore the opportunities it does have.
Special Objectives of the report
Objectives regarding this study are as follows:
(a) To fulfill academic requirement.
(b) To gain practical knowledge in Marketing Management.
(c) To compare Libra Infusions Ltd with others ISO certified Medicine Company.
(d) To make a general evaluation of this company’s marketing activities among different professionals.
(e) To find out the real picture of Libra Infusions Ltd production, distribution and
Marketing.
(f) To get an overview of the Medicine company in our country.
(g) To identify major strength and weakness of Libra Infusions Ltd. In respect to other medicine company.
(h) To analyze the demand and quality of different type of medicine of Libra
Infusions Ltd.
(i) To assess and evaluate the growth trends on Libra Infusions Ltd among other
Medicine Company.
(j) To recommend ways and means to solve problems regarding marketing
Management.
Duration
The duration of the study was a very short span of time. It was three month long internship program (20th December 2010 to 18th March 2011). It was very much hard to complete a report as well as assigned task by the medicine Company. So I hade to complete this study facing very much time pressure.
Scope of the study
Libra Infusions Ltd is one of the largest Medicine Company in Bangladesh. This company operates through 20 branches in the country. I am assigned to learn practical
Knowledge from Libra Infusions Ltd, Sylhet Branch. In this study I would try to concentrate on the theoretical aspect of Marketing Management. I would analyze the data on the company and various marketing strategies.
So, this report covers only “Marketing Management of Libra Infusions Ltd” Especially this report emphasizes on the product Planning, Branding, Pricing, Sales promotion, Advertising, Channels of distribution etc.
Methodology of the Report
The report is descriptive in nature. To fulfill the objectives of this report total methodology has divided into two major parts:
SOURCE OF DATA
PRIMARY DATA SECONDARY DATA
Data Collection Procedure: In order to make the report more meaningful and presentable, two sources of data and information have been used widely. Both primary
and secondary data sources were to generate the report.
The “Primary Sources” are as follows:-
- I have made questionnaire survey of both the assistant general managers and others officers of the branch and the various pharmacies.
- Relevant file study as provided by the officers concerned.
The “secondary Sources” are as follows:-
- Office files and documents
- Web sites
- Study related books and journals.
(b) Data processing & analysis:
Collected information then processed and compiled with the aid of MS Word and other related computer software. Necessary tables have been prepared on the basis of collected data and various statistical techniques have been applied to analysis on the basis classified information. Detail explanation and analysis have also been incorporated in the report.
Limitations of the Study
To prepare a report on the topic like this is an short duration is not easy task. In preparing this report some problems and limitations have encountered which are as follows:
(a) The main constraint of the study was insufficiency of information, which was required for the study. There are various information the employee cannot provide due to security and other corporate obligations.
(b) As the data in most cases are not in organized way, the company failed to provide all information.
(c) Due to time limitation, many of the aspects could not be discussed in the present report.
(d) Since the company personnel were very busy, they could not pay enough time.
(e) Lack of opportunity to access to internal data.
(f) I had to base on the secondary data for preparing this report.
(g) Legal action related information was not available
(h) All of them are not eager to give me any kind of legal action related information.
(i) All the clients whom I interviewed did not want to provide necessary information.
Libra Infusions Ltd at a Glance:
Company Profile
There was always a scarcity of Intravenous (I.V.) Fluid in the market as Govt. could not manufacture enough to fulfill the local demand. Before 1985, the major portion of the local demand was being covered by the imported I.V. Fluid. To overcome this situation LIBRA made its debut in February 1985 under the strong leadership of Dr. Roushon Alam with a view to provide quality products. The company is situated on approx. 2 acres of land at Mirpur I/E, Dhaka. The factory is housed in a centrally Air Conditioning modern building having all necessary facilities. I.V. Fluid, the product of the company is a life saving and a basic medical necessity used in all medical situations involving diarrhoeal disease, surgical operation, loss of blood, weakness and hospitalization in general. LIBRA’s I.V. Fluid being a quality product has a tremendous demand in the market.
The technology has been supplied by M/S Vifor S.A., Geneva, Switzerland under a Technical Collaboration Agreement. In addition, implementation of ISO 9001 Quality Management System has ensured customer satisfaction by guaranteeing good design, reliable product quality, safe performance, prompt delivery and efficient service. LIBRA employed a team of highly qualified and motivated staff. Since LIBRA came first in this segment of pharmaceuticals, the company had to struggle with a lot of adverse situations.
But today, LIBRA is known to the medical profession and general public as the best and largest manufacturer of I.V. Fluid in Bangladesh.
Quality Policy
We at “LIBRA” are committed to provide total customer satisfaction for all products formulated & processed. This is achieved by:
• Implementing defined quality management system
• Continuous upgradation of technology
• Creating quality awareness &active participation of employees at all levels
Manufacturing Technology
Libra always uses modern technology for manufacturing I.V. Fluid a life saving product. The production is based on imported raw & packing materials our Quality Assurance System ensure full quality control testing in accordance with product requirements Technical support including LAL test, validation and stability studies are available as a part of our commitment to quality.
Human Resource
Libra has a experienced dedicated staff members which included pharmacists, chemists, doctors, engineers, accountants and other professionals. Libra’s success depends on sincerity, hard labor and team efforts of employees at all levels. Libra invests in personal and professional development of its employees through training and workshop.
PRODUCTS
Name & Details | Pack Size | Trade | VAT (Tk) | TP+VAT (Tk) | MRP(TK) | |
| • LIBOTT 5% Dextrose For rehydration at the time of Water deficit, General weakness and Post surgical intervention. Available in 500 ml & 100 ml pack size. | 500 ml | 36.64 | 6.05 | 42.69 | 48.55 | |
| 1000 ml | 46.55 | 7.68 | 54.23 | 61.70 | ||
| • LIBOTT-10 1% Dextrose For the treatment of Jaundice, General weakness, Eclampsia, Pre-eclampsia, During pregnancy & after delivery and post surgical intervention. Available in 500 ml &1000 ml pack size | 500 ml | 42.50 | 7.01 | 49.51 | 56.32 | |
| 1000 ml | 58.24 | 9.61 | 67.85 | 77.16 | ||
| • LIBOTT-25 25% Dextrose It is used in emergency treatment of Severe hypoglycaemia. To reduce cerebro-spinal pressure and energy malnutrition. It is the most extensively used injection in hospital practice. Available in 100 ml & 250 ml pack size | 100 ml | 27.00 | 4.46 | 31.46 | 35.41 | |
| 250 ml | 44.27 | 7.30 | 51.57 | 58.67 | ||
| • LIBOTT-S 5% Dextrose + 0.9% Sodium Chloride For rehydration during general weakness, Water deficiency along with sodium, Diuresis, Intoxication and post surgical intervention. Available in 500 ml &1000 ml pack size | 500 ml | 36.64 | 6.05 | 42.69 | 48.55 | |
| 1000 ml | 47.33 | 7.81 | 55.14 | 62.71 | ||
| • LIBOTT-S JR 5% Dextrose + 0.45% Sodium Chloride It fulfills water deficit along with low deficiency of NaCl, simultaneously it supplies energy for growing children. It also excludes the risk of hypernatreamia in adult where less NaCl deficiency occur. Available in 500 ml pack size | 500 ml | 42.62 | 7.03 | 49.65 | 56.47 | |
| • NORMASOL 0.9% Sodium Chloride This solution is used for correction of serious sodium deficit. It’s use is essential for haemodialysis procedure. It can be used topically for irrigation of wounds and body cavities. Available in 500 ml &1000 ml pack size | 500 ml | 35.01 | 5.78 | 40.79 | 46.39 | |
| 1000 ml | 43.38 | 7.16 | 50.54 | 57.48 | ||
| • BABY SALINE 5% Dextrose + 0.225% Sodium Chloride It fulfills both water deficit along with low deficiency of NaCl, simultaneously it supplies energy for neonates & infants. It also excludes the risk of hypernatreamia in adult where less NaCl deficiency occur. Available in 250 ml & 500 ml pack size | 500 ml | 38.05 | 6.28 | 44.33 | 50.42 | |
| 250 ml | 39.69 | 6.55 | 46.24 | 52.60 | ||
| • DIASOL 0.5% Sodium Chloride + 0.652% Sodium Acetate, 3H2O + 0.10% Potassium Chloride. It is used in dehydration during Diarrhoea, Cholera, Vomiting and Profuse sweating. Available in 500 ml &1000 ml pack size | 500 ml | 39.69 | 6.55 | 46.24 | 52.60 | |
| 1000 ml | 49.62 | 8.19 | 57.81 | 65.74 | ||
| • HARTSOL 0.6% Sodium Chloride + 0.040% Potassium Chloride + 0.027% Calcium Chloride, 2H2O +0.65% Sodium Lactate 50% Soln. Mainly used as a fluid and electrolyte replenisher in hypovolaemia caused by trauma, surgery, haemorrage and burn. Available in 500 ml &1000 ml pack size | 500 ml | 39.58 | 6.53 | 46.11 | 52.44 | |
| 1000 ml | 45.67 | 7.54 | 53.21 | 60.51 | ||
| • LIBRAZOL 0.5% Metronidazole The most effective antimicrobial agent for the treatment of anaerobic infection. Available in 100 ml pack size | 100 ml | 37.85 | 6.25 | 44.10 | 49.57 | |
| • LIBRACIN 0.2% Ciprofloxacin The most active and potent fluoroquinolone for the treatment of both gram positive and gram negative bacteria including mixed infections. Available in 100 ml pack size | 100 ml | 80.20 | 13.23 | 93.43 | 106.25 | |
| • LIBOTT-M 4.3% Dextrose + 0.18% Sodium Chloride Isotonic dextrose saline LIBOTT-M, the possible maintenance fluid throughout the pre & post operative fluid regime. Available in 500 ml &1000 ml pack size | 500 ml | 35.88 | 5.92 | 41.80 | 47.54 | |
| 1000 ml | 46.56 | 7.68 | 54.24 | 61.70 | ||
| • LIBRACIN-400 Ciprofloxacine Lactate USP 508 eq to Ciprofloxacine USP 400mg Injection | 100 ml | 1110.00 | 18.15 | 128.15 | 145.75 | |
| • LIBRET Ranitidine HCL 50mg I.V. Injection USP | 100 ml | 41.51 | 6.85 | 48.36 | 55.00 |
| 5 Year’s Financial Highlights | ||||||||||||||||||||||||||||||||||||||||||||||||||||||||||||||||||||||||||||||||||||||||||||||||||||||||||||||||||||||||||||||||||||||||||||||||||||||||||||||||||||||||||||
|
| «•» Highlights On Major Items | |||||||||||||||||||||||||||||||||||||||||||||||||||||
|
Board of Directors:
| • Begum Shamsun Nahar Ahsanullah – Chairperson |
| • Dr. Roushon Alam – Director & Founder |
| • Begum Ayesha Alam – Managing Director |
| • Saira Mariam Alam – Director |
| • Monami Alam – Director |
Company Secretary :
| • M.A. Rashid |
Auditors:
| M/s. Muhammad Shaheeddullah & Co. |
| Chartered Accountants |
| 19 Bangabandhu Avenue |
| Dhaka House (2nd Floor) |
| Dhaka-1000. |
| Bankers: |
| Agrani Bank |
| Amin Court Branch |
| 62-63 Motijheel C/A, |
| Dhaka-1000.
|

Contact Address Registred Office:
| I/7, Mirpur Industrial Estate, Rupnagar Section-2, Dhaka-1216, Bangladesh . Tel: 9001179, 9004770-1, 8012534, 8012536 Fax: (880-2) 8015833, E-mail:libra@libragroupbd.com |
Factory & Corporate Head Quarter:
| I/7, Mirpur Industrial Estate, Rupnagar Section-2, Dhaka-1216, Bangladesh . Tel: 9001179, 9004770-1, 8012534, 8012536 Fax: (880-2) 8015833, E-mail: |
VISION
All of our activities should benefit the society to take health care. We strongly believe that in the final analysis we are accountable to our employees, our customers, citizen of our country and shareholders.
MISSION
To attain Vision will devote its resources to manufacture world class products using modern technology.
Financial Position for the Half year ended on 31 December 2010
Sl. No | Particulars | Jul 2010 to Dec 2010 Taka |
1 | Turnover | 18,30,07,026.00 |
2 | Net profit after tax | 43,99,541.00 |
3 | Earning per share (of Tk. 100.00 each) | 35.15 |
4 | Net assets value | 196,28,82,650.00 |
5 | Net Operating cash flow per share | (205.61) |
MARKETING
Organization of marketing department of “Libra Infusions Ltd”
Vice President of Marketing
Director of Product Director of Marketing
Marketing Communication
Product Planning
Product planning is a process used to identify and develop new products. The purpose of planning is to make choices about which product ideas a company should invest in. Companies can approach product planning from a number of different perspectives. Having a system in place before planning begins is important as it helps to avoid wasted time and creates a framework for decision making. Consultants who specialize in marketing and corporate decision making can be involved in the development of a product planning system for a company, which will accommodate the company’s approach to business while helping it avoid expensive dead ends.
At any given time, a company should have numerous ideas for new products and services circulating. These ideas come from customers, distributors, people within the company, and research conducted by the company. This research can include surveys, research on competitors, and study of the market to identify emerging needs. A company must be able to act quickly on time-sensitive product ideas while also stopping bad ideas in their tracks.
The Product Planning Process Of Libra
The product planning process is one of the most controversial within any company. Everyone wants a hand in new product definition and almost everyone will have contributions that will make a new product successful. With all these interested parties, you are going to need a system to help you through the product planning process and a way to decide which ideas have the most merit. This system also needs to incorporate customer feedback, assure that important new product ideas are approved, and that development of them initiated immediately. What follows is a product planning system that works well for most companies.
The above diagram outlines the phases in the product planning cycle. In any given company, these steps may be condensed or combined. For example, some companies may use a single document to cover both the Market Requirements Document and the Functional Specification.
The steps are important because they allow you to gather input from all possible resources, evaluate the potential of each idea and gather input from all involved parties about which ideas will work and their ease of implementation.
Input
There should be no shortage of new product ideas. If you are doing regular customer councils and customer surveys, you should have a long list. (Please see Chapter 2 for more information on gathering regular input from customers and your sales channels.) You will also have ideas from sales, engineering, technical support, and management. The biggest job is narrowing down the list. A regular poll of sales, tech support, engineering, and customers for product ideas may help you prioritize. Be sure everyone in your company knows to feed product ideas to you. Often times the tech support organization has a unique insight to customer requirements because they are in contact with customers who need help daily, but no one ever bothers to ask them. When you need to narrow the list further, run it by your customer council. You can ask them to vote on the product ideas they think are most valuable.
You should also understand your current products, what is selling, what isn’t, and why. Finance should be able to provide you with a breakdown of sales by product. A couple of phone calls to key sales people should provide you with an earful of information on why certain products are selling well and why others are not. Product managers are also called upon to do customer presentations to major accounts. These presentations should be open communication sessions. It is an excellent opportunity to learn first-hand what the customer needs and how they are using your product. (For more information please see Chapter 2, “Customer Presentations”)
Competitive analysis is also an important part of product planning. Your customers, sales channels, and prospects evaluating your product will tell you where you fall short competitively. Additionally you may want to take an existing strength that you have over your competitors and lengthen your lead with improvements to that strength. Remember that a competitor won’t release a feature that is just on par with your product, they will be trying to exceed your strength. Also understand where your competitors are going and what products they have in the works. You won’t get this information directly from them, but you may hear rumors or see press on their strategic directions. Additionally listen to your prospects when they are asking you about your product features and directions. Often times they are parroting back information that your competitor’s have given them. The World Wide Web is also an excellent place to gather competitive information. Often times competitors will publish their strategic directions and, for software companies, actually have beta versions of their new software releases available.
Market analysis is also important. Trends in the industry need to be factored into your product plans. Professional market analysts can help you with this if you want a third-party perspective. Your engineering group will also provide some good ideas in this area; they are generally on top of many of the new technologies.
Don’t forget the possibility of discontinuing a current product. Discontinuing a product is a tough decision, but many companies have failed because they have spent too much of their resource trying to maintain a product with old, difficult technology. (Please see the product discontinuation section for more information on when to discontinue a product.)
Narrow down the list to a handful of ideas that you want to investigate further. Remember that the most important criteria for your company is return on investment. The top ideas that you select must either have broad market appeal (within your current market) or enable you tap a new market.
Product Ideas Refined
After narrowing down the list of potential new products or features enhancements for an existing product, you will want to refine some of the more promising ideas. Before a product idea is funded, some basic information needs to be gathered about who is going to buy the product, how much they will buy, and how much it will cost to develop it. This is the information that will eventually be expanded upon in the MRD (Market Requirements Document) but should be gathered and presented in summarized form to seek product approval. Here is the type of information you will need:
- Product Description – You need enough information so that the product can be easily described in one or two sentences to customers or other people within the company. Also position the product. Who buys the product? Why is the product of value to the buyer? Why is it better than the competition? One over-used, but effective measurement of your description is the “elevator test”. Can you sell the product idea to potential customer in the short time that you would have them as a captive audience on an elevator.
- Market Justification – Why should the company build this product? Who needs it? How much will they buy? Including market numbers and real sales projections will help you determine the size and the viability of the market. These will initially be very rough estimates until you have time to determine competing products’ marketshare.
- Resource Projection – Work with the engineering organization to get an initial very rough estimate on what it will take to build the product in terms of people-years. You will probably meet some resistance with this. No engineering manager wants to sign up to a schedule for a product that is not well defined. You will need to assure the engineering manager that no product will be defined until management can be assured of the return on investment and you can’t figure out ROI without having an estimation of the investment. Be sure to use these schedule numbers with the caveat that they are rough estimates and real schedules will be defined after the product is specified.
Products Approved
Once you have gathered the above information for you product proposals, you need to get the project approved. I recommend using a product planning meeting for this because it allows you to present all the appropriate information to everyone at once. It is also a great forum for discussion of the merits of the product. (See “Running an Effective Product Planning Meeting” below for more information.)
In some companies, you may need a full market requirements document before the project is approved. This is not the most effective method of product planning for the following reasons:
- At this point, the product manager’s time is best used looking at the broad picture and narrowing down the most promising product ideas. To do the research work required for a full MRD wastes time before the project is approved.
- Projects are better refined by all parties involved. There should be an open discussion of the project’s viability before a detailed MRD is generated.
The company should have an “Approved Projects List” (some companies call this a Plan of Record or POR) that is either published regularly or located centrally where everyone can access it. If your company doesn’t have one, then create one. This is a list of all projects that are approved and currently being developed in the company or division. Having one central list will provide a point of focus and clarify the priorities for all involved. Ideally the list should be updated regularly and posted in a central location. When a project is added to the list, it should be funded with development resources.
Market Requirements Refined
Once the product is approved you can refine the market requirements, adding more detail on the desired features of the product and how the customers will use the product. (See the “Market Requirements Document” section of this chapter for more information.) There will be two types of MRDs, one for new products and a second for new releases of a current product. The new product MRD will require
Development Initiated
Once the MRD is complete, the developers can start to work on a functional specification and prototypes. Some companies combine the MRD and Functional Specification into one document to help them decrease time to market. To do this, you must work very closely with engineering to make sure that the functional design of the product will indeed meet customer requirements. (Please see Chapter 4 – The Product Development Cycle for more information on working the Product through the development cycle
Running a Successful Product Planning Meeting
Why have a product planning meeting? Everyone hates meetings and adding one more won’t be popular. You need a meeting because time-to-market is the key to success in the high-tech industry. Anything that delays your time-to-market hurts your company. If you can gather everyone in a room and get them to agree that a new product must be funded and development started immediately, you have decreased your time-to-market.
The meeting gives you a forum to formally add and remove products and projects to the approved projects list and to make sure that everyone involved is clear on the priorities. It also gives them visibility to why the priorities are what they are.
I initially started product planning meetings when I was working in a CEO-driven company. This particular CEO would wander over engineering and together with a couple key engineers they would come up with a great idea and suddenly we had a new product that was funded. The problem was that the product was not necessarily something our customers wanted and the products our customers wanted most, didn’t have the resources assigned to them. I put the product planning meeting in place so that all ideas were researched, discussed, and approved or rejected at this meeting with everyone’s input.
This process may seem like a lot of work, and frankly it is. By comparison, you wouldn’t just start writing code on a software product without doing the structure and design work first. When you compare the effort of product planning to spending hundreds of man-hours of development resource for a product that sales can’t sell and customers won’t buy, the planning work is nominal.
How often you run product planning meetings depends upon the size of your engineering group and the dynamics of your market. Once every six weeks to once every quarter, should be often enough to reset priorities. Although the market may change overnight, product development can’t and shouldn’t be asked to. Changes to development plans, schedules and priorities need to be carefully measured.
Attendees
The objective of the meeting is to obtain product approval, so you need to invite everyone who has a say in such things including the President, CEO, VP of Marketing, VP of Engineering, VP of Finance, and VP of Manufacturing. You also want to invite anyone who will provide lively but productive discussions. (It is also your job to keep these discussions under control and not let the meeting get side-tracked.) Invite as much of engineering as you can get away with. You don’t want the meeting to become unwieldy, but at the same time you don’t want someone coming back later saying that the product should not have been approved or rejected without their input.
Meeting Format
Everyone should be notified well in advance of the meeting about which potential products or features are to be discussed. This will allow concerned parties to give you their input well in advance of the meeting. The idea is not to “spring” new product ideas in the meeting, but give people time to think about the new ideas and how it will affect their aspect of the business. Here is a sample agenda.
- Overview of the market and significant changes in the market since the last product planning meeting or within the last quarter. This is done so that the audience has complete exposure to all the changes and trends in the market. It will allow them to be better prepared to make product decisions.
- Review of company direction. A very quick review of the company’s long term goals will help everyone keep the strategy in mind when making product decisions.
- Review of the current approved products and schedules, preferably by the VP of Engineering. This lets the audience understand the current workload and how time is already allocated. If current projects are slipping it makes no sense to add new projects without removing some.
- Discussion of new project proposals or changes. Each product should be given 45 minutes to an hour for presentation and discussion, so you should only try to do four to six products in a single meeting. You will probably need to run the meeting through lunch and ideally have it off-site where there are no interruptions.
It is important to drive the meeting to conclusion. This should be your primary purpose in the meeting. The meeting should end with a review of all projects and which were approved, rejected, or need further investigation. Also included should be a list of proposed projects for the next meeting.
Product planning meeting minutes should be published immediately following the meeting. Meeting minutes are painful and it is always easy to put them off, however for this meeting the decisions are so critical to every aspect of the business that I would recommend getting the minutes out the night of the meeting.
For projects that are approved, work should commence on a Market Requirements Document
The Preparation
The outline below shows you what information should be included on the product planning slides for each product.
You need to prepare all the slides in advance of the meeting. You will want to schedule some time with engineering to review the slides before they are finalized. This is necessary for the following reasons:
- Engineering needs to provide resource estimates.
- Engineers may have great ideas on a particular implementation of a product or even a good target market for the product.
- Engineers may have strong opinions on a given project. It is best to understand those before trying to get the project approved.
For the meeting you will want to have the room set up in a round table format to encourage discussion. Have copies of the slides and back-up documentation for everyone involved. New products are controversial and anything you can do to make the meeting run smoother is important to the overall objective of the company working on projects with the best return on investment.
Outline of Presentation
I recommend using only one or two slides per product. You can hand out any back-up material. A simple standard format will allow anyone to look back at the slides and recommendations without becoming lost.
Sample Presentation
Project Name– Come up with a name for the project that is easy to identify, but don’t spend a lot of time on it, this isn’t the final product name.
Product Description – Give a brief bulleted description of the product and its positioning (why it is of value to the customers and why it is better than anything else on the market).
Recommedation – Most people would want the recommendation last, but I have worked with plenty of unruly groups who would get sidetracked long before the product manger could talk about their recommendation. So I put it as far up to the top as possible. If you are working with a more civilized group of people, you can put it at the end.
The recommendation should be one of three things: Add the project to the approved projects list and fund it, reject the project (removing it if it was on the list), or hold for further investigation. If a project is a fairly new idea and you haven’t had the opportunity to run it by your customers, you may want to recommend that you spend some more time on the market justification before it is approved. The only other statement that may be made here is the recommendation to discontinue a current product. If this is a recommendation then there should also be a discussion of the replacement product.
Market Justification – Why should the company build this product? Who needs it? How much will they buy? Include market size numbers here and real sales projections. Just remember that the VP of Sales isn’t going to sign up to these preliminary numbers!
Resource Projection – This should be a rough estimate from engineering on what it will take to build the product.
The Decision
Getting a decision from the meeting is crucial, even if the decision is that more information is needed. The ultimate decision generally falls into one of four categories:
- Approved – If there is sufficient information to approve a product, then it is added to the list of approved products and the next step, whether it is writing a market requirements document, or writing a functional specification, is started.
- Canceled – If there is not sufficient justification for a product, or it does not fit into the company strategy then it should be canceled and removed from the list of approved projects (if it was there to begin with).
- Hold pending further investigation – No matter how much research you do on a project, questions may come up that you don’t have ready answers for. Sometimes a decision will need to be delayed pending further market research information or an investigation from development. In any case, the additional information should be gathered and the project should be discussed at the next product planning meeting.
- Hold for future – If the product fits into the company strategy, but the resources are unavailable to work on it, it may be a good idea to put it on hold until some determined future time.
The decision should take into account the following criteria:
- Does the project fit into the company’s long term strategy?
- Does the target market for the project align with the company strategy?
- Will there be sufficient revenue from the product to justify the work required?
- If there is not sufficient revenue, are there other highly compelling reasons to justify the work?
- Are the resources available to do the work?
- If the resources are not available, should this project take precedence over another?
The person who ultimately makes the decision should be determined in advance of the meeting. This is generally the CEO, President, or CTO of the company. The forum should allow adequate discussion before the decision is reached.
Market Requirements Document (MRD)
Please see my MRD binder for good variety of resources on how to write a market requirements document.
Product Line and Mix of Libra
Product Line
A product line is a group of products that are closely related because they function in a similar manner, are sold to the same customer groups, are marketed through the same types of outlets, or fall within given price ranges. For example, Nike produces several lines of athletic shoes, Motorola produces several lines of telecommunications products, and AT&T offers several lines of long-distance telephone services.
Product Mix
A product mix (or product assortment) consists of all the product lines and items that a particular seller offers for sale. Avon’s product mix consists of four major product lines: cosmetics, jewelry, fashions, and household items. Each product line consists of several sublines.
Libra’s product mix has four important dimensions: width, length, depth, and consistency. Product mix width refers to the number of different product lines the company carries. For example, Procter & Gamble markets a fairly wide product mix consisting of many product lines, including paper, food, household cleaning, medicinal, cosmetics, and personal care products. Product mix length refers to the total number of items the company carries within its product lines. Procter & Gamble typically carries many brands within each line. For example, it sells eleven laundry detergents, eight hand soaps, six shampoos, and four dishwashing detergents.
Product line depth refers to the number of versions offered of each product in the line. Thus, Procter & Gamble’s Crest toothpaste comes in three sizes and two formulations (paste and gel). Finally, the consistency of the product mix refers to how closely related the various product lines are in end use, production requirements, distribution channels, or some other way. Procter & Gamble’s product lines are consistent insofar as they are consumer products that go through the same distribution channels. The lines are less consistent insofar as they perform different functions for buyers.
Product decisions
Marketing starts with the product since it is what an organization has to offer its target market. As we’ve stressed many times in this tutorial, organizations attempt to provide solutions to a target market’s problems. These solutions include tangible or intangible (or both) product offerings marketed by an organization.
In addition to satisfying the target market’s needs, the product is important because it is how organizations generate revenue. It is the “thing” that for-profit companies sell in order to realize profits and satisfy stakeholders and what non-profit organizations use to generate funds needed to sustain itself. Without a well-developed product strategy that includes input from the target market, a marketing organization will not have long-term success.
In this part of the Principles of Marketing Tutorials we take a close look at the key concepts all marketers should consider when faced with product decisions. In the Managing Products tutorial we will extend the discussion to look at the key issues in managing product decisions.
Key Product Decisions
The actual product is designed to provide the core benefits sought by the target market. The marketer offers these benefits through a combination of factors that make up the actual product.
Below we discuss in detail four key factors that together help shape the actual product. These factors include:
- Consumable Product Features
- Branding
- Packaging
- Labeling
Branding
Branding involves decisions that establish an identity for a product with the goal of distinguishing it from competitors’ offerings. In markets where competition is fierce and where customers may select from among many competitive products, creating an identity through branding is essential. It is particularly important in helping position the product (see discussion of product position) in the minds of the product’s target market.
While consumer products companies have long recognized the value of branding, it has only been within the last 10-15 years that organizations selling component products in the business-to-business market have begun to focus on brand building strategies. The most well-known company to brand components is Intel with its now famous “Intel Inside” slogan. Intel’s success has led many other b-to-b companies and even non-profits to incorporate branding within their overall marketing strategy.
Packaging
Nearly all tangible products (i.e., goods) are sold to customers within a container or package that, as we will discuss, serves many purposes including protecting the product during shipment. In a few cases, such as with certain produce items, the final customer may purchase the product without a package but the produce marketer still faces packaging decisions when it comes to shipping to the store. Thus, for many products there are two packaging decisions:
- Final Customer Package
- Distribution Channel Package
Labeling
Most packages, whether final customer packaging or distribution packaging, are imprinted with information intended to assist the customer. For consumer products, labeling decisions are extremely important for the following reasons.
- Labels serve to capture the attention of shoppers. The use of catchy words may cause strolling customers to stop and evaluate the product.
- The label is likely to be the first thing a new customer sees and thus offers their first impression of the product.
- The label provides customers with product information to aid their purchase decision or help improve the customer’s experience when using the product (e.g., recipes).
- Labels generally include a universal product codes (UPC) and, in some cases, radio frequency identification (RFID) tags, that make it easy for resellers, such as retailers, to checkout customers and manage inventory.
- For companies serving international markets or diverse cultures within a single country, bilingual or multilingual labels may be needed.
- In some countries many products, including food and pharmaceuticals, are required by law to contain certain labels such as listing ingredients, providing nutritional information or including usage warning information.
Libra’s New Product Development Strategy
- New Product Development Strategy
- You can download this presentation at: www.studyMarketing.org Visit www.studyMarketing.org for more presentations on Marketing, Strategy, Innovation, and Branding
- Key Steps in New Product Development
- Key Steps in New Product Development Idea Generation Product Screening Concept Testing Business & Financial Analysis Product Development Test Marketing Commercialization
- Idea Generation Idea generation is a continuous, systematic search for new product opportunities. It involves delineating sources of new ideas and methods for generating them.
- Methods for Generating Ideas Dimensional Analysis lists all of the physical characteristics of a product type. Having obtained such a list, creativity can be triggered by asking questions such as: "Why is the product this way?“, "How could the product be changed?" or "’What would happen if one or more of the characteristics were removed?"
- Problem Analysis is a need-assessment technique designed to develop an inventory of consumer problems in a particular product or service category and to serve as a basis for new product or service ideas.
- Benefit Structure Analysis determines what specific benefits and characteristics are desired by consumers within a particular product or service category and identifies perceived deficiencies in what is currently provided.
- Scenario Analysis identifies opportunities by capitalizing on projected future environments and associated consumer needs.
- Product Screening After the firm identifies potential products, it must screen them. In product screening, poor, unsuitable, or otherwise unattractive ideas are weeded out from further actions.
- Today, many companies use a new-product screening checklist for preliminary evaluation.
- In it, firms list the new-product attributes considered most important and compare each idea with those attributes.
- The checklist is standardized and allows ideas to be compared.
- Concept testing presents the consumer with a proposed product and measures attitudes and intentions at this early stage of development. Concept Testing
- Concept testing is a quick and inexpensive way of measuring consumer enthusiasm. It asks potential consumers to react to a picture, written statement, or oral description of a product. This enables a firm to determine initial attitudes prior to expensive, time-consuming prototype development.
- Business and financial analysis for the remaining product concepts is much more detailed than product screening. Business & Financial Analysis
- Factors considered in business analysis stage :
- Demand projections
- Cost projections
- Competition
- Required investment
- Profitability
- Product development converts a product idea into a physical form and identifies a basic marketing strategy. Product Development
- It involves product construction, packaging, branding, product positioning, and usage testing.
- Test marketing involves placing a product for sale in one or more selected areas and observing its actual performance under the proposed marketing plan. Test Marketing
- The purpose is to evaluate the product and pretest marketing efforts in a real setting prior to a full-scale introduction.
- Rather than inquire about intentions, test marketing allows actual consumer behavior to be observed. The firm can also learn about competitive reactions and the response of channel members.
- After testing is completed, the firm is ready to introduce the product to its full target market. This is commercialization and corresponds to the introductory stage of the product life cycle.
- Commercialization involves implementing a total marketing plan and full production.
- Key Success Factors in New Product Development
- An investigation of new product practices in 700 firms by Booz-Allen & Hamilton identified the existence of common characteristics in companies that were successful at product innovation
- Successful companies are more committed to growth through new products developed internally. 1. Operating Philosophy
- They are more likely to have had a formal new product process in place for a longer period of time than unsuccessful companies. They are more likely to have a strategic plan that includes a certain portion of company growth from new products.
- Successful companies are more likely to house the new product organization in R&D or engineering and are more likely to allow the marketing and R&D functions to have greater influence on the new product process. 2. Organizational Structure
- Experience in introducing new products enables companies to improve new product performance. 3. The Experience Effect
- New product development costs conform to the experience curve: The more you do something, the more efficient you become at doing it. This experience advantage stems from the acquisition of a knowledge of the market and of the steps required to develop a new product.
- Successful companies appear not only to select a management style appropriate to immediate new product development needs but also to revise and tailor that approach to changing new product opportunities 4. Management Style
- An empirical research by Robert Cooper found three key factors that distinguish winning projects from the losers
- Factor 1: A High-Quality New Product Process Factor 2: A Clear and Well-Communicated New Product Strategy for the Business Factor 3: Adequate Resources for New Products three key factors three key factors for effective product development:
- Factor 1: A High-Quality New Product Process
- Some of these success factors that top performers build into their new product processes include:
- emphasizing the up-front predevelopment homework;
- building in the voice of the customer throughout
- Some of these success factors that top performers build into their new product processes include:
- Factor 1: A High-Quality New Product Process
- demanding sharp, early product definition
- having tough Go/Kill decision points where projects really do get killed
- and highlighting quality of execution throughout
- there are clear goals or objectives for the business’s total new product effort; for example, what percentage of sales or profits new products will contribute to the business
Factor 2: A Clear and Well-Communicated New Product Strategy for the Business
- there are clearly defined arenas—specified areas of strategic focus, such as products, markets, or technologies—to give direction to the business’s total new product effort
- the role of new products in achieving the business’s goals and the new product strategy for the business are clearly communicated to all who need to know
- In top-performing businesses, senior management has devoted the necessary resources—people and money, marketing and technical—to achieve the business’s new product objectives
Factor 3: Adequate Resources for New Products
- R&D budgets are adequate—judged to be sufficient in light of the business’s new product objectives
- the necessary people are in place and have their time freed up for new products.
- Source of Reference: Robert Cooper, Winning at New Products: Accelerating the Process from Idea to Launch, Perseus Books Group.
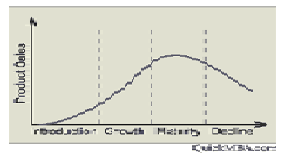
The Product Life Cycle
A new product progresses through a sequence of stages from introduction to growth, maturity, and decline. This sequence is known as the product life cycle and is associated with changes in the marketing situation, thus impacting the marketing strategy and the marketing mix.
The product revenue and profits can be plotted as a function of the life-cycle stages as shown in the graph below:
Product Life Cycle Diagram
Introduction Stage
In the introduction stage, the firm seeks to build product awareness and develop a market for the product. The impact on the marketing mix is as follows:
- Product branding and quality level is established and intellectual property protection such as patents and trademarks are obtained.
- Pricing may be low penetration pricing to build market share rapidly, or high skim pricing to recover development costs.
- Distribution is selective until consumers show acceptance of the product.
- Promotion is aimed at innovators and early adopters. Marketing communications seeks to build product awareness and to educate potential consumers about the product.
Growth Stage
In the growth stage, the firm seeks to build brand preference and increase market share.
- Product quality is maintained and additional features and support services may be added.
- Pricing is maintained as the firm enjoys increasing demand with little competition.
- Distribution channels are added as demand increases and customers accept the product.
- Promotion is aimed at a broader audience.
Maturity Stage
At maturity, the strong growth in sales diminishes. Competition may appear with similar products. The primary objective at this point is to defend market share while maximizing profit.
- Product features may be enhanced to differentiate the product from that of competitors.
- Pricing may be lower because of the new competition.
- Distribution becomes more intensive and incentives may be offered to encourage preference over competing products.
- Promotion emphasizes product differentiation.
Decline Stage
As sales decline, the firm has several options:
- Maintain the product, possibly rejuvenating it by adding new features and finding new uses.
- Harvest the product – reduce costs and continue to offer it, possibly to a loyal niche segment.
- Discontinue the product, liquidating remaining inventory or selling it to another firm that is willing to continue the product.
The marketing mix decisions in the decline phase will depend on the selected strategy. For example, the product may be changed if it is being rejuvenated, or left unchanged if it is being harvested or liquidated. The price may be maintained if the product is harvested, or reduced drastically if liquidated.
Planning with the Product Life Cycle
As we saw in the Managing External Forces and Marketing Planning and Strategy tutorials, there are many components, both internal and external, that must be considered within the marketing planning process. In fact, for many marketers creating the Marketing Plan represents one of the most challenging and burdensome tasks they face. Fortunately, over the years marketing academics and professionals have put forth theories, models and other tools that aid planning. Possibly the most widely used planning tool within marketing is the Product Life Cycle (PLC) concept. The basic premise of the PLC is that products go through several stages of “life” with each stage presenting the marketer with different challenges that must be met with different marketing approaches. By understanding a product’s position in the PLC, the marketer may be able to develop more effective plans.
There have been several attempts over the years to define the stages that make up the PLC. Unfortunately, the PLC may be different for different products, different markets and different market conditions (e.g., economic forces). Consequently, there is not a one-model-fits-all PLC. Yet there is enough evidence to suggest that most products experience patterns of activity that divide the evolution of the product into five distinct stages. These stages are:
- Development – Occurs before the product is released to the market and is principally a time for honing the product offering and preparing the market for product introduction.
- Introduction – Product is released to the market and sales begin though often gradually as the market becomes aware of the product.
- Growth – If the product is accepted it may reach a stage of rapid growth in sales and in profits.
- Maturity –At some point sales of a product may stabilize. For some products the maturity phase can be the longest stage as the product is repeatedly purchased by loyal customers. However, while overall sales may grow year-over-year, percentage sales increases may be small.
- Decline – All products eventually see demand decline as customers no longer see value in purchasing the product.
Target Markets and Market Segmentation
The market selected by a company as the target for their marketing efforts (i.e., target market) is critical since all subsequent marketing decisions will be directed toward satisfying the needs of these customers. But what approach should be taken to select markets the company will target?
One approach is to target at a very broad level by identifying the market as consisting of qualified customers who have a basic need that must be satisfied. For example, one could consider the beverage market as consisting of all customers that want to purchase liquid refreshment products to solve a thirst need. While this may be the largest possible market a company could hope for (it would seem to contain just about everyone in the world!) in reality there are no commercial products that would appeal to everyone in the world since individual nutritional needs, tastes, purchase situations, economic conditions, and many other issues lead to differences in what people seek to satisfy their thirst needs.
Because people are different and seek different ways to satisfy their needs, nearly all organizations, whether for-profits or not-for-profits, industrial or consumer, domestic or international, must use a Market Segmentation approach to target marketing. This approach divides broad markets, consisting of customers possessing different characteristics, into smaller market segments in which customers are grouped by characteristic shared by others in the segment.
To successfully target markets using a segmentation approach, organizations should engage in the following three-step process.
- Identify segments within the overall market
- Choose the segment(s) that fits best with the organization’s objectives and goals
- Develop a marketing strategy that appeals to the selected target market(s)
Market Pricing: Price Lining Method
As we have discussed many times throughout the Principles of Marketing Tutorials, marketers must appeal to the needs of a wide variety of customers tutorial . The difference in the “needs-set” between customers often leads marketers to realization that the overall market is really made up of a collection smaller market segments. These segments may seek similar products but with different sets of product features, which are presented in the form of different models (e.g., different quality of basketball sneakers) or service options (e.g., different hotel room options).
Price lining or product line pricing is a method that primarily uses price to create the separation between the different models. With this approach, even if customers possess little knowledge about a set of products, customers may perceive they are different based on price alone. The key is whether the prices for all products in the group are perceived as representing distinct price points (i.e., enough separation between each). For instance, a marketer may sell a base model, an upgraded model and a deluxe model each at a different price. If the differences in features for each model is not readily apparent to a customer, such as differences that are inside the product and not easily viewed (e.g., difference between laptop computers), then price lining will help the customer recognize that differences do exist as long as the prices are noticeably different.
Price lining can also be effective as a method for increasing profitability. In many cases the cost to the marketer for adding different features to create different models or service options does not alone justify a big price difference. For instance, an upgraded model may cost 10% more to produce than a base model but using the price lining method the upgraded product price may be 20% higher and thus more profitable than the base model. The increase in profitability offered by price lining is one reason marketers introduce multiple models, since it allows the company to not only satisfy the needs of different segments but also presents an option for a customer to “buy up” to a higher priced and more profitable model.
Steps in the Price Setting Process
We view price setting as a series of decisions the marketer makes in order to determine the price direct and indirect customers pay to acquire the product. Direct customers are those who purchase products directly from the marketer. For example, consider the direct pricing decisions that take place when a new novel is sold:
- Publisher of the book must decide at what price they will charge their immediate customers in the channel of distribution such as online booksellers (e.g., Amazon.com).
- Booksellers must decide at what price they will sell the book to their immediate customers which are typically final consumers (e.g., website shopper).
As we see with the bookseller example, many companies also sell indirectly to the final customer through a network of resellers such as retailers. For marketers selling through resellers the pricing decision is complicated by resellers’ need to earn a profit and the marketer’s need to have some control over the product’s price to the final customer. In these cases setting price involves more than only worrying about what the direct customer is willing pay since the marketer must also evaluate pricing to indirect customers (e.g., resellers’ customers). Clearly sales can be dramatically different than what the marketer forecasts if the selling price to the final customer differs significantly from what the marketer expects. For instance, if the marketing organization has forecasted to sell 1,000,000 novels if the price to the final customer is one price and resellers decide to raise the price 25% higher than that price the marketer’s sales may be much lower then forecasted.
With an understanding that marketers must consider many factors (see the Pricing Decisions tutorial) when setting price, we now turn to the process by which price is set. We present this as a five-step approach. As we noted earlier, while not all marketers follow these steps, what is presented does cover the methods used by many marketers.
The steps we cover include:
1. Examine Company and Marketing Objectives
2. Determine an Initial Price
3. Set Standard Price Adjustments
4. Determine Promotional Pricing
5. State Payment Options
Cost Pricing: Markup Method
This pricing method, often utilized by resellers who acquire products from suppliers, uses a percentage increase on top of product cost to arrive at an initial price. A major general retailer, such as Walmart, may apply a set percentage for each product category (e.g., womens’ clothing, automotive, garden supplies, etc.) making the pricing consistent for all like-products. Alternatively, the predetermined percentage may be a number that is identified with the marketing objectives (e.g., required 20% ROI).
For resellers that purchase thousands of products (e.g., retailers) the simplicity inherent in markup pricing makes it a more attractive pricing option than more time-consuming methods. However, the advantage of ease of use is sometimes offset by the disadvantage that products may not always be optimally priced resulting in products that are priced too high or too low given the demand for the product.
Resellers differ in how they use markup pricing with some using the Markup-on-Cost method and others using the Markup-on-Selling-Price method. In the next two sections we cover each option. We will demonstrate each using an item that costs a reseller (US) $50 to purchase from a supplier and sells to customers for (US) $65.
Markup-on-Selling-Price Pricing Method
Many resellers, and in particular retailers, discuss their markup not in terms of Markup-on-Cost but as a reflection of price. That is, the markup is viewed as a percentage of the selling price and not as a percentage of cost as it is with the Markup-on-Cost method. For example, using the same information as was used in the Markup-on-Cost, the Markup-on-Selling-Price is reflected in this formula:
Markup Amount = Markup Percentage
Selling Price
$15 = 23%
$65
The calculation for setting initial price using Markup-on-Selling-Price is:
Item Cost = Price
(1.00 – Markup Percentage)
$50 = $65
(1.00 – .23)
Market Pricing: Psychological Method
For many years researchers have investigated customers’ response to product pricing. Some of the results point to several interesting psychological effects price may have on customers’ buying behavior and on their perception of individual products. We stress that certain pricing tactics “may” have a psychological effect since the results of some studies have suggested otherwise. But enough studies have shown an effect that this topic is worthy of discussion.
Odd-Even Pricing
One effect dubbed “odd-even” pricing relates to whole number pricing where customers may perceive a significant difference in product price when pricing is slightly below a whole number value. For example, a product priced at (US) $299.95 may be perceived as offering more value than a product priced at $300.00. This effect can also be used to influence potential customers who receive product information from others. Many times a buyer will pass along the price as being lower than it is either because they recall it being lower than the even number or they want to impress others with their success in obtaining a good value. For instance, in our example a buyer who pays $299.95 may tell a friend they paid “a little more than $200” for the product when in fact it was much closer to $300.
Prestige Pricing
Another psychological effect, called prestige pricing, points to a strong correlation between perceived product quality and price. The higher the price the more likely customers are to perceive it has being higher quality compared to a lower priced product. (Although there is point at which customers will begin to question the value of the product if the price is too high.) In fact, the less a customer knows about a product the more likely they are to judge the product as being of higher quality based on only knowing the price. Prestige pricing can also work with odd-even pricing as marketers, looking to present an image of high quality, may choose to price products at even levels (e.g., $10 rather than $9.99).
Channels of Distribution
In the Business Buying Behavior Tutorial, we describe a supply chain as consisting of all parties and their supplied activities that help a marketer create and deliver products to the final customer. For marketers, the distribution decision is primarily concerned with the supply chain’s front-end or channels of distribution that are designed to move the product (goods or services) from the hands of the company to the hands of the customer. Obviously when we talk about intangible services the use of the word “hands” is a figurative way to describe the exchange that takes place. But the idea is the same as with tangible goods. All activities and organizations helping with the exchange are part of the marketer’s channels of distribution.
Activities involved in the channel are wide and varied though the basic activities revolve around these general tasks:
- Ordering
- Handling and shipping
- Storage
- Display
- Promotion
- Selling
- Information feedback
Type of Channel Members
Channel activities may be carried out by the marketer or the marketer may seek specialist organizations to assist with certain functions. We can classify specialist organizations into two broad categories: resellers and specialty service firms.
Resellers
These organizations, also known within some industries as intermediaries, distributors or dealers, generally purchase or take ownership of products from the marketing company with the intention of selling to others. If a marketer utilizes multiple resellers within its distribution channel strategy the collection of resellers is termed a Reseller Network. These organizations can be classified into several sub-categories including:
- Retailers – Organizations that sell products directly to final consumers.
- Wholesalers – Organizations that purchase products from suppliers, such as manufacturers or other wholesalers, and in turn sell these to other resellers, such as retailers or other wholesalers.
- Industrial Distributors – Firms that work mainly in the business-to-business market selling products obtained from industrial suppliers.
Specialty Service Firms
These are organizations that provide additional services to help with the exchange of products but generally do not purchase the product (i.e., do not take ownership of the product):
- Agents and Brokers – Organizations that mainly work to bring suppliers and buyers together in exchange for a fee.
- Distribution Service Firms – Offer services aiding in the movement of products such as assistance with transportation, storage, and order processing.
- Others – This category includes firms that provide additional services to aid in the distribution process such as insurance companies and firms offering transportation routing assistance.
Channel Arrangements
The distribution channel consists of many parties each seeking to meet their own business objectives. Clearly for the channel to work well, relationships between channel members must be strong with each member understanding and trusting others on whom they depend for product distribution to flow smoothly.
For instance, a small sporting goods retailer that purchases products from a wholesaler trusts the wholesaler to deliver required items on-time in order to meet customer demand, while the wholesaler counts on the retailer to place regular orders and to make on-time payments.
Relationships in a channel are in large part a function of the arrangement that occurs between the members. These arrangements can be divided in two main categories:
- Independent Channel Arrangements
- Dependent Channel Arrangement
Marketing Issues in Channels
Distribution strategy can be shaped by how decisions are made in other marketing areas.
Product Issues
The nature of the product often dictates the distribution options available especially if the product requires special handling. For instance, companies selling delicate or fragile products, such as flowers, look for shipping arrangements that are different than those sought for companies selling extremely tough or durable products, such as steel beams.
Promotion Issues
Besides issues related to physical handling of products, distribution decisions are affected by the type of promotional activities needed to sell the product to customers. For products needing extensive salesperson-to-customer contact (e.g., automobile purchases) the distribution options are different than for products where customers typically require no sales assistance (i.e., bread purchases).
Pricing Issues
The desired price at which a marketer seeks to sell their product can impact how they choose to distribute. As previously mentioned, the inclusion of resellers in a marketer’s distribution strategy may affect a product’s pricing since each member of the channel seeks to make a profit for their contribution to the sale of the product. If too many channel members are involved the eventual selling price may be too high to meet sales targets in which case the marketer may explore other distribution options.
Target Market Issues
A distribution system is only effective if customers can obtain the product. Consequently, a key decision in setting up a channel arrangement is for the marketer to choose the approach that reaches customers in the most effective way possible. The most important decision with regard to reaching the target market is to determine the level of distribution coverage needed to effectively meet customer’s needs. Distribution coverage is measured in terms of the intensity by which the product is made available and is discussed in detail in the next section.
Distribution Systems: Direct
With a direct distribution system the marketer reaches the intended final user of their product by distributing the product directly to the customer. That is, there are no other parties involved in the distribution process that take ownership of the product. The direct system can be further divided by the method of communication that takes place when a sale occurs. These methods are:
- Direct Marketing Systems – With this system the customer places the order either through information gained from non-personal contact with the marketer, such as by visiting the marketer’s website or ordering from the marketer’s catalog, or through personal communication with a customer representative who is not a salesperson, such as through toll-free telephone ordering.
- Direct Retail Systems – This type of system exists when a product marketer also operates their own retail outlets. As previously discussed, Starbucks would fall into this category.
- Personal Selling Systems – The key to this direct distribution system is that a person whose main responsibility involves creating and managing sales (e.g., salesperson) is involved in the distribution process, generally by persuading the buyer to place an order. While the order itself may not be handled by the salesperson (e.g., buyer physically places the order online or by phone) the salesperson plays a role in generating the sales.
- Assisted Marketing Systems – Under the assisted marketing system, the marketer relies on others to help communicate the marketer’s products but handles distribution directly to the customer. The classic example of assisted marketing systems is eBay which helps bring buyers and sellers together for a fee. Other agents and brokers would also fall into this category.
Distribution Channels
How do you sell to your end-users? Do you use a direct sales team? Resellers? A catalog or website?
Distribution channels are the pathways that companies use to sell their products to end-users. B2B companies can sell through a single channel or through multiple channels that may include
- Direct/sales team: One or more sales teams that you employ directly. You may use multiple teams that specialize in different products or customer segments.
- Direct/internet: Selling through your own e-commerce website.
- Direct/catalog: Selling through your own catalog.
- Wholesaler/distributor: A company that buys products in bulk from many manufacturers and then re-sells smaller volumes to resellers or retailers.
- Value-added reseller (VAR): A VAR works with end-users to provide custom solutions that may include multiple products and services from different manufacturers.
- Consultant: A consultant develops relationships with companies and provides either specific or very broad services; they may recommend a manufacturer’s product or simply purchase it to deliver a solution for the customer.
- Dealer: A company or person who buys inventory from either a manufacturer or distributor, then re-sells to an end-user.
- Retail: Retailers sell directly to end-users via a physical store, website or catalog.
- Sales agent/manufacturer’s rep: You can outsource your sales function to a company that sells different manufacturers’ products to a group of similar customers in a specific territory.
Distribution is one of the classic “4 Ps” of marketing (product, promotion, price, placement a.k.a. distribution). It’s a key element in your entire marketing strategy — it helps you expand your reach and grow revenue.
Here are three distribution examples:
DIRECT TO END USERS | SELL THROUGH A DEALER NETWORK | SELL THROUGH A VAR (VALUE-ADDED RESELLER) |
You have a sales team that sells directly to Fortune 100 companies. You have a second product line for small businesses. Instead of using your sales team, you sell this line directly to end-users through your website and marketing campaigns. | You have two markets and two distribution channels. You sell a product through a geographical network of dealers who sell to end-users in their areas. The dealers may service the product as well. Your dealers are essentially your customers, and you have a strong program to train and support them with marketing campaigns and materials. | You sell a product to a company who bundles it with services or other products and re-sells it. That company is called a Value Added Reseller (VAR) because it adds value to your product. A VAR may work with an end-user to determine the right products and configurations, then implement a system that includes your product. |
To create a good distribution program, focus on the needs of your end-users.
- If they need personalized service, you can utilize a local dealer network or reseller program to provide that service.
- If your users prefer to buy online, you can create an e-commerce website and fulfillment system and sell direct; you can also sell to another online retailer or a distributor to offer your product on their own sites.
- You can build your own specialized sales team to prospect and close deals directly with customers.
Wholesalers, resellers, retailers, consultants and agents already have resources and relationships to quickly bring your product to market. If you sell through these groups instead of (or in addition to) selling direct, treat the entire channel as a group of customers – and they are, since they’re buying your product and re-selling it. Understand their needs and deliver strong marketing programs; you’ll maximize everyone’s revenue in the process.
Best Case | Neutral Case | Worst Case |
You’ve used one or more distribution channels to grow your revenue and market share more quickly than you would have otherwise. Your end-users get the information and service they need before and after the sale. If you reach your end-user through wholesalers, VARs or other channel partners, you’ve created many successful marketing programs to drive revenue through your channel and you’re committed to their success. | You’re using one or more distribution channels with average success. You may not have as many channel partners as you’d like, but your current system is working moderately well. You devote resources to the program, but you wonder whether you’d be better off building an alternative distribution method — one that could help you grow more aggressively than you are now. | You probably aren’t hitting your revenue goals because your distribution strategy is in trouble. With your current system, you may not be effectively reaching your end-users; your prospects probably aren’t getting the information and service they need to buy your product. Your current system may also be difficult to manage. For example, channel members may not sell at your suggested price; they don’t follow up on leads you deliver; they don’t service the product very well and you’re taking calls from angry customers. |
Key concepts & steps
Before you begin
You can evaluate a new distribution channel or improve your channel marketing / management at any time. It’s especially important to think about distribution when you’re going after a new customer segment, releasing a new product, or looking for ways to aggressively grow your business.
Evaluate how your end-users need to buy
Your distribution strategy should deliver the information and service your prospects need. For each customer segment, consider
- How and where they prefer to buy
- Whether they need personalized education and training
- Whether they need additional products or services to be used alongside yours
- Whether your product needs to be customized or installed
- Whether your product needs to be serviced
Match end-user needs to a distribution strategy
- If your end-users need a great deal of information and service, your company can deliver it directly through a sales force. You can also build a channel of qualified resellers, consultants or resellers. The size of the market and your price will probably dictate which scenario is best.
- If the buying process is fairly straightforward, you can sell direct via a website/catalog or perhaps through a wholesale/retail structure. You may also use an inbound telemarketing group or a field sales team.
- If you need complete control over your product’s delivery and service, adding a channel probably isn’t right for you.
Identify natural partners
If you want to grow beyond the direct model, look for companies that have relationships with your end-users. If consultants, wholesalers or retailers already reach your customer base, they’re natural partners.
Build your channel
If you’re setting up a distribution channel with one or more partners, treat it as a sales process:
- Approach the potential channel partner and “sell” the value of the partnership
- Establish goals, service requirements and reporting requirements
- Deliver inventory (if necessary) and sales/support materials
- Train the partner
- Run promotions and programs to support the partner and help them increase sales
Minimize pricing conflicts
If you use multiple channels, carefully map out the price for each step in your channel and include a fair profit for each type of partner. Then compare the price that the end-user will pay; if a customer can buy from one channel at a lower price than another, your partners will rightfully have concerns. Pricing conflict is common but it can jeopardize your entire strategy, so do your best to map out the price at each step and develop the best solution possible.
Drive revenue through the channel
Service your channel partners as you’d service your best customers and work with them to drive revenue. For example, provide them with marketing funds or materials to promote your products; run campaigns to generate leads and forward them to your partners.
Brand Strategy
What is a brand? Is it a logo? A name or slogan? A graphic design or color scheme?
Your brand is the entire experience your prospects and customers have with your company. It’s what you stand for, a promise you make, and the personality you convey. And while it includes your logo, color palette and slogan, those are only creative elements that convey your brand. Instead, your brand lives in every day-t0-day interaction you have with your market:
- The images you convey
- The messages you deliver on your website, proposals and sales materials
- The way your employees interact with customers
- A customer’s opinion of you versus your competition
Branding is crucial for products and services sold in huge consumer markets. It’s also important in B2B because it helps you stand out from your competition. It brings your competitive position and value proposition to life; it positions you as a certain “something” in the mind of your prospects and customers. Your brand consistently and repeatedly tells your prospects and customers why they should buy from you.
Think about successful consumer brands like Disney, Tiffany or Starbucks. You probably know what each brand represents. Now imagine that you’re competing against one of these companies. If you want to capture significant market share, start with a strong and unique brand identity or you may not get far.
In your industry, there may or may not be a strong B2B brand. But when you put two companies up against each other, the one that represents something valuable will have an easier time reaching, engaging, closing and retaining customers. A strong brand strategy can be a big advantage.
Successful branding also creates “brand equity” – the amount of money that customers are willing to pay just because it’s your brand. In addition to generating revenue, brand equity makes your company itself more valuable over the long term.
By defining your brand strategy and using it in every interaction with your market, you strengthen your messages and relationships.
Best Case | Neutral Case | Worst Case |
Prospects and customers know exactly what you deliver. It’s easy to begin dialogue with new prospects because they quickly understand what you stand for. You close deals more quickly because your prospects’ experience with you supports everything you say. You can charge a premium because your market knows why you’re better and is willing to pay for it. | The market may not have a consistent view or impression of your product and company, but in general you think it’s positive. You haven’t thought a lot about branding because it doesn’t necessarily seem relevant, but you admit that you can do a better job of communicating consistently with the market. You’re not helping yourself but you’re not hurting yourself either. | You don’t have a brand strategy and it shows. It’s more difficult to communicate with prospects and convince them to buy. They don’t have an impression of your product or why it’s better. What you do, what you say and how you say it may contradict each other and confuse your prospects. Competitors who communicate more strongly have a better shot at talking with and closing your prospective customers. |
Key concepts & steps
Before you begin
Before working on your brand strategy, make sure you’ve identified your competitive positioning strategy – your brand strategy will bring it to life.
If you have a brand strategy, make sure it’s as effective as possible
- Poll your customers, employees and vendors. Are their impressions consistent with your strategy? If not, work on the elements you can improve.
Develop your brand strategy around emotional benefits
- List the features and benefits of your product / service. A feature is an attribute – a color, a configuration; a benefit is what that feature does for the customer.
- Determine which benefits are most important to each of your customer segments.
- Identify which benefits are emotional – the most powerful brand strategies tap into emotions, even among business buyers.
- Look at the emotional benefits and boil them down to one thing that your customers should think of when they think of you. That’s what your brand should represent.
Define your brand
- Think of your brand as a person with a distinct personality. Describe him or her, then convey these traits in everything you do and create.
- Write positioning statements and a story about your brand; use them throughout your company materials.
- Choose colors, fonts and other visual elements that match your personality.
- Determine how your employees will interact with prospects and customers to convey the personality and make sure your brand “lives” within your company.
Sales Process
How do prospects buy your product or service? Does a single decisionmaker find a product and buy on the spot, or does s/he go through many steps and approvals first? Perhaps there are multiple departments involved in the decision, each with its own needs?
A sales process is a defined series of steps you follow as you guide prospects from initial contact to purchase. It begins when you first identify a new prospect:
STEP 1 | STEP 2 | STEP 3 | STEP 4 | STEP 5 |
A prospect responds to a campaign & requests information | A sales rep calls the prospect to explain your product | In-person meeting & product demo | Your team submits a proposal | Prospect signs an agreement & makes first payment |
A documented sales process is a flowchart that explains
- Each distinct step a prospect takes
- Knowledge the prospect needs to move to the next step
- Literature & tools you can provide to help the prospect move forward
- Length of time a prospect needs at each step
- Conversion rates: the percentage of prospects who move from one step to the next
With a documented sales process, you have a powerful tool that enables you to
- Sell more efficiently
- Generate more accurate sales and revenue reports
- Estimate the revenue and return on investment (ROI) of your marketing campaigns
- See which stages take the most time and find ways to move prospects forward
- Create better literature and tools
- Improve your campaigns
- Minimize the amount of time your reps spend on estimates and forecasts
Do you see your company in one of these scenarios?
Best Case | Neutral Case | Worst Case |
You have a well-designed process that measures the number of prospects you have at each stage, how long they stay in each stage, and the revenue your entire pipeline represents. You deliver the right amount of information prospects need at each step, which helps them make decisions more quickly and move to the next stage.You use your sales process to create more successful marketing campaigns because you can predict how many leads will become customers and what those leads will be worth to your company. | You may or may not have a defined sales process. You generally follow the same steps to close a customer, but there’s a big variance in the amount of time it takes to close. In fact, even your strongest reps have trouble closing certain types of prospects. Your forecasts are probably all manual and generally accurate, but you wish you had a thorough snapshot to show exactly how many accounts are at a certain stage and what you need to do to close. | You don’t have a process or use one that doesn’t match how prospects want to buy.You deliver all of the information about your product but then seem to lose control of the prospect. Some prospects end up buying, but you don’t know why the others don’t.It’s a constant battle to figure out how many real prospects you have and what they’re worth. Your sales team often spends valuable time creating manual reports instead of selling, which further hurts your revenue. |
Key concepts & steps
Before you begin
If you don’t have a defined sales process, it’s a valuable investment that can improve your entire sales and marketing program. Create processes for each distribution channel, product and/or customer segment.
Determine how your prospects buy
List the steps you think prospects logically take from the time they recognize a problem to the time they buy. Talk with customers or ask your sales reps for more insight. Figure out what steps they take, what they need to know and how you can deliver that information most effectively.
Create your process
For each step your prospects need to take, list
- What the prospect needs to learn
- Literature & tools you can provide to help the prospect move forward
- The length of time a prospect needs at the step
- The percentage of prospects who move from each step to the next (your “conversion rate”)
Project campaign results & revenue
When you have a sales process with conversion rates, you can generate solid pipeline and revenue reports. For example, if you have 50 prospects at the presentation stage, your process may show that 20% will become customers. That means those 50 prospects should deliver 10 new customers. Your process will also tell you when that should happen and how much revenue those prospect represent.
You can use a similar calculation to project results from new marketing campaigns. For example, if a campaign should produce 100 qualified leads, you can estimate the number of meetings, presentations, and new customers the campaign will generate.
Improve your process to maximize revenue
When you have a defined process, it’s easier to test ideas for improving results. For example, you can
- Identify spots where prospects get “stuck” in the process and try new materials or messages to help them move forward
- Measure how well different reps convert at each step and help those that aren’t doing as well
- See how leads from different marketing campaigns convert and improve your campaigns
- Create campaigns to “recycle” leads that fall out of the process at various spots
What’s next?
After you’ve documented your sales process, develop the sales literature & tools you’ll need to guide your prospects through each step. Add your process to your customer relationship management (CRM) software so that each account is assigned to a stage at all times. Then you can run reports and measure your progress and improve your sales management.
You’ll also use your sales process to measure the success of your marketing campaigns; for a specific campaign, you can see how many leads entered the process and made it to each step.
Print advertising
How to get the most from a print ad
in Print advertising
Even though all the hype has been around social media and digital marketing for the last few years, print advertising is still effective and an important part of most B2B and B2C marketing campaigns.
If you’re planning a campaign in a trade publication this summer or fall, here are a few tips to increase your response rates and results.
1. Make sure the ad has a strong headline and call-to-action. What’s the one thing you want to convey and what do you want prospects to do next? Make sure these two elements are strong and clear.
2. Stir up some emotion. The most powerful buying triggers are emotional benefits. Success and admiration can be strong motivators for business buyers. So is fear — fear of failure, being beaten by the competition, etc. Your messaging should focus on emotional benefits and how your product delivers them. To achieve this goal, you really need to know your audience.
3. Speak to your audience. Going beyond #2, design your entire ad to grab attention and appeal to your target audience. Consider your headline, copy, photography, typeface and layout. If your target audience is C-levels, your ad should be eye-catching and communicate the benefit in the headline or image – a C-level cares about results and is less likely to read the rest of the ad than, say, an IT manager or technician who will need some degree of detail before responding.
Also, if your product or service is new to a particular audience, pay special attention not to use jargon or industry lingo.
4. Building on #3, don’t dump all the information about your product or service into your ad. Usually this isn’t the time to list all of your features & benefits. Give prospects just enough information to grab attention, feel pain and identify with the problem, then contact you for your solution.
5. Treat the other ads as competitors. The average American is exposed to 1,000+ messages per day. And the print publication is probably full of ads and articles that are competing for the attention of your prospects. How large are other ads? Full color or spot color? Photography or heavy copy? Size up the competition and make sure your ad stands out.
6. Make it easy for prospects to contact you and get the exact information they want. If you only provide a phone number or a generic URL, you’re going to lose valuable prospects – not everyone will be ready to pick up the phone, and it can be tough to find specific answers from your home page. Instead, provide a URL to a unique landing page that focuses on converting prospects for this particular campaign. Use a phone number to a specific sales rep or a group that can help on the spot. And include an email address to a spam-protected email address.
7. Be scrupulous with your proof. A typo or poor grammar can damage your credibility and wash your investment down the drain. And pay special attention to your contact information – it should be large, legible and correct. Dial the phone number directly off your ad proof – do it several times to make sure it’s correct. Do the same with the email and URL. A mistake here will ruin your response.
8. Make sure your offer will generate qualified leads. You don’t want to artificially create a lot of sales appointments that will inundate the sales force with unqualified leads. Remember, it’s not necessarily the response rate that matters – it’s the return on your investment. Focus on driving profitable revenue, not just a long list of names for your database.
Below is one of our tools that can help you evaluate and buy print media.
Online Advertising
Internet marketing isn’t just for consumer marketers or large B2B firms – it’s a powerful vehicle for companies of all sizes.
Online advertising offers B2B marketers an opportunity to reach very broad or very targeted prospects to generate leads, communicate a message and raise visibility. In the Marketing M.O., the term “online advertising” refers to three general types of campaigns:
- Banner ad campaigns on B2B websites
- Ads or sponsored content on targeted email newsletters
- Affiliate programs that enable other companies to put your ads on their sites in return for commission on clicks or sales
While a B2B marketer has a smaller universe of prospects than a consumer marketer, the value of each prospect is typically far greater. With a targeted campaign and a good offer, you may only need to generate a handful of highly qualified prospects to generate substantial revenue.
Here are three different online ad campaigns:
GENERATE NEW LEADS | DIRECT SALES | INCREASE YOUR VISIBILITY |
Promote a white paper, webinar or demo that can help prospects who are in the early phases of their research. Drive them to a special landing page; provide details about the offer and capture key pieces of data so you can follow up when the prospect is ready. | Run ads to sell a particular product or service. Drive prospects to a special landing page that describes your offer in detail; if you need to provide additional information, create supplemental pages as needed. Really focus on converting those prospects into sales. | Run a campaign to share a message, promote an event or offer, or raise awareness about your products. Your goal is twofold: Drive click-throughs and generate awareness. Use landing pages designed to convert a visitor into a prospect or customer. |
What are the benefits of online advertising?
- Timing: Reach businesspeople when they’re actively looking for information, vendors and solutions.
- Immediacy: You can test and launch very quickly and generate response almost immediately.
- Targeting: You can deliver your message to very specific audiences.
- Lead generation and nurturing: You can capture prospects early, provide valuable information, and nurture them throughout the sales process.
- Cost: You can reach a large audience quickly and at a lower cost than many other media.
- Scalability: You can run campaigns of any size at any budget level.
As with any marketing program, it’s important to develop a good strategy, target your audience, test, measure and improve – especially because it’s easy and inexpensive to test different aspects of your campaigns to generate the best possible results.
Best Case | Neutral Case | Worst Case |
Your online ad campaigns are a strong element in your marketing mix. You use them to generate prospects and customers, but gaining visibility is also important. You calculate ROI so you can compare the return of these investments versus your other programs. You continually test your ads and landing pages to maximize your response rates. | You run campaigns periodically and they’re moderately successful. Prices are high, but you reach a targeted audience. You occasionally test and tweak your ads, but it isn’t a priority. | You’ve advertised on a few sites and generated some traffic, but you don’t have data to indicate whether your campaigns are successful beyond initial visits. You don’t create special landing pages – you drive visitors to your home page, and you rarely test your ads. You cringe at the prices for the sites you’d really like to use, and you think you’re wasting money since you’re paying for impressions not clicks. |
Key concepts & steps
Before you begin
Before you launch an online campaign, it’s important to have a good website that can measure your traffic and convert visitors to prospects or customers. It’s also helpful to address your online campaigns in your annual marketing plan and budget.
Develop a tangible goal
For example, determine how many click-through or leads you need to generate, then estimate your response rates to figure out how many impressions you’ll need. Make sure you know how you’ll measure your campaign as well.
Target your audience
Profile and target your audience. You can reach a large audience with your ad, but that doesn’t mean you should – narrow targeting means you can speak more directly to their needs.
Create a good offer and compelling call-to-action
Your ad needs to generate interest and get people to click through to your website to learn more – give them a reason, a benefit. Keep your message simple and clear.
Focus on conversion
When you run a great ad, continue the message and momentum on your website. Don’t drive prospects to your home page; instead, create unique landing pages that focus on the topic you used to generate their interest. Focus and sell!
Continually test, refine and improve
It’s easy and inexpensive to test your online campaigns. You can test the offer, the design of your ad, the size and location of the ad, or the sites you choose. Start with the element that’s most important – for example, the offer – and create two versions of the ad. Then run them against each other to see which performs best.
When you keep testing in this way, you can greatly increase your response over time – and that can mean a substantial increase in the number of qualified leads and new customers you generate.
What’s next?
Keep refining your online campaigns and your websiteto drive and convert traffic.
Introduction to Marketing Research
- Lesson
- Exercise
- Answer
Market research and marketing research are often confused. ‘Market’ research is simply research into a specific market. It is a very narrow concept. ‘Marketing’ research is much broader. It not only includes ‘market’ research, but also areas such as research into new products, or modes of distribution such as via the Internet. Here are a couple of definitions:
“Marketing research is the function that links the consumer, customer, and public to the marketer through information – information used to identify and define marketing opportunities and problems; generate, refine, and evaluate marketing actions; monitor marketing performance; and improve understanding of marketing as a process. Marketing research specifies the information required to address these issues, designs the methods for collecting information, manages and implements the data collection process, analyzes, and communicates the findings and their implications.”
Obviously, this is a very long and involved definition of marketing research.
“Marketing research is about researching the whole of a company’s marketing process.”
Palmer (2000).
This explanation is far more straightforward i.e. marketing research into the elements of the marketing mix, competitors, markets, and everything to do with the customers.
The Marketing research Process.
Marketing research is gathered using a systematic approach. An example of one follows:
1. Define the problem. Never conduct research for things that you would ‘like’ to know. Make sure that you really ‘need’ to know something. The problem then becomes the focus of the research. For example, why are sales falling in New Zealand?
2. How will you collect the data that you will analyze to solve your problem? Do we conduct a telephone survey, or do we arrange a focus group? The methods of data collection will be discussed in more detail later.
3. Select a sampling method. Do we us a random sample, stratified sample, or cluster sample?
4. How will we analyze any data collected? What software will we use? What degree of accuracy is required?
5. Decide upon a budget and a timeframe.
6. Go back and speak to the managers or clients requesting the research. Make sure that you agree on the problem! If you gain approval, then move on to step seven. 7. Go ahead and collect the data.
8. Conduct the analysis of the data.
9. Check for errors. It is not uncommon to find errors in sampling, data collection method, or analytic mistakes.
10. Write your final report. This will contain charts, tables, and diagrams that will communicate the results of the research, and hopefully lead to a solution to your problem. Watch out for errors in interpretation.
Sources of Data – Primary and Secondary
There are two main sources of data – primary and secondary. primary research is conducted from scratch. It is original and collected to solve the problem in hand. secondary research, also known as desk research, already exists since it has been collected for other purposes.
We have given a general introduction to marketing research. Marketing research is a huge topic area and has many processes, procedures, and terminologies that build upon the points above. (See also lesson on primary marketing research and secondary marketing research).
Marketing research
Marketing research is the systematic gathering, recording, and analysis of data about issues relating to marketing products and services. The goal of marketing research is to identify and assess how changing elements of the marketing mix impacts customer behavior. The term is commonly interchanged with market research; however, expert practitioners may wish to draw a distinction, in that market research is concerned specifically with markets, while marketing research is concerned specifically about marketing processes.[1]
Marketing research is often partitioned into two sets of categorical pairs, either by target market:
- Consumer marketing research, and
- Business-to-business (B2B) marketing research
Or, alternatively, by methodological approach:
- Qualitative marketing research, and
- Quantitative marketing research
Consumer marketing research is a form of applied sociology that concentrates on understanding the preferences, attitudes, and behaviors of consumers in a market-based economy, and it aims to understand the effects and comparative success of marketing campaigns. The field of consumer marketing research as a statistical science was pioneered by Arthur Nielsen with the founding of the ACNielsenCompany in 1923.
Thus, marketing research may also be described as the systematic and objective identification, collection, analysis, and dissemination of information for the purpose of assisting management in decision making related to the identification and solution of problems and opportunities in marketing.
Role of marketing research (MR)
The task of marketing research (MR) is to provide management with relevant, accurate, reliable, valid, and current information. Competitive marketing environment and the ever-increasing costs attributed to poor decision making require that marketing research provide sound information. Sound decisions are not based on gut feeling, intuition, or even pure judgment.
Marketing managers make numerous strategic and tactical decisions in the process of identifying and satisfying customer needs. They make decisions about potential opportunities, target market selection, market segmentation, planning and implementing marketing programs, marketing performance, and control. These decisions are complicated by interactions between the controllable marketing variables of product, pricing, promotion, and distribution. Further complications are added by uncontrollable environmental factors such as general economic conditions, technology, public policies and laws, political environment, competition, and social and cultural changes. Another factor in this mix is the complexity of consumers. Marketing research helps the marketing manager link the marketing variables with the environment and the consumers. It helps remove some of the uncertainty by providing relevant information about the marketing variables, environment, and consumers. In the absence of relevant information, consumers’ response to marketing programs cannot be predicted reliably or accurately. Ongoing marketing research programs provide information on controllable and non-controllable factors and consumers; this information enhances the effectiveness of decisions made by marketing managers.[4]
Traditionally, marketing researchers were responsible for providing the relevant information and marketing decisions were made by the managers. However, the roles are changing and marketing researchers are becoming more involved in decision making, whereas marketing managers are becoming more involved with research. The role of marketing research in managerial decision making is explained further using the framework of the “DECIDE” model:
D
Define the marketing problem
E
Enumerate the controllable and uncontrollable decision factors
C
Collect relevant information
I
Identify the best alternative
D
Develop and implement a marketing plan
E
Evaluate the decision and the decision process
The DECIDE model conceptualizes managerial decision making as a series of six steps. The decision process begins by precisely defining the problem or opportunity, along with the objectives and constraints.[4] Next, the possible decision factors that make up the alternative courses of action (controllable factors) and uncertainties (uncontrollable factors) are enumerated. Then, relevant information on the alternatives and possible outcomes is collected. The next step is to select the best alternative based on chosen criteria or measures of success. Then a detailed plan to implement the alternative selected is developed and put into effect. Last, the outcome of the decision and the decision process itself are evaluated.
Marketing research characteristics
First, marketing research is systematic. Thus systematic planning is required at all the stages of the marketing research process. The procedures followed at each stage are methodologically sound, well documented, and, as much as possible, planned in advance. Marketing research uses the scientific method in that data are collected and analyzed to test prior notions or hypotheses.
Marketing research is objective. It attempts to provide accurate information that reflects a true state of affairs. It should be conducted impartially. While research is always influenced by the researcher’s research philosophy, it should be free from the personal or political biases of the researcher or the management. Research which is motivated by personal or political gain involves a breach of professional standards. Such research is deliberately biased so as to result in predetermined findings. The motto of every researcher should be, “Find it and tell it like it is.” The objective nature of marketing research underscores the importance of ethical considerations.
Comparison with other forms of business research
Other forms of business research include:
- Market research is broader in scope and examines all aspects of a business environment. It asks questions about competitors, market structure, government regulations, economic trends, technological advances, and numerous other factors that make up the business environment (see environmental scanning). Sometimes the term refers more particularly to the financial analysis of companies, industries, or sectors. In this case, financial analysts usually carry out the research and provide the results to investment advisors and potential investors.
- Product research – This looks at what products can be produced with available technology, and what new product innovations near-future technology can develop (see new product development).
- Advertising research – is a specialized form of marketing research conducted to improve the efficacy of advertising. Copy testing, also known as “pre-testing,” is a form of customized research that predicts in-market performance of an ad before it airs, by analyzing audience levels of attention, brand linkage, motivation, entertainment, and communication, as well as breaking down the ad’s flow of attention and flow of emotion. Pre-testing is also used on ads still in rough (ripomatic or animatic) form. (Young, p. 213)
Classification of marketing research
Organizations engage in marketing research for two reasons: (1) to identify and (2) solve marketing problems. This distinction serves as a basis for classifying marketing research into problem identification research and problem solving research.
Problem identification research is undertaken to help identify problems which are, perhaps, not apparent on the surface and yet exist or are likely to company image, market characteristics, sales analysis, short-range forecasting, long range forecasting, and business trends research. Research of this type provides information about the marketing environment and helps diagnose a problem. For example, The findings of problem solving research are used in making decisions which will solve specific marketing problems.
The Stanford Research Institute, on the other hand, conducts an annual survey of consumers that is used to classify persons into homogeneous groups for segmentation purposes. The National Purchase Diary panel (NPD) maintains the largest diary panel in the United States.
Standardized services are research studies conducted for different client firms but in a standard way. For example, procedures for measuring advertising effectiveness have been standardized so that the results can be compared across studies and evaluative norms can be established. The Starch Readership Survey is the most widely used service for evaluating print advertisements; another well-known service is the Gallup and Robinson Magazine Impact Studies. These services are also sold on a syndicated basis.
- Customized services offer a wide variety of marketing research services customized to suit a client’s specific needs. Each marketing research project is treated uniquely.
- Limited-service suppliers specialize in one or a few phases of the marketing research project. Services offered by such suppliers are classified as field services, coding and data entry, data analysis, analytical services, and branded products. Field services collect data through mail, personal, or telephone interviewing, and firms that specialize in interviewing are called field service organizations. These organizations may range from small proprietary organizations which operate locally to large multinational organizations with WATS line interviewing facilities. Some organizations maintain extensive interviewing facilities across the country for interviewing shoppers in malls.
- Coding and data entry services include editing completed questionnaires, developing a coding scheme, and transcribing the data on to diskettes or magnetic tapes for input into the computer. NRC Data Systems provides such services.
- Analytical services include designing and pretesting questionnaires, determining the best means of collecting data, designing sampling plans, and other aspects of the research design. Some complex marketing research projects require knowledge of sophisticated procedures, including specialized experimental designs, and analytical techniques such as conjoint analysis and multidimensional scaling. This kind of expertise can be obtained from firms and consultants specializing in analytical services.
- Data analysis services are offered by firms, also known as tab houses, that specialize in computer analysis of quantitative data such as those obtained in large surveys. Initially most data analysis firms supplied only tabulations (frequency counts) and cross tabulations (frequency counts that describe two or more variables simultaneously). With the proliferation of software, many firms now have the capability to analyze their own data, but, data analysis firms are still in demand.
- Branded marketing research products and services are specialized data collection and analysis procedures developed to address specific types of marketing research problems. These procedures are patented, given brand names, and marketed like any other branded product.
Types of marketing research
Marketing research techniques come in many forms, including:
- Ad Tracking – periodic or continuous in-market research to monitor a brand’s performance using measures such as brand awareness, brand preference, and product usage. (Young, 2005)
- Advertising Research – used to predict copy testing or track the efficacy of advertisements for any medium, measured by the ad’s ability to get attention (measured with AttentionTracking), communicate the message, build the brand’s image, and motivate the consumer to purchase the product or service. (Young, 2005)
- Brand equity research – how favorably do consumers view the brand?
- Brand association research – what do consumers associate with the brand?
- Brand attribute research – what are the key traits that describe the brand promise?
- Brand name testing – what do consumers feel about the names of the products?
- Commercial eye tracking research – examine advertisements, package designs, websites, etc. by analyzing visual behavior of the consumer
- Concept testing – to test the acceptance of a concept by target consumers
- Coolhunting – to make observations and predictions in changes of new or existing cultural trends in areas such as fashion, music, films, television, youth culture and lifestyle
- Buyer decision processes research – to determine what motivates people to buy and what decision-making process they use
- Copy testing – predicts in-market performance of an ad before it airs by analyzing audience levels of attention, brand linkage, motivation, entertainment, and communication, as well as breaking down the ad’s flow of attention and flow of emotion. (Young, p 213)
- Customer satisfaction research – quantitative or qualitative studies that yields an understanding of a customer’s of satisfaction with a transaction
- Demand estimation – to determine the approximate level of demand for the product
- Distribution channel audits – to assess distributors’ and retailers’ attitudes toward a product, brand, or company
- Internet strategic intelligence – searching for customer opinions in the Internet: chats, forums, web pages, blogs… where people express freely about their experiences with products, becoming strong “opinion formers“
- Marketing effectiveness and analytics – Building models and measuring results to determine the effectiveness of individual marketing activities.
- Mystery Consumer or Mystery shopping – An employee or representative of the market research firm anonymously contacts a salesperson and indicates he or she is shopping for a product. The shopper then records the entire experience. This method is often used for quality control or for researching competitors’ products.
- Positioning research – how does the target market see the brand relative to competitors? – what does the brand stand for?
- Price elasticity testing – to determine how sensitive customers are to price changes
- Sales forecasting – to determine the expected level of sales given the level of demand. With respect to other factors like Advertising expenditure, sales promotion etc.
- Segmentation research – to determine the demographic, psychographic, and behavioural characteristics of potential buyers
- Online panel – a group of individual who accepted to respond to marketing research online
- Store audit – to measure the sales of a product or product line at a statistically selected store sample in order to determine market share, or to determine whether a retail store provides adequate service
- Test marketing – a small-scale product launch used to determine the likely acceptance of the product when it is introduced into a wider market
- Viral Marketing Research – refers to marketing research designed to estimate the probability that specific communications will be transmitted throughout an individual’s Social Network. Estimates of Social Networking Potential (SNP) are combined with estimates of selling effectiveness to estimate ROI on specific combinations of messages and media.
All of these forms of marketing research can be classified as either problem-identification research or as problem-solving research.
There are two main sources of data – primary and secondary. Primary research is conducted from scratch. It is original and collected to solve the problem in hand. Secondary research already exists since it has been collected for other purposes. It is conducted on data published previously and usually by someone else. Secondary research costs far less than primary research, but seldom comes in a form that exactly meets the needs of the researcher.
A similar distinction exists between exploratory research and conclusive research. Exploratory research provides insights into and comprehension of an issue or situation. It should draw definitive conclusions only with extreme caution. Conclusive research draws conclusions: the results of the study can be generalized to the whole population.
Exploratory research is conducted to explore a problem to get some basic idea about the solution at the preliminary stages of research. It may serve as the input to conclusive research. Exploratory research information is collected by focus group interviews, reviewing literature or books, discussing with experts, etc. This is unstructured and qualitative in nature. If a secondary source of data is unable to serve the purpose, a convenience sample of small size can be collected. Conclusive research is conducted to draw some conclusion about the problem. It is essentially, structured and quantitative research, and the output of this research is the input to management information systems (MIS).
Exploratory research is also conducted to simplify the findings of the conclusive or descriptive research, if the findings are very hard to interpret for the marketing managers.
Marketing research methods
Methodologically, marketing research uses the following types of research designs:[5]
Based on questioning:
- Qualitative marketing research – generally used for exploratory purposes – small number of respondents – not generalizable to the whole population – statistical significance and confidence not calculated – examples include focus groups, in-depth interviews, and projective techniques
- Quantitative marketing research – generally used to draw conclusions – tests a specific hypothesis – uses random sampling techniques so as to infer from the sample to the population – involves a large number of respondents – examples include surveys and questionnaires. Techniques include choice modelling, maximum difference preference scaling, and covariance analysis.
Based on observations:
- Ethnographic studies -, by nature qualitative, the researcher observes social phenomena in their natural setting – observations can occur cross-sectionally (observations made at one time) or longitudinally (observations occur over several time-periods) – examples include product-use analysis and computer cookie traces. See also Ethnography and Observational techniques.
- Experimental techniques -, by nature quantitative, the researcher creates a quasi-artificial environment to try to control spurious factors, then manipulates at least one of the variables – examples include purchase laboratories and test markets
Researchers often use more than one research design. They may start with secondary research to get background information, then conduct a focus group (qualitative research design) to explore the issues. Finally they might do a full nation-wide survey (quantitative research design) in order to devise specific recommendations for the client.
Business to business market research
Business to business (B2B) research is inevitably more complicated than consumer research. The researchers need to know what type of multi-faceted approach will answer the objectives, since seldom is it possible to find the answers using just one method. Finding the right respondents is crucial in B2B research since they are often busy, and may not want to participate. Encouraging them to “open up” is yet another skill required of the B2B researcher. Last, but not least, most business research leads to strategic decisions and this means that the business researcher must have expertise in developing strategies that are strongly rooted in the research findings and acceptable to the client.
There are four key factors that make B2B market research special and different to consumer markets:[6]
- The decision making unit is far more complex in B2B markets than in consumer markets
- B2B products and their applications are more complex than consumer products
- B2B marketers address a much smaller number of customers who are very much larger in their consumption of products than is the case in consumer markets
- Personal relationships are of critical importance in B2B markets.
International Marketing Research plan
International Marketing Research follows the same path as domestic research, but there are a few more problems that may arise. Customers in international markets may have very different customs, cultures, and expectations from the same company. In this case, secondary information must be collected from each separate country and then combined, or compared. This is time consuming and can be confusing. International Marketing Research relies more on primary data rather than secondary information. Gathering the primary data can be hindered by language, literacy and access to technology.
Commonly used marketing research terms
Market research techniques resemble those used in political polling and social science research. Meta-analysis (also called the Schmidt-Hunter technique) refers to a statistical method of combining data from multiple studies or from several types of studies. Conceptualization means the process of converting vague mental images into definable concepts. Operationalization is the process of converting concepts into specific observable behaviors that a researcher can measure. Precision refers to the exactness of any given measure. Reliability refers to the likelihood that a given operationalized construct will yield the same results if re-measured. Validity refers to the extent to which a measure provides data that captures the meaning of the operationalized construct as defined in the study. It asks, “Are we measuring what we intended to measure?”
- Applied research sets out to prove a specific hypothesis of value to the clients paying for the research. For example, a cigarette company might commission research that attempts to show that cigarettes are good for one’s health. Many researchers have ethical misgivings about doing applied research.
- Sugging (from “SUG”, for selling under the guise of market research) forms a sales technique in which sales people pretend to conduct marketing research, but with the real purpose of obtaining buyer motivation and buyer decision-making information to be used in a subsequent sales call.
- Frugging comprises the practice of soliciting funds under the pretense of being a research organization.
Selecting a research supplier
A firm that cannot conduct an entire marketing research project in-house must select an external supplier for one or more phases of the project. The firm should compile a list of prospective suppliers from such sources as trade publications, professional directories, and word of mouth. When deciding on criteria for selecting an outside supplier, a firm should ask itself why it is seeking outside marketing research support. For example, a small firm that needs one project investigated may find it economically efficient to employ an outside source. Or a firm may not have the technical expertise undertake certain phases of a project or political conflict-of-interest issues may determine that a project be conducted by an outside supplier.[8]
When developing criteria for selecting an outside supplier, a firm should keep some basics in mind. What is the reputation of the supplier? Do they complete projects on schedule? Are they known for maintaining ethical standards? Are they flexible? Are their research projects of high quality?
What kind and how much experience does the supplier have? Has the firm had experience with projects similar to this one? Do the supplier’s personnel have both technical and nontechnical expertise? In other words, in addition to technical skills, are the personnel assigned to the task sensitive to the client’s needs and do they share the client’s research ideology? Can they communicate well with the client? [8]
The cheapest bid is not always the best one. Competitive bids should be obtained and compared on the basis of quality as well as price. A good practice is to get a written bid or contract before beginning the project. Decisions about marketing research suppliers, just like other management decisions, should be based on sound information.[8]
Careers in marketing research
Some of the positions available in marketing research include vice president of marketing research, research director, assistant director of research, project manager, field work director, statistician/data processing specialist, senior analyst, analyst, junior analyst and operational supervisor.[9]
The most common entry-level position in marketing research for people with bachelor’s degrees (e.g., BBA) is as operational supervisor. These people are responsible for supervising a well-defined set of operations, including field work, data editing, and coding, and may be involved in programming and data analysis. Another entry-level position for BBAs is assistant project manager. An assistant project manager will learn and assist in questionnaire design, review field instructions, and monitor timing and costs of studies. In the marketing research industry, however, there is a growing preference for people with master’s degrees. Those with MBA or equivalent degrees are likely to be employed as project managers.[9]
A small number of business schools also offer a more specialized Master of Marketing Research (MMR) degree. An MMR typically prepares students for a wide range of research methodologies and focuses on learning both in the classroom and the field.
The typical entry-level position in a business firm would be junior research analyst (for BBAs) or research analyst (for MBAs or MMRs). The junior analyst and the research analyst learn about the particular industry and receive training from a senior staff member, usually the marketing research manager. The junior analyst position includes a training program to prepare individuals for the responsibilities of a research analyst, including coordinating with the marketing department and sales force to develop goals for product exposure. The research analyst responsibilities include checking all data for accuracy, comparing and contrasting new research with established norms, and analyzing primary and secondary data for the purpose of market forecasting.
As these job titles indicate, people with a variety of backgrounds and skills are needed in marketing research. Technical specialists such as statisticians obviously need strong backgrounds in statistics and data analysis. Other positions, such as research director, call for managing the work of others and require more general skills. To prepare for a career in marketing research, students usually:
- Take all the marketing courses.
- Take courses in statistics and quantitative methods.
- Acquire computer skills.
- Take courses in psychology and consumer behavior.
- Acquire effective written and verbal communication skills.
- Think creatively.[9]
Career ladder in marketing research:
- Vice-President of Marketing Research: This is the senior position in marketing research. The VP is responsible for the entire marketing research operation of the company and serves on the top management team. Sets the objectives and goals of the marketing, research department.
- Research Director: Also a senior position, the director has the overall responsibility for the development and execution of all the marketing research projects.
- Assistant Director of Research: Serves as an administrative assistant to the director and supervises some of the other marketing research staff members.
- (Senior) Project Manager: Has overall responsibility for design, implementation, and management of research projects.
- Statistician/Data Processing Specialist: Serves as an expert on theory and application of statistical techniques. Responsibilities include experimental design, data processing, and analysis.
- Senior Analyst: Participates in the development of projects and directs the operational execution of the assigned projects. Works closely with the analyst, junior analyst, and other personnel in developing the research design and data collection. Prepares the final report. The primary responsibility for meeting time and cost constraints rests with the senior analyst.
- Analyst: Handles the details involved in executing the project. Designs and pretests the questionnaires and conducts a preliminary analysis of the data.
- Junior Analyst: Handles routine assignments such as secondary data analysis, editing and coding of questionnaires, and simple statistical analysis.
- Field Work Director: Responsible for the selection, training, supervision, and evaluation of interviewers and other field workers.[1
Global marketing
The Oxford University Press defines global marketing as “marketing on a worldwide scale reconciling or taking commercial advantage of global operational differences, similarities and opportunities in order to meet global objectives.” Oxford University Press’ Glossary of Marketing Terms.
Here are three reasons for the shift from domestic to global marketing as given by the authors of the textbook, Global Marketing Management—3rd Edition by Masaaki Kotabe and Kristiaan Helsen, 2004.
Worldwide competition
One of the product categories in which global competition has been easy to track in U.S.is automotive sales. The increasing intensity of competition in global markets is a challenge facing companies at all stages of involvement in international markets. As markets open up, and become more integrated, the pace of change accelerates, technology shrinks distances between markets and reduces the scale advantages of large firms, new sources of competition emerge, and competitive pressures mount at all levels of the organization. Also, the threat of competition from companies in countries such as India, China, Malaysia, and Brazil is on the rise, as their own domestic markets are opening up to foreign competition, stimulating greater awareness of international market opportunities and of the need to be internationally competitive. Companies which previously focused on protected domestic markets are entering into markets in other countries, creating new sources of competition, often targeted to price-sensitive market segments. Not only is competition intensifying for all firms regardless of their degree of global market involvement, but the basis for competition is changing. Competition continues to be market-based and ultimately relies on delivering superior value to consumers. However, success in global markets depends on knowledge accumulation and deployment.[1] tiwana.
Evolution to global marketing
Global marketing is not a revolutionary shift, it is an evolutionary process. While the following does not apply to all companies, it does apply to most companies that begin as domestic-only companies.
Domestic marketing
A marketing restricted to the political boundaries of a country, is called “Domestic Marketing”. A company marketing only within its national boundaries only has to consider domestic competition. Even if that competition includes companies from foreign markets, it still only has to focus on the competition that exists in its home market. Products and services are developed for customers in the home market without thought of how the product or service could be used in other markets. All marketing decisions are made at headquarters.
The biggest obstacle these marketers face is being blindsided by emerging global marketers. Because domestic marketers do not generally focus on the changes in the global marketplace, they may not be aware of a potential competitor who is a market leader on three continents until they simultaneously open 20 stores in the Northeastern U.S. These marketers can be considered ethnocentric as they are most concerned with how they are perceived in their home country. exporting goods to other countries. loosener Rhett
International marketing
If the exporting departments are becoming successful but the costs of doing business from headquarters plus time differences, language barriers, and cultural ignorance are hindering the company’s competitiveness in the foreign market, then offices could be built in the foreign countries. Sometimes companies buy firms in the foreign countries to take advantage of relationships, storefronts, factories, and personnel already in place. These offices still report to headquarters in the home market but most of the marketing mix decisions are made in the individual countries since that staff is the most knowledgeable about the target markets. Local product development is based on the needs of local customers. These marketers are considered polycentric because they acknowledge that each market/country has different needs.
Elements of the global marketing mix
The “Four P’s” of marketing: product, price, placement, and promotion are all affected as a company moves through the five evolutionary phases to become a global company. Ultimately, at the global marketing level, a company trying to speak with one voice is faced with many challenges when creating a worldwide marketing plan. Unless a company holds the same position against its competition in all markets (market leader, low cost, etc.) it is impossible to launch identical marketing plans worldwide. Nisant Chakram(Marketing Management)
Product
A global company is one that can create a single product and only have to tweak elements for different markets. For example, Coca-Cola uses two formulas (one with sugar, one with corn syrup) for all markets. The product packaging in every country incorporates the contour bottle design and the dynamic ribbon in some way, shapes, or form. However, the bottle or can also includes the country’s native language and is the same size as other beverage bottles or cans in that same country.
Price
Price will always vary from market to market. Price is affected by many variables: cost of product development (produced locally or imported), cost of ingredients, cost of delivery (transportation, tariffs, etc.), and much more. Additionally, the product’s position in relation to the competition influences the ultimate profit margin. Whether this product is considered the high-end, expensive choice, the economical, low-cost choice, or something in-between helps determine the price point.
Placement
How the product is distributed is also a country-by-country decision influenced by how the competition is being offered to the target market. Using Coca-Cola as an example again, not all cultures use vending machines. In the United States, beverages are sold by the pallet via warehouse stores. In India, this is not an option. Placement decisions must also consider the product’s position in the market place. For example, a high-end product would not want to be distributed via a “dollar store” in the United States. Conversely, a product promoted as the low-cost option in France would find limited success in a pricey boutique.
Promotion
After product research, development and creation, promotion (specifically advertising) is generally the largest line item in a global company’s marketing budget. At this stage of a company’s development, integrated marketing is the goal. The global corporation seeks to reduce costs, minimize redundancies in personnel and work, maximize speed of implementation, and to speak with one voice. If the goal of a global company is to send the same message worldwide, then delivering that message in a relevant, engaging, and cost-effective way is the challenge.
Effective global advertising techniques do exist. The key is testing advertising ideas using a marketing research system proven to provide results that can be compared across countries. The ability to identify which elements or moments of an ad are contributing to that success is how economies of scale are maximized. Market research measures such as Flow of Attention, Flow of Emotion and branding moments provide insights into what is working in an ad in any country because the measures are based on visual, not verbal, elements of the ad.
Advantages and Disadvantages
Advantages
- The advantages of global market we can introduce our product by using advertising
- Economies of scale in production and distribution
- Lower marketing costs
- Power and scope
- Consistency in brand image
- Ability to leverage good ideas quickly and efficiently
- Uniformity of marketing practices
- Helps to establish relationships outside of the “political arena”
- Helps to encourage ancillary industries to be set up to cater for the needs of the global player
- Benefits of eMarketing over traditional marketing
Reach
The nature of the internet means businesses now have a truly global reach. While traditional media costs limit this kind of reach to huge multinationals, eMarketing opens up new avenues for smaller businesses, on a much smaller budget, to access potential consumers from all over the world.
Scope
Internet marketing allows the marketer to reach consumers in a wide range of ways and enables them to offer a wide range of products and services. eMarketing includes, among other things, information management, public relations, customer service and sales. With the range of new technologies becoming available all the time, this scope can only grow.
Interactivity
Whereas traditional marketing is largely about getting a brand’s message out there, eMarketing facilitates conversations between companies and consumers. With a two way communication channel, companies can feed off of the responses of their consumers, making them more dynamic and adaptive.
Immediacy
Internet marketing is able to, in ways never before imagined, provide an immediate impact. Imagine you’re reading your favorite magazine. You see a double-page advert for some new product or service, maybe BMW’s latest luxury sedan or Apple’s latest iPod offering. With this kind of traditional media, it’s not that easy for you, the consumer, to take the step from hearing about a product to actual acquisition. With eMarketing, it’s easy to make that step as simple as possible, meaning that within a few short clicks you could have booked a test drive or ordered the iPod. And all of this can happen regardless of normal office hours. Effectively, Internet marketing makes business hours 24 hours per day, 7 days per week for every week of the year. By closing the gap between providing information and eliciting a consumer reaction, the consumer’s buying cycle is speeded up and advertising spend can go much further in creating immediate leads.
Demographics and targeting
Generally speaking, the demographics of the Internet are a marketer’s dream. Internet users, considered as a group, have greater buying power and could perhaps be considered as a population group skewed towards the middle-classes. Buying power is not all though. The nature of the Internet is such that its users will tend to organize themselves into far more focused groupings. Savvy marketers who know where to look can quite easily find access to the niche markets they wish to target. Marketing messages are most effective when they are presented directly to the audience most likely to be interested. The Internet creates the perfect environment for niche marketing to targeted groups.
Adaptivity and closed loop marketing
Closed Loop Marketing requires the constant measurement and analysis of the results of marketing initiatives. By continuously tracking the response and effectiveness of a campaign, the marketer can be far more dynamic in adapting to consumers’ wants and needs. With eMarketing, responses can be analyzed in real-time and campaigns can be tweaked continuously. Combined with the immediacy of the Internet as a medium, this means that there’s minimal advertising spend wasted on less than effective campaigns. Maximum marketing efficiency from eMarketing creates new opportunities to seize strategic competitive advantages. The combination of all these factors results in an improved ROI and ultimately, more customers, happier customers and an improved bottom line.
Disadvantages
- Differences in consumer needs, wants, and usage patterns for products
- Differences in consumer response to marketing mix elements
- Differences in brand and product development and the competitive environment
- Differences in the legal environment, some of which may conflict with those of the home market
- Differences in the institutions available, some of which may call for the creation of entirely new ones (e.g. infrastructure)
- Differences in administrative procedures
- Differences in product placement.
- Differences in the administrative procedures and product placement can occur
Marketing Research
Managers need information in order to introduce products and services that create value in the mind of the customer. But the perception of value is a subjective one, and what customers value this year may be quite different from what they value next year. As such, the attributes that create value cannot simply be deduced from common knowledge. Rather, data must be collected and analyzed. The goal of marketing research is to provide the facts and direction that managers need to make their more important marketing decisions.
To maximize the benefit of marketing research, those who use it need to understand the research process and its limitations.
Marketing Research vs. Market Research
These terms often are used interchangeably, but technically there is a difference.
Market research deals specifically with the gathering of information about a market’s size and trends. Marketing research covers a wider range of activities. While it may involve market research, marketing research is a more general systematic process that can be applied to a variety of marketing problems.
The Value of Information
Information can be useful, but what determines its real value to the organization? In general, the value of information is determined by:
- The ability and willingness to act on the information.
- The accuracy of the information.
- The level of indecisiveness that would exist without the information.
- The amount of variation in the possible results.
- The level of risk aversion.
- The reaction of competitors to any decision improved by the information.
- The cost of the information in terms of time and money.
The Marketing Research Process
Once the need for marketing research has been established, most marketing research projects involve these steps:
- Define the problem
- Determine research design
- Identify data types and sources
- Design data collection forms and questionnaires
- Determine sample plan and size
- Collect the data
- Analyze and interpret the data
- Prepare the research report
Problem Definition
The decision problem faced by management must be translated into a market research problem in the form of questions that define the information that is required to make the decision and how this information can be obtained. Thus, the decision problem is translated into a research problem. For example, a decision problem may be whether to launch a new product. The corresponding research problem might be to assess whether the market would accept the new product.
The objective of the research should be defined clearly. To ensure that the true decision problem is addressed, it is useful for the researcher to outline possible scenarios of the research results and then for the decision maker to formulate plans of action under each scenario. The use of such scenarios can ensure that the purpose of the research is agreed upon before it commences.
Research Design
Marketing research can classified in one of three categories:
- Exploratory research
- Descriptive research
- Causal research
These classifications are made according to the objective of the research. In some cases the research will fall into one of these categories, but in other cases different phases of the same research project will fall into different categories.
- Exploratory research has the goal of formulating problems more precisely, clarifying concepts, gathering explanations, gaining insight, eliminating impractical ideas, and forming hypotheses. Exploratory research can be performed using a literature search, surveying certain people about their experiences, focus groups, and case studies. When surveying people, exploratory research studies would not try to acquire a representative sample, but rather, seek to interview those who are knowledgeable and who might be able to provide insight concerning the relationship among variables. Case studies can include contrasting situations or benchmarking against an organization known for its excellence. Exploratory research may develop hypotheses, but it does not seek to test them. Exploratory research is characterized by its flexibility.
- Descriptive research is more rigid than exploratory research and seeks to describe users of a product, determine the proportion of the population that uses a product, or predict future demand for a product. As opposed to exploratory research, descriptive research should define questions, people surveyed, and the method of analysis prior to beginning data collection. In other words, the who, what, where, when, why, and how aspects of the research should be defined. Such preparation allows one the opportunity to make any required changes before the costly process of data collection has begun.
There are two basic types of descriptive research: longitudinal studies and cross-sectional studies. Longitudinal studies are time series analyses that make repeated measurements of the same individuals, thus allowing one to monitor behavior such as brand-switching. However, longitudinal studies are not necessarily representative since many people may refuse to participate because of the commitment required. Cross-sectional studies sample the population to make measurements at a specific point in time. A special type of cross-sectional analysis is a cohort analysis, which tracks an aggregate of individuals who experience the same event within the same time interval over time. Cohort analyses are useful for long-term forecasting of product demand.
- Causal research seeks to find cause and effect relationships between variables. It accomplishes this goal through laboratory and field experiments.
Data Types and Sources
Secondary Data
Before going through the time and expense of collecting primary data, one should check for secondary data that previously may have been collected for other purposes but that can be used in the immediate study. Secondary data may be internal to the firm, such as sales invoices and warranty cards, or may be external to the firm such as published data or commercially available data. The government census is a valuable source of secondary data.
Secondary data has the advantage of saving time and reducing data gathering costs. The disadvantages are that the data may not fit the problem perfectly and that the accuracy may be more difficult to verify for secondary data than for primary data.
Some secondary data is republished by organizations other than the original source. Because errors can occur and important explanations may be missing in republished data, one should obtain secondary data directly from its source. One also should consider who the source is and whether the results may be biased.
There are several criteria that one should use to evaluate secondary data.
- Whether the data is useful in the research study.
- How current the data is and whether it applies to time period of interest.
- Errors and accuracy – whether the data is dependable and can be verified.
- Presence of bias in the data.
- Specifications and methodologies used, including data collection method, response rate, quality and analysis of the data, sample size and sampling technique, and questionnaire design.
- Objective of the original data collection.
- Nature of the data, including definition of variables, units of measure, categories used, and relationships examined.
Primary Data
Often, secondary data must be supplemented by primary data originated specifically for the study at hand. Some common types of primary data are:
- demographic and socioeconomic characteristics
- psychological and lifestyle characteristics
- attitudes and opinions
- awareness and knowledge – for example, brand awareness
- intentions – for example, purchase intentions. While useful, intentions are not a reliable indication of actual future behavior.
- motivation – a person’s motives are more stable than his/her behavior, so motive is a better predictor of future behavior than is past behavior.
- behavior
Primary data can be obtained by communication or by observation. Communication involves questioning respondents either verbally or in writing. This method is versatile, since one needs only to ask for the information; however, the response may not be accurate. Communication usually is quicker and cheaper than observation. Observation involves the recording of actions and is performed by either a person or some mechanical or electronic device. Observation is less versatile than communication since some attributes of a person may not be readily observable, such as attitudes, awareness, knowledge, intentions, and motivation. Observation also might take longer since observers may have to wait for appropriate events to occur, though observation using scanner data might be quicker and more cost effective. Observation typically is more accurate than communication.
Personal interviews have an interviewer bias that mail-in questionnaires do not have. For example, in a personal interview the respondent’s perception of the interviewer may affect the responses.
Questionnaire Design
The questionnaire is an important tool for gathering primary data. Poorly constructed questions can result in large errors and invalidate the research data, so significant effort should be put into the questionnaire design. The questionnaire should be tested thoroughly prior to conducting the survey.
Measurement Scales
Attributes can be measured on nominal, ordinal, interval, and ratio scales:
- Nominal numbers are simply identifiers, with the only permissible mathematical use being for counting. Example: social security numbers.
- Ordinal scales are used for ranking. The interval between the numbers conveys no meaning. Median and mode calculations can be performed on ordinal numbers. Example: class ranking
- Interval scales maintain an equal interval between numbers. These scales can be used for ranking and for measuring the interval between two numbers. Since the zero point is arbitrary, ratios cannot be taken between numbers on an interval scale; however, mean, median, and mode are all valid. Example: temperature scale
- Ratio scales are referenced to an absolute zero values, so ratios between numbers on the scale are meaningful. In addition to mean, median, and mode, geometric averages also are valid. Example: weight
Validity and Reliability
The validity of a test is the extent to which differences in scores reflect differences in the measured characteristic. Predictive validity is a measure of the usefulness of a measuring instrument as a predictor. Proof of predictive validity is determined by the correlation between results and actual behavior. Construct validity is the extent to which a measuring instrument measures what it intends to measure.
Reliability is the extent to which a measurement is repeatable with the same results. A measurement may be reliable and not valid. However, if a measurement is valid, then it also is reliable and if it is not reliable, then it cannot be valid. One way to show reliability is to show stability by repeating the test with the same results.
Attitude Measurement
Many of the questions in a marketing research survey are designed to measure attitudes. Attitudes are a person’s general evaluation of something. Customer attitude is an important factor for the following reasons:
- Attitude helps to explain how ready one is to do something.
- Attitudes do not change much over time.
- Attitudes produce consistency in behavior.
- Attitudes can be related to preferences.
Attitudes can be measured using the following procedures:
- Self-reporting – subjects are asked directly about their attitudes. Self-reporting is the most common technique used to measure attitude.
- Observation of behavior – assuming that one’s behavior is a result of one’s attitudes, attitudes can be inferred by observing behavior. For example, one’s attitude about an issue can be inferred by whether he/she signs a petition related to it.
- Indirect techniques – use unstructured stimuli such as word association tests.
- Performance of objective tasks – assumes that one’s performance depends on attitude. For example, the subject can be asked to memorize the arguments of both sides of an issue. He/she is more likely to do a better job on the arguments that favor his/her stance.
- Physiological reactions – subject’s response to a stimuli is measured using electronic or mechanical means. While the intensity can be measured, it is difficult to know if the attitude is positive or negative.
- Multiple measures – a mixture of techniques can be used to validate the findings, especially worthwhile when self-reporting is used.
There are several types of attitude rating scales:
- Equal-appearing interval scaling – a set of statements are assembled. These statements are selected according to their position on an interval scale of favorableness. Statements are chosen that has a small degree of dispersion. Respondents then are asked to indicate with which statements they agree.
- Likert method of summated ratings – a statement is made and the respondents indicate their degree of agreement or disagreement on a five point scale (Strongly Disagree, Disagree, Neither Agree Nor Disagree, Agree, Strongly Agree).
- Semantic differential scale – a scale is constructed using phrases describing attributes of the product to anchor each end. For example, the left end may state, “Hours are inconvenient” and the right end may state, “Hours are convenient”. The respondent then marks one of the seven blanks between the statements to indicate his/her opinion about the attribute.
- Stapel Scale – similar to the semantic differential scale except that 1) points on the scale are identified by numbers, 2) only one statement is used and if the respondent disagrees a negative number should marked, and 3) there are 10 positions instead of seven. This scale does not require that bipolar adjectives be developed and it can be administered by telephone.
- Q-sort technique – the respondent if forced to construct a normal distribution by placing a specified number of cards in one of 11 stacks according to how desirable he/she finds the characteristics written on the cards.
Sampling Plan
The sampling frame is the pool from which the interviewees are chosen. The telephone book often is used as a sampling frame, but have some shortcomings. Telephone books exclude those households that do not have telephones and those households with unlisted numbers. Since a certain percentage of the numbers listed in a phone book are out of service, there are many people who have just moved who are not sampled. Such sampling biases can be overcome by using random digit dialing. Mall intercepts represent another sampling frame, though there are many people who do not shop at malls and those who shop more often will be over-represented unless their answers are weighted in inverse proportion to their frequency of mall shopping.
In designing the research study, one should consider the potential errors. Two sources of errors are random sampling error and non-sampling error. Sampling errors are those due to the fact that there is a non-zero confidence interval of the results because of the sample size being less than the population being studied. Non-sampling errors are those caused by faulty coding, untruthful responses, respondent fatigue, etc.
There is a tradeoff between sample size and cost. The larger the sample size, the smaller the sampling error but the higher the cost. After a certain point the smaller sampling error cannot be justified by the additional cost.
While a larger sample size may reduce sampling error, it actually may increase the total error. There are two reasons for this effect. First, a larger sample size may reduce the ability to follow up on non-responses. Second, even if there is a sufficient number of interviewers for follow-ups, a larger number of interviewers may result in a less uniform interview process.
Data Collection
In addition to the intrinsic sampling error, the actual data collection process will introduce additional errors. These errors are called non-sampling errors. Some non-sampling errors may be intentional on the part of the interviewer, who may introduce a bias by leading the respondent to provide a certain response. The interviewer also may introduce unintentional errors, for example, due to not having a clear understanding of the interview process or due to fatigue.
Respondents also may introduce errors. A respondent may introduce intentional errors by lying or simply by not responding to a question. A respondent may introduce unintentional errors by not understanding the question, guessing, not paying close attention, and being fatigued or distracted.
Such non-sampling errors can be reduced through quality control techniques.Data Analysis – Preliminary Steps
Before analysis can be performed, raw data must be transformed into the right format. First, it must be edited so that errors can be corrected or omitted. The data must then be coded; this procedure converts the edited raw data into numbers or symbols. A codebook is created to document how the data was coded. Finally, the data is tabulated to count the number of samples falling into various categories. Simple tabulations count the occurrences of each variable independently of the other variables. Cross tabulations, also known as contingency tables or cross tabs, treats two or more variables simultaneously. However, since the variables are in a two-dimensional table, cross tabbing more than two variables is difficult to visualize since more than two dimensions would be required. Cross tabulation can be performed for nominal and ordinal variables.
Cross tabulation is the most commonly utilized data analysis method in marketing research. Many studies take the analysis no further than cross tabulation. This technique divides the sample into sub-groups to show how the dependent variable varies from one subgroup to another. A third variable can be introduced to uncover a relationship that initially was not evident.
Conjoint Analysis
The conjoint analysis is a powerful technique for determining consumer preferences for product attributes.
Hypothesis Testing
A basic fact about testing hypotheses is that a hypothesis may be rejected but that the hypothesis never can be unconditionally accepted until all possible evidence is evaluated. In the case of sampled data, the information set cannot be complete. So if a test using such data does not reject a hypothesis, the conclusion is not necessarily that the hypothesis should be accepted.
The null hypothesis in an experiment is the hypothesis that the independent variable has no effect on the dependent variable. The null hypothesis is expressed as H0. This hypothesis is assumed to be true unless proven otherwise. The alternative to the null hypothesis is the hypothesis that the independent variable does have an effect on the dependent variable. This hypothesis is known as the alternative, research, or experimental hypothesis and is expressed as H1. This alternative hypothesis states that the relationship observed between the variables cannot be explained by chance alone.
There are two types of errors in evaluating a hypotheses:
- Type I error: occurs when one rejects the null hypothesis and accepts the alternative, when in fact the null hypothesis is true.
- Type II error: occurs when one accepts the null hypothesis when in fact the null hypothesis is false.
Because their names are not very descriptive, these types of errors sometimes are confused. Some people jokingly define a Type III error to occur when one confuses Type I and Type II. To illustrate the difference, it is useful to consider a trial by jury in which the null hypothesis is that the defendant is innocent. If the jury convicts a truly innocent defendant, a Type I error has occurred. If, on the other hand, the jury declares a truly guilty defendant to be innocent, a Type II error has occurred.
Hypothesis testing involves the following steps:
- Formulate the null and alternative hypotheses.
- Choose the appropriate test.
- Choose a level of significance (alpha) – determine the rejection region.
- Gather the data and calculate the test statistic.
- Determine the probability of the observed value of the test statistic under the null hypothesis given the sampling distribution that applies to the chosen test.
- Compare the value of the test statistic to the rejection threshold.
- Based on the comparison, reject or do not reject the null hypothesis.
- Make the marketing research conclusion.
In order to analyze whether research results are statistically significant or simply by chance, a test of statistical significance can be run.
Tests of Statistical Significance
The chi-square ( c2 ) goodness-of-fit test is used to determine whether a set of proportions have specified numerical values. It often is used to analyze bivariate cross-tabulated data. Some examples of situations that are well-suited for this test are:
- A manufacturer of packaged products test markets a new product and wants to know if sales of the new product will be in the same relative proportion of package sizes as sales of existing products.
- A company’s sales revenue comes from Product A (50%), Product B (30%), and Product C (20%). The firm wants to know whether recent fluctuations in these proportions are random or whether they represent a real shift in sales.
The chi-square test is performed by defining k categories and observing the number of cases falling into each category. Knowing the expected number of cases falling in each category, one can define chi-squared as:
c2 = å ( Oi – Ei )2 / Ei
where
Oi = the number of observed cases in category i,
Ei = the number of expected cases in category i,
k = the number of categories,
the summation runs from i = 1 to i = k.
Before calculating the chi-square value, one needs to determine the expected frequency for each cell. This is done by dividing the number of samples by the number of cells in the table.
To use the output of the chi-square function, one uses a chi-square table. To do so, one needs to know the number of degrees of freedom (df). For chi-square applied to cross-tabulated data, the number of degrees of freedom is equal to
( number of columns – 1 ) ( number of rows – 1 )
This is equal to the number of categories minus one. The conventional critical level of 0.05 normally is used. If the calculated output value from the function is greater than the chi-square look-up table value, the null hypothesis is rejected.
ANOVA
Another test of significance is the Analysis of Variance (ANOVA) test. The primary purpose of ANOVA is to test for differences between multiple means. Whereas the t-test can be used to compare two means, ANOVA is needed to compare three or more means. If multiple t-tests were applied, the probability of a TYPE I error (rejecting a true null hypothesis) increases as the number of comparisons increases.
One-way ANOVA examines whether multiple means differ. The test is called an F-test. ANOVA calculates the ratio of the variation between groups to the variation within groups (the F ratio). While ANOVA was designed for comparing several means, it also can be used to compare two means. Two-way ANOVA allows for a second independent variable and addresses interaction.
To run a one-way ANOVA, use the following steps:
- Identify the independent and dependent variables.
- Describe the variation by breaking it into three parts – the total variation, the portion that is within groups, and the portion that is between groups (or among groups for more than two groups). The total variation (SStotal) is the sum of the squares of the differences between each value and the grand mean of all the values in all the groups. The in-group variation (SSwithin) is the sum of the squares of the differences in each element’s value and the group mean. The variation between group means (SSbetween) is the total variation minus the in-group variation (SStotal – SSwithin).
- Measure the difference between each group’s mean and the grand mean.
- Perform a significance test on the differences.
- Interpret the results.
This F-test assumes that the group variances are approximately equal and that the observations are independent. It also assumes normally distributed data; however, since this is a test on means the Central Limit Theorem holds as long as the sample size is not too small.
ANOVA is efficient for analyzing data using relatively few observations and can be used with categorical variables. Note that regression can perform a similar analysis to that of ANOVA.
Discriminant Analysis
Analysis of the difference in means between groups provides information about individual variables, it is not useful for determine their individual impacts when the variables are used in combination. Since some variables will not be independent from one another, one needs a test that can consider them simultaneously in order to take into account their interrelationship. One such test is to construct a linear combination, essentially a weighted sum of the variables. To determine which variables discriminate between two or more naturally occurring groups, discriminant analysis is used. Discriminant analysis can determine which variables are the best predictors of group membership. It determines which groups differ with respect to the mean of a variable, and then uses that variable to predict new cases of group membership. Essentially, the discriminant function problem is a one-way ANOVA problem in that one can determine whether multiple groups are significantly different from one another with respect to the mean of a particular variable.
A discriminant analysis consists of the following steps:
- Formulate the problem.
- Determine the discriminant function coefficients that result in the highest ratio of between-group variation to within-group variation.
- Test the significance of the discriminant function.
- Interpret the results.
- Determine the validity of the analysis.
Discriminant analysis analyzes the dependency relationship, whereas factor analysis and cluster analysis address the interdependency among variables.
Factor Analysis
Factor analysis is a very popular technique to analyze interdependence. Factor analysis studies the entire set of interrelationships without defining variables to be dependent or independent. Factor analysis combines variables to create a smaller set of factors. Mathematically, a factor is a linear combination of variables. A factor is not directly observable; it is inferred from the variables. The technique identifies underlying structure among the variables, reducing the number of variables to a more manageable set. Factor analysis groups variables according to their correlation.
The factor loading can be defined as the correlations between the factors and their underlying variables. A factor loading matrix is a key output of the factor analysis. An example matrix is shown below.
| Factor 1 | Factor 2 | Factor 3 | |
Variable 1 | |||
Variable 2 | |||
Variable 3 | |||
Column’s Sum of Squares: |
Each cell in the matrix represents correlation between the variable and the factor associated with that cell. The square of this correlation represents the proportion of the variation in the variable explained by the factor. The sum of the squares of the factor loadings in each column is called an eigenvalue. An eigenvalue represents the amount of variance in the original variables that is associated with that factor. The communality is the amount of the variable variance explained by common factors.
A rule of thumb for deciding on the number of factors is that each included factor must explain at least as much variance as does an average variable. In other words, only factors for which the eigenvalue is greater than one are used. Other criteria for determining the number of factors include the Scree plot criteria and the percentage of variance criteria.
To facilitate interpretation, the axis can be rotated. Rotation of the axis is equivalent to forming linear combinations of the factors. A commonly used rotation strategy is the varimax rotation. Varimax attempts to force the column entries to be either close to zero or one.
Cluster Analysis
Market segmentation usually is based not on one factor but on multiple factors. Initially, each variable represents its own cluster. The challenge is to find a way to combine variables so that relatively homogenous clusters can be formed. Such clusters should be internally homogenous and externally heterogeneous. Cluster analysis is one way to accomplish this goal. Rather than being a statistical test, it is more of a collection of algorithms for grouping objects, or in the case of marketing research, grouping people. Cluster analysis is useful in the exploratory phase of research when there are no a-priori hypotheses.
Cluster analysis steps:
- Formulate the problem, collecting data and choosing the variables to analyze.
- Choose a distance measure. The most common is the Euclidean distance. Other possibilities include the squared Euclidean distance, city-block (Manhattan) distance, Chebychev distance, power distance, and percent disagreement.
- Choose a clustering procedure (linkage, nodal, or factor procedures).
- Determine the number of clusters. They should be well separated and ideally they should be distinct enough to give them descriptive names such as professionals, buffs, etc.
- Profile the clusters.
- Assess the validity of the clustering.
Marketing Research Report
The format of the marketing research report varies with the needs of the organization. The report often contains the following sections:
- Authorization letter for the research
- Table of Contents
- List of illustrations
- Executive summary
- Research objectives
- Methodology
- Results
- Limitations
- Conclusions and recommendations
- Appendices containing copies of the questionnaires, etc.
CONCLUSSION
From my survey, I learn that Libra always uses modern technology for manufacturing I.V. Fluid a life saving product. The production is based on imported raw & packing materials our Quality Assurance System ensure full quality control testing in accordance with product requirements Technical support including LAL test, validation and stability studies are available as a part of our commitment to quality. Libra has a experienced dedicated staff members which included pharmacists, chemists, doctors, engineers, accountants and other professionals. Libra’s success depends on sincerity, hard labor and team efforts of employees at all levels. Libra invests in personal and professional development of its employees through training and workshop.