EXECUTIVE SUMMERY
This report has been prepared on the topic “Analyzing the Current Situation of “TANG” as a Brand and Developing its Position”. A research has been done on this topic by preparing a questionnaire and conducting fieldwork with that. The data collected in this way was analyzed by using the SPSS software. A brief description of the whole report is summarized as follows:
Major Findings:
1. The highest number of respondents is thinking that the price is reasonable which is 60% of the total sample surveyed.
2. A considerable amount of respondents certify the Test of tang is good that is 71% of the total sample surveyed.
3. Thirty one respondents certify the packaging as Good among the 45 respondents and that 68% of the total sample.
4. Among the 45 respondents 64% agree that the packaging is perfect for the storage of Tang but a considerable number of respondents disagree that the storage is easy. They are 24% of the total sample surveyed.
5. “The test remains unchanged in hot water” only 29% agreed in contrast 33.3% disagree on the statement and 22.2% do not think that drinking tang in hot water is necessary.
6. Among the 45 sample 30 respondents think that the nutrition in Tang drinks is Average which is 66% of the sample.
7. The most important is that 33% of the samples surveyed think that Tang is competing with its rivals by the test.
8. Finally, from the factor analysis we found that storage friendly packaging, Consistency with the advertisement and the price of the mini pack has grater influence on the purchase decision of Tang by its customer.
Conclusion:
After completing the research to prepare this report on “Analyzing the Current Situation of “Tang” as a Brand and Developing its Position”, we found that Tang orange drinks in the Bangladesh market is in the leading position in the customer mind especially middle aged women and men.
INTRODUCTION
TANG is an Orange drinks from kraft food Ltd. and is Marketed in Bangladesh by Sajeeb Corporation. Tang, available in more than 30 countries, is the leading brand in the Kraft food powdered beverage portfolio. This fresh, fruit-flavored drink is available in a variety of flavors — based on local consumers’ preferences — and is fortified with minerals and vitamins. It is available both as a powdered beverage and in ready-to-drink bottles.
Major markets include:
Argentina Brazil Canada China Colombia Mexico Middle East
New Zealand Puerto Rico Turkey United States Venezuela
Kraft at a Glance
Brands:
Nine brands with revenues of $1 billion –
Kraft Oscar Mayer Philadelphia Maxwell House Nabisco
Oreo Jacobs Milka LU
More than 50 brands with revenues of $100 million
Employees: Headquarters:
103,000 worldwide Northfield, Illinois, United States
Operations:
Operations in more than 70 countries worldwide Sales in more than 150 countries
Approximately 180 manufacturing and processing facilities
Reporting Segments:
We report our financial performance by eight segments:
US Beverages US Cheese US Convenient Meals US Grocery
US Snacks Canada & North America Foodservice European Union
Developing Markets
Stock Symbol:
KFT (New York Stock Exchange)
Revenues:
2007 net revenues were $37 billion
OBJECTIVE OF THE REPORT
The objectives behind doing this report. The objectives are –
To find out the customer perseption about the Brand TANG in Bangladesh.
To find out the lakings or problems of the Brand that make the customer or prospect dissatisfied.
The likings and dislikings of the customers or prospects of the brand.
To outline the future steps to be taken by the brand for developing its position.
ORIGIN OF THE REPORT
As a part of our academic requirement we have been assigned to prepare for the course name Brand Management, Course Code MKT- 427. Our course teacher Mohammad Nazmul Huq , Assistant Professor, Department of Marketing of Stamford University has assigned us the report.
SCOPE OF THE REPORT
We got a chance to do this report as our course teacher has given us as a requirement of the course Brand Management. We did survey on the brand position of the brand TANG. For the survey we took the help of Questionnaire to gather the required information and we analysis the gathered information by Research software SPSS. This report emphasis the level of consumer preference of TANG and the services they are expecting form the brand and the areas in which the company need to undertake development measures and are requiring improvement are also discussed.
THEORETICAL BACKGROUND
Market Research:
Market Research is a systematic, objective collection and breakdown of data about a particular competition, target market, and/or environment. It for all time incorporates some useful information form of data collection whether it is primary research which is collected direct from a respondent or secondary research (often referred to as desk research).
The rationale of any market research task is to accomplish an increased understanding of the subject affair. With markets throughout the world becoming progressively more ready for action, market research is now on the list of items of many organizations, whether they are small or large.
Factor analysis:
A class of measures above all used for data cutback and summarization. There may be a large number of variables in marketing research, a good number of which are correlated and which be required to be reduced to a controllable level. Interaction among sets of many interconnected variables are examined and represented in terms of a few underlying factors.
Factor analysis is used in the following circumstances:
To categorize a slighter set of significant variables from a larger set for use in succeeding multivariate analysis.
To discover a new smaller set of uncorrelated variables to swap the unique set of uncorrelated variables in succeeding multivariate analysis.
To make out fundamental factors or extent, that explains the correlations among a set of variables.
Factor analysis has numerous applications in marketing research. For example:
In product research, factor analysis can be engaged to settle on the brand attributes that manipulate consumer choice.
It can be used in market segmentation for recognizing the number of variables on which to group the customers.
In advertising studies, factors analysis can be used to understand the media consumption behavior of the marked market.
In pricing studies, it can be used it recognize the character of price-sensitive consumes.
Determine the method of factor analysis:
Once it has been agreed on that factor analysis is an apt technique for analyzing the data, an apposite method must be selected.
Determine the method of factor analysis: The two basic approaches are principal components analysis and common factor analysis. In principal components analysis the total variance in the data are considered. The diagonal of correlation matrix consists of unities, and full variance is brought into the factor matrix. Principal component analysis is recommended when the primary concern is to determine the minimum number of factors that will account for maximum variance in the data for use in subsequent multivariate analysis.
In common factor analysis, the factors are estimated based on the common variance. This method is appropriate when the primary concern is to identify the underlying dimensions and the common variance of interest.
Several considerations are involved in determining the number of factors that should be used in the analysis.
Priori determination: Sometimes, because of prior knowledge, the researcher knows how many factors to expect and thus can specify the number of factors to be extracted beforehand. The extraction of factors ceases when the desired number of factors have been extracted.
Determination based on eigenvalues: In this approach only factor with eigenvalues greater than 0.1 are retained; the other factors are not retained in the model. An eigenvalue represents the amount of variance associated with the factor. Hence, a factor with a variance greater than 0.1 are included.
Determination based on Scree plot: A Scree plot is a plot of eigenvalues against the number of factors in order of extractions. The shape of the plot is used to determine the number of factors. Generally the number of factors determined by the Scree plot will be one or few more than that determined by the eigenvalue criterion.
Determination based on percentage of variance: In this approach the number of factors extracted is determined so that the cumulative percentage of variance extracted by the factors reaches a satisfactory level. However it is recommended that the factors extracted should account for at least 60 percent of the variance.
Determination based on Split-Half Reliability: The sample is split in half and factor analysis is performed on each half. Only factors with great correspondence of factor loading across the two sub samples are retained.
Determination based on significance tests: It is possible to determine the statistical significance of separate eigenvalues and retain only those factors that are statistically significant. A drawback is that with large samples (size more than 200) many factors are likely to be statistically significant, although from a practical viewpoint many of these account for only a small portion of the total variance.
RESEARCH DESIGN
Type of research design:
Methodology:
Study Types: It is a descriptive type of study. The methodology of this report is totally different from conventional reports. The researchers have emphasized on the primary data.
Discovery: The discovery has been done from both primary and secondary data. The areas of discovery are all the Orange drinks brands found in Bangladesh. The data are collected from both Primary & Secondary sources.
Primary Sources: The questionnaires are the sources of primary data for this study.
Secondary Sources: While preparing the report, the researchers have taken secondary information from the following sources:
Websites and
Textbook
Sample Size: The sample size from total population is Forty Five (45).
Data collection Technique: For collecting primary data personal questionnaire are used. The questionnaires are organized mostly on close-ended questionnaire.
Information needs:
Information was gathered from the respondents through a questionnaire. A variety of information on the price of the TANG, Size, Convenience, Types of packaging, Test, Packaging quality, Storage friendly, Consistency with advertisement, Price of the mini pack, Easy storage, Promotional activities, Introduction in hot water, test in hot water, Proper direction on the package, Reusable package, excellent fragrance, Social approval, Design of the package, Nutrition, Color of the component, Color of the package, By which competing with rivals.
Plan of data analysis:
The qualitative responses are planned to be transformed into quantitative forms. The collected data would be run in the SPSS software to get the final output. The obtained output will be then interpreted to conclude to the findings.
Data collection from primary sources:
The data collected through the questionnaire comprised the primary data, which has been collected by undertaking a survey on 45 people. The answers provided by them were the source of primary data.
Data collection from secondary sources:
First from the groundwork of questionnaire, fieldwork, data analysis up to drawing conclusion, scaling technique adoption, we took the theoretical assistance from Kevin Lane Keller’s “Strategic Brand Management”, Naresh K. Malhotra’s “Marketing Research: an applied orientation” book and William G. Zikmund’s “Business Research Methods” book. Together with, all the data about the TANG had been composed from their respective websites.
Questionnaire development:
The questionnaire’s prototype has been formulated based on the guidelines provided in the textbooks. Special aid was taken from the Chapter 8 of Keller’s book. Some questions were developed to uncover out the respondents demographic characteristics. After that there are some question to find out the respondent’s thinking about the pricing of Tang, Number of size and the convenient size. Next the purchase habit of the respondent and test and packaging opinion
Fieldwork:
Our group comprised of three researchers. Each researcher conducted fieldwork on 15 samples through the questionnaire. They went to the respondents and asked them to fill up the questionnaire according to their individual perception about the Tang Company.
Scaling techniques:
Different types of scaling techniques have been used in the questionnaire for collecting different information. Some questions were based on a 5 point Likert scale, where,
1= Strongly disagree 2= Disagree 3= Neutral 4= Agree 5= Strongly agree
Some were close-ended questions where the respondents are given choices.
Sampling techniques:
As the time was limited, we went for convenient sampling. But we tried to include respondents from the user of the Tang.
RESULTS
We conducted the survey on 45 individuals the graphical presentation and frequency tables are given below. among them we see that 60% thinking that the price is reasonable, 37.8% think that the price is high and only 2.2% think that the price is low.
Price
Frequency | Percent | Valid Percent | Cumulative Percent | ||
| Valid | 2.00 | 27 | 60.0 | 60.0 | 60.0 |
| 3.00 | 17 | 37.8 | 37.8 | 97.8 | |
| 4.00 | 1 | 2.2 | 2.2 | 100.0 | |
| Total | 45 | 100.0 | 100.0 |
| |
Size
Frequency | Percent | Valid Percent | Cumulative Percent | ||
| Valid | 1.00 | 20 | 44.4 | 44.4 | 44.4 |
| 2.00 | 7 | 15.6 | 15.6 | 60.0 | |
| 3.00 | 16 | 35.6 | 35.6 | 95.6 | |
| 4.00 | 2 | 4.4 | 4.4 | 100.0 | |
| Total | 45 | 100.0 | 100.0 | ||
SizeConveinent
Frequency | Percent | Valid Percent | Cumulative Percent | ||
| Valid | 1.00 | 16 | 35.6 | 35.6 | 35.6 |
| 2.00 | 18 | 40.0 | 40.0 | 75.6 | |
| 3.00 | 11 | 24.4 | 24.4 | 100.0 | |
| Total | 45 | 100.0 | 100.0 | ||
PackageConveinent
Frequency | Percent | Valid Percent | Cumulative Percent | ||
| Valid | 1.00 | 22 | 48.9 | 48.9 | 48.9 |
| 2.00 | 10 | 22.2 | 22.2 | 71.1 | |
| 3.00 | 13 | 28.9 | 28.9 | 100.0 | |
| Total | 45 | 100.0 | 100.0 | ||
Size Purchased
Frequency | Percent | Valid Percent | Cumulative Percent | ||
| Valid | 1.00 | 15 | 33.3 | 33.3 | 33.3 |
| 2.00 | 14 | 31.1 | 31.1 | 64.4 | |
| 3.00 | 16 | 35.6 | 35.6 | 100.0 | |
| Total | 45 | 100.0 | 100.0 | ||
Why Purchased
Frequency | Percent | Valid Percent | Cumulative Percent | ||
| Valid | 1.00 | 27 | 60.0 | 60.0 | 60.0 |
| 2.00 | 17 | 37.8 | 37.8 | 97.8 | |
| 4.00 | 1 | 2.2 | 2.2 | 100.0 | |
| Total | 45 | 100.0 | 100.0 | ||
PriceOfSize
Frequency | Percent | Valid Percent | Cumulative Percent | ||
| Valid | 1.00 | 1 | 2.2 | 2.2 | 2.2 |
| 2.00 | 15 | 33.3 | 33.3 | 35.6 | |
| 3.00 | 26 | 57.8 | 57.8 | 93.3 | |
| 4.00 | 3 | 6.7 | 6.7 | 100.0 | |
| Total | 45 | 100.0 | 100.0 | ||
Test
Frequency | Percent | Valid Percent | Cumulative Percent | ||
| Valid | 1.00 | 6 | 13.3 | 13.3 | 13.3 |
| 2.00 | 32 | 71.1 | 71.1 | 84.4 | |
| 3.00 | 6 | 13.3 | 13.3 | 97.8 | |
| 4.00 | 1 | 2.2 | 2.2 | 100.0 | |
| Total | 45 | 100.0 | 100.0 | ||
Pachakging
Frequency | Percent | Valid Percent | Cumulative Percent | ||
| Valid | 1.00 | 3 | 6.7 | 6.7 | 6.7 |
| 2.00 | 31 | 68.9 | 68.9 | 75.6 | |
| 3.00 | 10 | 22.2 | 22.2 | 97.8 | |
| 4.00 | 1 | 2.2 | 2.2 | 100.0 | |
| Total | 45 | 100.0 | 100.0 | ||
PackagingStorage
Frequency | Percent | Valid Percent | Cumulative Percent | ||
| Valid | 1.00 | 5 | 11.1 | 11.1 | 11.1 |
| 2.00 | 29 | 64.4 | 64.4 | 75.6 | |
| 3.00 | 4 | 8.9 | 8.9 | 84.4 | |
| 4.00 | 6 | 13.3 | 13.3 | 97.8 | |
| 5.00 | 1 | 2.2 | 2.2 | 100.0 | |
| Total | 45 | 100.0 | 100.0 | ||
ConsistancyAdv
Frequency | Percent | Valid Percent | Cumulative Percent | ||
| Valid | 1.00 | 1 | 2.2 | 2.2 | 2.2 |
| 2.00 | 31 | 68.9 | 68.9 | 71.1 | |
| 3.00 | 8 | 17.8 | 17.8 | 88.9 | |
| 4.00 | 4 | 8.9 | 8.9 | 97.8 | |
| 5.00 | 1 | 2.2 | 2.2 | 100.0 | |
| Total | 45 | 100.0 | 100.0 | ||
MinipackPrice
Frequency | Percent | Valid Percent | Cumulative Percent | ||
| Valid | 1.00 | 4 | 8.9 | 8.9 | 8.9 |
| 2.00 | 14 | 31.1 | 31.1 | 40.0 | |
| 3.00 | 14 | 31.1 | 31.1 | 71.1 | |
| 4.00 | 11 | 24.4 | 24.4 | 95.6 | |
| 5.00 | 2 | 4.4 | 4.4 | 100.0 | |
| Total | 45 | 100.0 | 100.0 | ||
EasyStorage
Frequency | Percent | Valid Percent | Cumulative Percent | ||
| Valid | 1.00 | 6 | 13.3 | 13.3 | 13.3 |
| 2.00 | 23 | 51.1 | 51.1 | 64.4 | |
| 3.00 | 4 | 8.9 | 8.9 | 73.3 | |
| 4.00 | 11 | 24.4 | 24.4 | 97.8 | |
| 5.00 | 1 | 2.2 | 2.2 | 100.0 | |
| Total | 45 | 100.0 | 100.0 | ||
FreesWelcome
Frequency | Percent | Valid Percent | Cumulative Percent | ||
| Valid | 1.00 | 19 | 42.2 | 42.2 | 42.2 |
| 2.00 | 14 | 31.1 | 31.1 | 73.3 | |
| 3.00 | 6 | 13.3 | 13.3 | 86.7 | |
| 4.00 | 5 | 11.1 | 11.1 | 97.8 | |
| 5.00 | 1 | 2.2 | 2.2 | 100.0 | |
| Total | 45 | 100.0 | 100.0 | ||
TestInHotWater
Frequency | Percent | Valid Percent | Cumulative Percent | ||
| Valid | 1.00 | 1 | 2.2 | 2.2 | 2.2 |
| 2.00 | 13 | 28.9 | 28.9 | 31.1 | |
| 3.00 | 16 | 35.6 | 35.6 | 66.7 | |
| 4.00 | 15 | 33.3 | 33.3 | 100.0 | |
| Total | 45 | 100.0 | 100.0 | ||
NacessityInHotWater
Frequency | Percent | Valid Percent | Cumulative Percent | ||
| Valid | 1.00 | 1 | 2.2 | 2.2 | 2.2 |
| 2.00 | 9 | 20.0 | 20.0 | 22.2 | |
| 3.00 | 21 | 46.7 | 46.7 | 68.9 | |
| 4.00 | 13 | 28.9 | 28.9 | 97.8 | |
| 5.00 | 1 | 2.2 | 2.2 | 100.0 | |
| Total | 45 | 100.0 | 100.0 | ||
ProperDirection
Frequency | Percent | Valid Percent | Cumulative Percent | ||
| Valid | 1.00 | 5 | 11.1 | 11.1 | 11.1 |
| 2.00 | 28 | 62.2 | 62.2 | 73.3 | |
| 3.00 | 10 | 22.2 | 22.2 | 95.6 | |
| 4.00 | 2 | 4.4 | 4.4 | 100.0 | |
| Total | 45 | 100.0 | 100.0 | ||
ReuseablePackage
Frequency | Percent | Valid Percent | Cumulative Percent | ||
| Valid | 1.00 | 12 | 26.7 | 26.7 | 26.7 |
| 2.00 | 24 | 53.3 | 53.3 | 80.0 | |
| 3.00 | 2 | 4.4 | 4.4 | 84.4 | |
| 4.00 | 3 | 6.7 | 6.7 | 91.1 | |
| 5.00 | 4 | 8.9 | 8.9 | 100.0 | |
| Total | 45 | 100.0 | 100.0 | ||
Fragrance
Frequency | Percent | Valid Percent | Cumulative Percent | ||
| Valid | 1.00 | 7 | 15.6 | 15.6 | 15.6 |
| 2.00 | 26 | 57.8 | 57.8 | 73.3 | |
| 3.00 | 9 | 20.0 | 20.0 | 93.3 | |
| 4.00 | 3 | 6.7 | 6.7 | 100.0 | |
| Total | 45 | 100.0 | 100.0 | ||
SocialApproval
Frequency | Percent | Valid Percent | Cumulative Percent | ||
| Valid | 1.00 | 4 | 8.9 | 8.9 | 8.9 |
| 2.00 | 22 | 48.9 | 48.9 | 57.8 | |
| 3.00 | 16 | 35.6 | 35.6 | 93.3 | |
| 4.00 | 3 | 6.7 | 6.7 | 100.0 | |
| Total | 45 | 100.0 | 100.0 | ||
PackageDesign
Frequency | Percent | Valid Percent | Cumulative Percent | ||
| Valid | 1.00 | 1 | 2.2 | 2.2 | 2.2 |
| 2.00 | 34 | 75.6 | 75.6 | 77.8 | |
| 3.00 | 9 | 20.0 | 20.0 | 97.8 | |
| 4.00 | 1 | 2.2 | 2.2 | 100.0 | |
| Total | 45 | 100.0 | 100.0 | ||
Nutrition
Frequency | Percent | Valid Percent | Cumulative Percent | ||
| Valid | 1.00 | 1 | 2.2 | 2.2 | 2.2 |
| 2.00 | 8 | 17.8 | 17.8 | 20.0 | |
| 3.00 | 30 | 66.7 | 66.7 | 86.7 | |
| 4.00 | 6 | 13.3 | 13.3 | 100.0 | |
| Total | 45 | 100.0 | 100.0 | ||
ContentColor
Frequency | Percent | Valid Percent | Cumulative Percent | ||
| Valid | 1.00 | 6 | 13.3 | 13.3 | 13.3 |
| 2.00 | 34 | 75.6 | 75.6 | 88.9 | |
| 3.00 | 4 | 8.9 | 8.9 | 97.8 | |
| 4.00 | 1 | 2.2 | 2.2 | 100.0 | |
| Total | 45 | 100.0 | 100.0 | ||
PackageColor
Frequency | Percent | Valid Percent | Cumulative Percent | ||
| Valid | 1.00 | 9 | 20.0 | 20.0 | 20.0 |
| 2.00 | 31 | 68.9 | 68.9 | 88.9 | |
| 3.00 | 4 | 8.9 | 8.9 | 97.8 | |
| 4.00 | 1 | 2.2 | 2.2 | 100.0 | |
| Total | 45 | 100.0 | 100.0 | ||
Quality
Frequency | Percent | Valid Percent | Cumulative Percent | ||
| Valid | 1.00 | 22 | 48.9 | 48.9 | 48.9 |
| 2.00 | 5 | 11.1 | 11.1 | 60.0 | |
| 3.00 | 18 | 40.0 | 40.0 | 100.0 | |
| Total | 45 | 100.0 | 100.0 | ||
CompetingWIthRivals
Frequency | Percent | Valid Percent | Cumulative Percent | ||
| Valid | 1.00 | 13 | 28.9 | 28.9 | 28.9 |
| 2.00 | 10 | 22.2 | 22.2 | 51.1 | |
| 3.00 | 1 | 2.2 | 2.2 | 53.3 | |
| 5.00 | 15 | 33.3 | 33.3 | 86.7 | |
| 6.00 | 1 | 2.2 | 2.2 | 88.9 | |
| 8.00 | 1 | 2.2 | 2.2 | 91.1 | |
| 9.00 | 2 | 4.4 | 4.4 | 95.6 | |
| 10.00 | 2 | 4.4 | 4.4 | 100.0 | |
| Total | 45 | 100.0 | 100.0 | ||
Gender
Frequency | Percent | Valid Percent | Cumulative Percent | ||
| Valid | 1 | 4 | 8.9 | 8.9 | 8.9 |
| 2 | 41 | 91.1 | 91.1 | 100.0 | |
| Total | 45 | 100.0 | 100.0 | ||
Age
Frequency | Percent | Valid Percent | Cumulative Percent | ||
| Valid | 1 | 21 | 46.7 | 46.7 | 46.7 |
| 2 | 16 | 35.6 | 35.6 | 82.2 | |
| 3 | 4 | 8.9 | 8.9 | 91.1 | |
| 4 | 3 | 6.7 | 6.7 | 97.8 | |
| 5 | 1 | 2.2 | 2.2 | 100.0 | |
| Total | 45 | 100.0 | 100.0 | ||
Education
Frequency | Percent | Valid Percent | Cumulative Percent | ||
| Valid | 2 | 10 | 22.2 | 22.2 | 22.2 |
| 3 | 15 | 33.3 | 33.3 | 55.6 | |
| 4 | 14 | 31.1 | 31.1 | 86.7 | |
| 5 | 5 | 11.1 | 11.1 | 97.8 | |
| 6 | 1 | 2.2 | 2.2 | 100.0 | |
| Total | 45 | 100.0 | 100.0 | ||
Profession
Frequency | Percent | Valid Percent | Cumulative Percent | ||
| Valid | 1 | 10 | 22.2 | 22.2 | 22.2 |
| 2 | 7 | 15.6 | 15.6 | 37.8 | |
| 3 | 4 | 8.9 | 8.9 | 46.7 | |
| 4 | 23 | 51.1 | 51.1 | 97.8 | |
| 5 | 1 | 2.2 | 2.2 | 100.0 | |
| Total | 45 | 100.0 | 100.0 | ||
Factor Analysis
A Priori Determination:
There are many factors that influence a customer for choosing Tang for the family as orange drinks. Through the process of predetermination by analyzing the frequencies of the 30 variables we extracted the following factors to go for the research: Packaging is perfect for the storage, Consistency with advertisement and the price of the mini pack.
Determination Based on Eigenvalues:
An eigenvalue represents the amount of variance associated with the factor. So, in this approach, factors having an eigenvalue more than 1.00 are retained. Accordingly, in this research only the factors attitude and recommendation was derived. Therefore, only these 3 factors are considered.
Determination Based on Scree Plot:
The eigenvalues are plot against the number of factors in order of extraction.
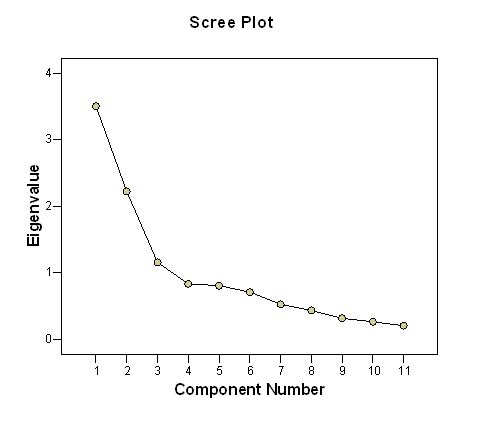
As per the graph we see that the first three factors have more influence. Therefore the true number of factors is 3.
Determination Based on Significance Tests:
This test is done only when the sample size is more than 200. In this research since the number of sample are only 45, so this test has not been done.
POSITION DEVELOPMENT
From on the whole study through research and analysis many points came out which require development for proper position. The subsequent points can be taken under consideration for the purpose of planning for developing the current position of the brand Tang effectively:
Quality: As we saw in our study that a consider number of respondent were confused about the quality of Tang so the company should think little about the quality and make the 40% respondents be sure about the quality.
Storage: In this research we saw that easy storage was agreed by 51% and only 13% were strongly agree but the rest number of the respondent were confused and disagree with the statement, so the company can develop reusable package so the storage attitude will increase and the consumer can easily store the Tang.
Recommendation:
Depending on the information provided the respondent the following recommendations are provided:
The price of the mini pack can be decreased as we saw that a considerable number of respondents think that the price of the mini pack is high as highest number of respondents purchase mini pack though Family size and Regular size has got very close percentage.
The company should concentrate the test of Tang in hot water as a considerable number of respondents say that the test changes in hot water.
Majority of the respondents are very much interested about reusable packaging so the can think about reusable package and by this they could acquire some market share.
The brand should increase their availability even in the remote areas to hold a bright image in terms of availability being the only established national brand.
As Tang is a foreign product and is marketed by Sajeeb Corporation. But they marketed only orange flavor so they can introduce Mango flavor that may help the company to ac quire new customer.
Most people certified Nutrition as average so the company should put emphasis to communicate the massage that Tang is a Nutritious drinks and alone with the communication the company increase the vitamin C level as most customer take orange as for vitamin C.
After Marketing
Here the company can collect customer feedback and analyze the feedback of the customer. The found advantages and disadvantages should be taken under consideration and develop the sector where the customer think necessary. And the company should possess an attitude which will make the customer understand that the company is very much interested about the customer’s interest.
The company can conduct a survey on the satisfaction of the consumer. Through that the company should identify the level of satisfaction and dissatisfaction of the consumer and the reason of the satisfaction and dissatisfaction. After identifying the reason the company can easily take steps to check the problem associated with the dissatisfaction The Company can also identify the lost customer and the reason of the loss. And try to regain them.
The company con host special customer event like, celebrating relationship. That is the company can honor those customer who are using Tang for long time.
Event Marketing & Sponsorship
In this section the company can arrange an award giving ceremony to the A+ holder in the HSC and SSC and also students who got chance in Dhaka University, BUET and any other organization. And the arrangement could be like concert as well as award giving ceremony.
The company can sponsor the Annual sports day of any school as the school boys are very much likely to drink Tang. At that time the company can try to promote a massage that the students carry water bottle to the school and instead of water bottle they should carry Tang. That is the company should try to change the habit of drinking water in school by Tang. The Massage could be Tang will help you be more energetic and able to concentrate to the study more efficiently and effectively.
LIMITATIONS
We faced several problems to conduce the research but we put our enthusiastic endeavor to conduct the research and to bring a trustworthy and fertile result. In spite of having the enthusiastic endeavor, we excised some limitations, which acted as a barrier to conduct the research. The limitations are:
The first limitaion was that the respondents were very much unwilling to respond to the questionnair.
We were not so much experianced to do such kind of research and we also do not have intellectual thought and analytical ability to make it the most perfect one.
Sufficient data for prepare a report were not available.
Time was very much limited.
None of our group member don’t have computer at home and due to the vacation practice lab was closed that make us face difficulties to compose.
Most of the mothers are not even aware of at least a handful of brand names of Baby Lotion.
CONCLUSION
Tang is a foreign brand and is marketed by local Sajeeb Corporation. But it has only one flavor so the Sajeeb Corporation should marketed the Tang’s newly introduced Mango flavor in Bangladesh. By this they could acquire new customer market.
The tang has a good image in the mind of the consumer in comparison with the rivals but the company should try to improve its image and also sustain the current image.