Introduction
The values of the chemical properties of the top soil (0-15 cm) layer from a 24 month duration agroforestry system and open field crop system could not be compared statistically because composite soil sample analysis were used. But standard error values were calculated for each treatment considering variation with and among treatments. The initial soil properties are shown in the magnitude of variation after 24 months due to the different treatments are presented in Figures 108-115.
Soil pH
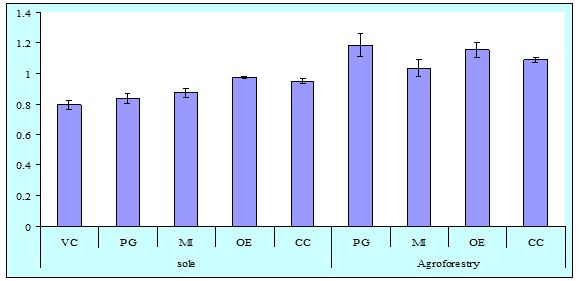
Shows the soil PH with different tree species grown alone and in association with six vegetable cultivation. The PH of the top soil remained unaffected in the vegetable crops and in the sole tree species, but it was significantly increased in the agroforestry systems. The highest (5.57) PH value was recorded in P. guajava based agroforestry plots and the lowest (5.27) was observed in M. indica agroforestry plots.
The unaffected soil PH under sole tree plots could be attributed to the undecomposed leaf materials. The increase in soil PH under P. guajava may be explained by its faster leaf decomposition and application of cow dung as organic matter.
Organic matter
Changes of organic matter (%) as a result of the different treatments are shown in the. Almost all systems slightly increased organic matter content as compared to vegetable crops. In the sole tree plots, the highest (1.87 %) organic matter was observed under O. europea plot and the lowest (1.5 %) was recorded under M. indica plot. Within agroforestry systems, the highest (1.99 %) organic matter was observed under O.europea plot which was also higher as M. indica sole plot.
The increased organic matter under sole plot due to decomposed leaf materials. The increased organic matter under agroforestry system could be attributed to the addition of leaf litter fall and root biomass. Sing et al., (1989) showed significantly higher organic matter in different agroforestry system than sole crops.
pH
Soil pH of topsoil layer from 48-month-old species grown alone (sole) and in association with vegetable crops (VC) as affected by associated tree species (PG = Psidium guajava; MI = Mangifera indica; OE = Olea europea; CC = Carrica caranda). Vertical bars represent standard errors alone the tree species
Organic matter (%)
Soil organic matter (%) of topsoil layer from 48-month-old species grown alone (sole) and in association with vegetable crops (VC) as affected by associated tree species (PG = Psidium guajava; MI = Mangifera indica; OE = Olea europea; CC = Carrica caranda). Vertical bars represent standard errors alone the tree species
Organic carbon
Changes in organic carbon as a result of different treatments are shown in Figure 110. Soil organic carbon content was slightly lower in the sole vegetable crop plot but increased in all the agroforestry and sole tree plots. Within sole tree treatments the highest (0.95 %) organic carbon was observed under O. europea plot and the lowest (0.72%) was recorded under P. guajava treatment. Among the agroforestry treatment, the highest (1.185 %) organic carbon was observed under P.guajava based system and the lowest (1.035 %) was observed under M. indica based system.
Within the three treatments, the sole tree and agroforestry treatments showed relatively higher organic compared with sole vegetable crops plot. The increased organic C could be attributed to the addition of large quantities leaf litters and root biomass. Sing et al., (1989) showed significantly higher organic C in different agroforestry systems than in sole crops.
Total Nitrogen
Soil N content followed a trend similar to that of organic C (Fig. 111) except N content in M. indica and O. europea plot. Total N content in M. indica (0.097 %) and 0. europea (0.099%) plot was lower as composed to sole vegetable plot (0.102 %) under agroforestry system. The highest total N content (0.145 %) was observed under P. guavava based sole system and the lowest (0.115 %) was observed under C. carandus plot. Among the three systems, agroforestry plot showed relatively high total N content than other two treatments.
The higher N content in plots with agroforestry system was probably due to higher N content and faster leaf decomposition and N release compared with other two species. Among four species, P. guajava plot contains the higher N than any other species.
Organic carbon (%)
Soil organic carbon (%) of topsoil layer from 48-month-old species grown alone (sole) and in association with vegetable crops (VC) as affected by associated tree species (PG = Psidium guajava; MI = Mangifera indica; OE = Olea europea; CC = Carrica caranda). Vertical bars represent standard errors alone the tree species
Nitrogen (%)
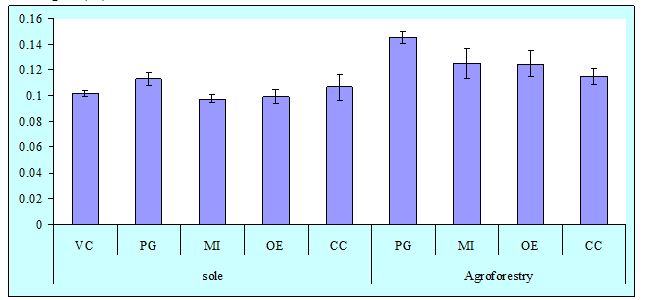
Soil nitrogen (%) of topsoil layer from 48-month-old species grown alone (sole) and in association with vegetable crops (VC) as affected by associated tree species (PG = Psidium guajava; MI = Mangifera indica; OE = Olea europea; CC = Carrica caranda). Vertical bars represent standard errors alone the tree species.
Available phosphorus
shows the available P content of the soil under different agroforestry and control treatments. Available P content in the vegetable crops and sole tree plots remained unchanged (14.53 ppm). Among the sole tree species the average mean P was 14.53 ppm in P. guajava, 14.23 ppm in M. indica, 14.78 ppm in O. europea and 14.74 ppm in C. carandus based plots. The highest (15.90 ppm) soil P was obtained from O. europea agroforestry plot and the lowest (14.116 ppm) from vegetable crop plots.
The P availability under agroforestry plot may be due to higher organic matter content which acts as a buffer of soil and availability of P increase by decreasing acidity of the soil.
Exchangeable Potassium
The exchangeable K content of the top soil layer is presented in Figure 113 of three systems (vegetable crops, sole tree and agroforestry system). The exchangeable K of the top soil layer was slightly lower in the control vegetable crops compared to agroforestry and sole tree treatments.
The lower in exchangeable K content in sole vegetable plots may be due to depletion caused by crop removal and losses in run off. The increase of K in plots with tree species was probably due to return, via tree leaf pruning and leaf litter fall to the soil surface. Among the tree species in the sole tree plot, the mean soil exchangeable K value was higher in O. europea (0.45 meq/100 g), C. carandus (0.439 meq/100 g) and P. guajava (0.4366 meq/100 g). Among systems, agroforestry tree showed higher K content than sole tree and sole vegetable crops.
Available P (ppm)
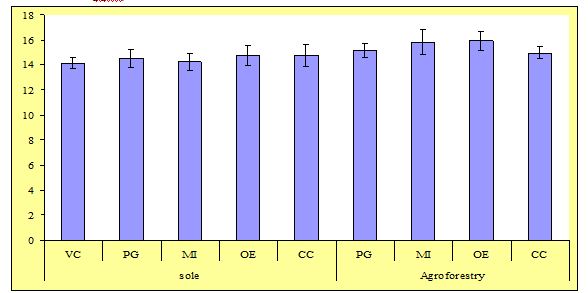
Soil available P (ppm) of topsoil layer from 48-month-old species grown alone (sole) and in association with vegetable crops (VC) as affected by associated tree species (PG = Psidium guajava; MI = Mangifera indica; OE = Olea europea; CC = Carrica caranda). Vertical bars represent standard errors alone the tree species.
Exchangeable K (meq/100g)
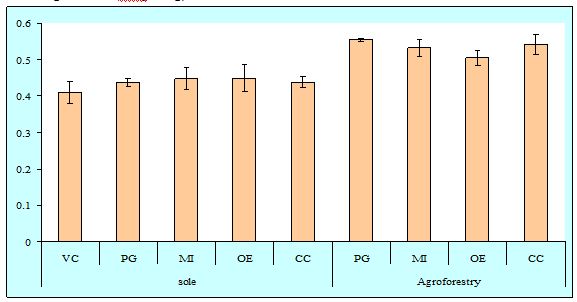
Soil exchangeable K (meq/100g) of topsoil layer from 48-month-old species grown alone (sole) and in association with vegetable crops (VC) as affected by associated tree species (PG = Psidium guajava; MI = Mangifera indica; OE = Olea europea; CC = Carrica caranda). Vertical bars represent standard errors alone the tree species
Exchangeable calcium
Soil contents of exchangeable Ca showed an increasing trend in all the treatments. Before the experiments, the mean exchangeable Ca content of the soil was 5.43 meq/100 g, but after 24 months, it varied from 10.176 to 12.51 meq/100 g soil. The data showed that exchangeable Ca content of the sole vegetable crop, sole tree and agroforestry tree plot increased significantly. But within the three treatments, the exchangeable Ca content did not vary much except M. indica and C. carandus agroforestry plots. The unexpected soil ca levels in these two agroforestry systems may be due to accumulation of Ca in the surface layer. Similar results regarding an increase of Ca of surface soil in agroforestry systems have been reported in other experiments (Lal, 1989, Onim et al., 1990 and Soriano, 1991).
Exchangeable magnesium
The trend of soil exchangeable mg content was different from those of other soil nutrients (Fig.115). Before the experiment, exchangeable Mg. content was lower as compared to after experiment. Exchangeable Mg content was higher (4.7.5 meq/100 g) in sole vegetable crops and there was a downward trend in the other treatments. Among the tree treatments, the agroforestry system contain lowest exchangeable Mg and within this P. guajava contains the lowest (3.62 meq/100 g) Mg. A decrease in soil exchangeable was recorded by Soriano (1991) who noted a significant decline in soil Mg content as a result of alley cropping.
Exchangeable Ca (meq/100g)
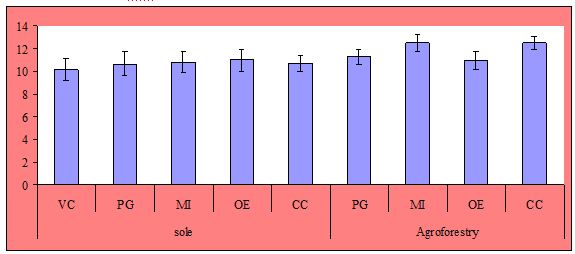
Soil exchangeable Ca (meq/100g) of topsoil layer from 48-month-old species grown alone (sole) and in association with vegetable crops (VC) as affected by associated tree species (PG = Psidium guajava; MI = Mangifera indica; OE = Olea europea; CC = Carrica caranda). Vertical bars represent standard errors alone the tree species
Exchangeable Mg (meq/100g)
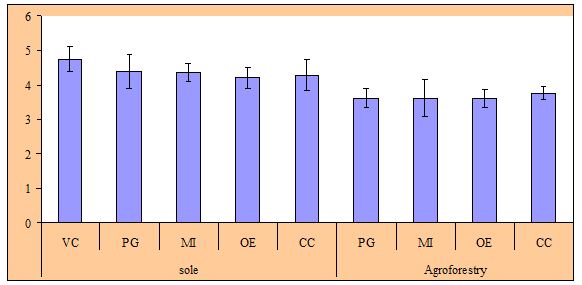
Soil exchangeable Mg (meq/100g) of topsoil layer from 48-month-old species grown alone (sole) and in association with vegetable crops (VC) as affected by associated tree species (PG = Psidium guajava; MI = Mangifera indica; OE = Olea europea; CC = Carrica caranda). Vertical bars represent standard errors alone the tree species
Economic Performance
The economic performance and item wise cost, return and benefit-cost ratio of agroforestry and sole treatments (vegetables and fruit trees) are presented in tables 35 -36 and appendix tables 117-121, respectively.
The benefit-cost ratio of the tested technology for the year 2009 was impressible (Table 35). Among the vegetable of tomato, cucumber and country bean cultivated at there consecutive seasons, Tomato + Mango based system produced the highest (6.08) BCR in the Rabi Season followed by Cucumber + Mango ( BCR 4.36) and Country bean + Mango (BCR 3.39). On the other hand Country bean + Karanda based agroforestry system recorded the lowest (1.96) BCR in the Kharif 2 season. When total BCR takes into consideration, all the three vegetables cultivated in the three consecutive seasons were economic .But country bean cultivated under four fruit trees was un-economic in the absence of tree products.
Benefit-Cost Ratio (BCR) of fruit tree-vegetable based agroforestry systems and sole vegetables (BSMRAU, 2009)
| System | BCR | Total BCR | ||
Agroforestry vegetable | Agroforestry fruit tree | |||
| 1. Rabi | Tomato + Guava | 3.60 | 2.44 | 6.04 |
| Tomato + Mango | 3.38 | 2.7 | 6.08 | |
| Tomato + Olive | 2.76 | 1.7 | 4.46 | |
| Tomato + Karanda | 3.99 | 1.04 | 5.03 | |
| Tomato (Sole) | – | 4.83 | 4.83 | |
| 2. Kharif 1 | Cucumber + Guava | 1.5 | 2.44 | 3.94 |
| Cucumber + Mango | 1.66 | 2.7 | 4.36 | |
| Cucumber + Olive | 1.16 | 1.7 | 2.86 | |
| Cucumber + Karanda | 1.6 | 1.04 | 2.64 | |
| Cucumber (Sole) | – | 1.83 | 1.83 | |
| 3. Kharif 2 | Country bean+ Guava | 0.77 | 2.44 | 3.21 |
| Country bean + Mango | 0.69 | 2.7 | 3.39 | |
| Country bean + Olive | 0.61 | 1.7 | 2.31 | |
| Country bean+ Karanda | 0.92 | 1.04 | 1.96 | |
| Country bean (Sole) | – | 1.11 | 1.11 | |
In the second year, another three vegetables (cabbage, bitter gourd and yardlong bean) were cultivated under guava mango, olive and karanda fruit tree and calculated total BCR was found more economic than the year 2009 (Table 36). The cause of this increased BCR was due to increased soil fertility and increased tree products (Table 10.8). In this year, mango, based agroforestry systems irrespective of three seasons produced the highest BCR. In the Rabi season, the highest BCR (6.05) was recorded from Cabbage + Mango based agroforestry system which was followed by Bitter ground + ango (BCR 4.94) and Yard long bean + Mango (BCR 4.72), respectively. Among the seasons, cabbage grown in the Rabi season in association with four fruit trees was economic.
The study revealed that, mango based agroforestry system was the best suited followed by guava and karanda. Olive based agroforestry system was less economic. Among the season, Rabi season was found suitable agroforestry cultivation period followed by Kharif 1 and Kharif 2 season.
Benefit-Cost Ratio (BCR) of fruit tree-vegetable based agroforestry systems and sole vegetables (BSMRAU, 2010)
BCR | Total BCR | |||
| System | Agroforestry vegetable | Agroforestry fruit tree | ||
1. Rabi | Cabbage+ Guava | 3.3 | 2.7 | 6.00 |
| Cabbage + Mango | 3.1 | 2.95 | 6.05 | |
| Cabbage + Olive | 2.63 | 1.59 | 4.22 | |
| Cabbage+ Karanda | 3.72 | 0.98 | 4.70 | |
| Cabbage (Sole) | – | 4.38 | 4.38 | |
| 2. Kharif 1 | Bitter gourd+ Guava | 1.98 | 2.7 | 4.68 |
| Bitter gourd + Mango | 1.99 | 2.95 | 4.94 | |
| Bitter gourd + Olive | 1.85 | 1.59 | 3.44 | |
| Bitter gourd+ Karanda | 2.38 | 0.98 | 3.36 | |
| Bitter gourd (Sole) | – | 2.25 | 2.25 | |
| 3. Kharif 2 | Yardlong bean+ Guava | 1.93 | 2.7 | 4.63 |
| Yardlong bean + Mango | 1.77 | 2.95 | 4.72 | |
| Yardlong bean + Olive | 1.51 | 1.59 | 3.10 | |
| Yardlong bean+ Karanda | 2.38 | 0.98 | 3.36 | |
| Yardlong bean (Sole) | – | 2.62 | 2.62 | |