TRACKING the maximum power point (MPP) of a photostatic (PV) array is usually an essential part of a PV system. As such, many MPP tracking (MPPT) methods have been developed and implemented. The methods vary in complexity, sensors required, convergence speed, cost, range of effectiveness, implementation hardware, popularity, and in other respects. They range from the almost obvious (but not necessarily ineffective) to the most creative (not necessarily most effective). In fact, so many methods have been developed that it has become difficult to adequately determine which method, newly proposed or existing, is most appropriate for a given PV system.
A maximum power point tracker (MPPT) is a high efficiency DC to DC converter that presents an optimal electrical load to a solar panel or array and produces a voltage suitable for the load. PV cells have a single operating point where the values of the current (I) and (V) of the cell result in a maximum power output. These values correspond to a particular resistance, which is equal to V/I as specified by Ohm’s law. A PV cell has an exponential relationship between current and voltage, and the maximum power point (MPP) occurs at the knee of the curve, where the resistance is equal to the negative of the differential resistance (V/I = – dV / dI ). Maximum power point trackers utilize some type of control circuit or logic to search for this point and thus to allow the converter circuit to extract the maximum power available from a cell
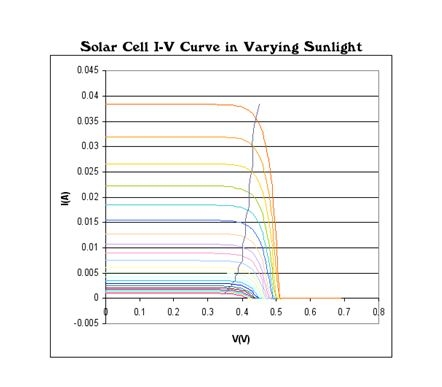
Figure (28): Solar cell I-V curves where a line intersects the knee of the curves where the maximum power point is located
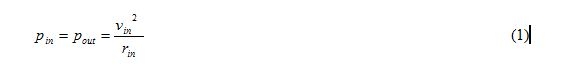
Tracking the maximum power point (MPP) of the solar panel is based on the frequency modulation technique in [31] that the PWM signal to is modulated with a low-frequency signal. The panel is modeled by a Thevenin’s equivalent circuit, which consists of a voltage source connected in series in an output resistance around the MPP. Both and are subject to the level of insulation and temperature. The input voltage and equivalent Input resistance of the converter are and respectively. Assuming 100% conversion efficiency
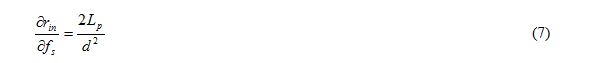
The rate on change of with respect to and can be shown to be
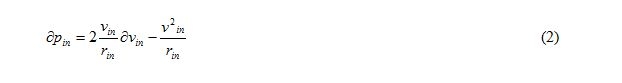
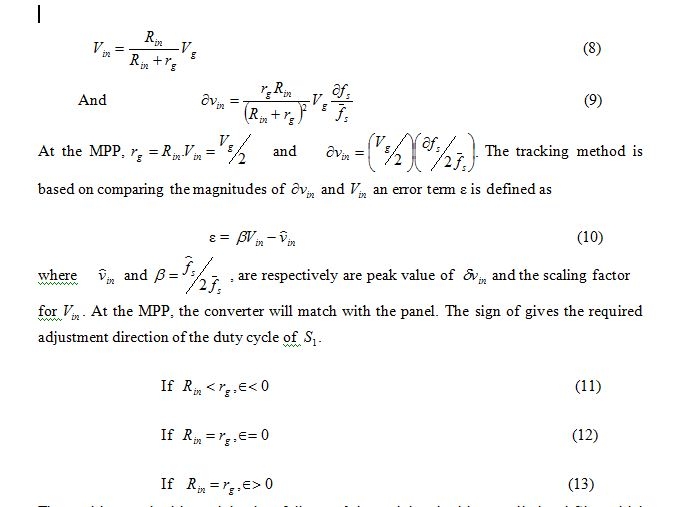
At the MPP, and .Hence
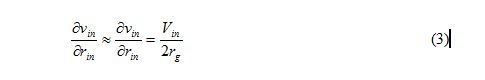
Where is the average input voltage. This equation gives the required dynamic input
Characteristics of the converter, in which has small-signal variation of subject to a small-signal change of .
If the switching frequency of of is modulated with a small signal sinusoidal variation.
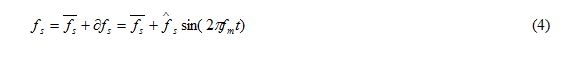
Where is the nominal switching frequency, is the modulating frequency and is much
lower than , and is the maximum frequency deviation. Consists of two components, including an average resistance and a small variation. That is
![]()
As shown in [14], for the buck-boost converter
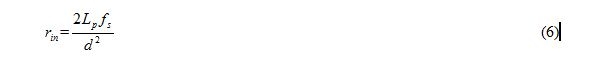
By differentiating (7) it can be shown that…..