Introduction:
The nutritional status of an individual is often the result of many interrelated factors. It is influenced by the amount of food intake both in terms of quality and quantity and also by physical health of the individual. Malnutrition is a state of nutrition in which a deficiency, excess or imbalance of energy, protein, and other nutrients causes measurable adverse effects on tissue and body form (body shape, size, and composition), body function and clinical outcome. Malnutrition includes both under nutrition and over nutrition.
High incidence of malnutrition in medical and surgical patients was first shown more than fifteen years ago. Nutritional status has been shown to have important effects on health, in recovery from illness or injury. It determines the general well-being of the patient speed of recovery from illness and ultimate outcome. Experimental semi starvation of normal volunteers with loss of 25% of body weight (to a body mass index of 17.5) resulted in apathy, depression, fatigue, and loss of will to recover. Malnutrition causes loss of muscle power and affects respiratory function, increasing susceptibility to chest infection and reduces cardiac function. Risk of infection increases due to impaired immune function. As a result, such complications result in increased morbidity and mortality and prolonged hospital stay, and increases the health care cost substantially. However, randomized controlled trials and meta-analysis have revealed that protein and energy supplementation in adults with many medical and surgical illnesses may improve outcome. Despite such findings, the problem of malnutrition in hospitalized patients remains largely unaddressed.
The nutritional screening of patients at risk of depletion is not routine in many hospitals. There are many different nutrition screening tools in hospitals. Weight and height are common to several. To identify under nutrition, it is therefore necessary to define a series of measurable criteria. The body mass index (BMI) (weight in kg, divided by height in m2) is a simple but robust measurement. Body mass index on its own, however, will not identify all patients at risk of malnutrition especially in obese patients in whom fall of nutritional intake will result in weight loss but BMI still remains normal and is also not a sensitive indicator of protein energy malnutrition as it does not distinguish between depletion of fat or muscle. Low body mass index measurements will also include some patients who normally weigh less than is usual for their height. It is therefore useful to include other measurements of fat and muscle stores. Measurement of triceps skin fold thickness provides an estimate of body fat reserves. Mid-arm muscle circumference is a useful measure of muscle protein stores. Unintentional weight loss before illness is a dynamic measure of nutritional status to identify patients at risk of complications as a result of getting thinner. An unintentional loss of 10% of body weight is usually associated with poorer clinical outcomes, even in the obese. A definition of malnutrition must, therefore, include a provision for unintentional weight loss. Evidence suggests that unintentional weight loss of 5–10% of body weight over a period of three to six months is associated with poorer outcomes in patients11. Hospital admitted patients develop nutritional problems because malnutrition is strongly associated with both acute and chronic disease. Acutely ill patients become catabolic and that their nutritional requirements can be very high, particularly in those with sepsis, trauma or burns, in the majority of inpatients, however the most important single factor leading to malnutrition is probably loss of appetite and failure of intake.
Malnutrition is associated with more consultations with general practitioners and a higher rate of admission to hospital. Once in hospital the priority becomes diagnosis of the underlying illness and associated malnutrition is not recognized, most patients whose nutritional status often deteriorates on discharge back to the community, where their chance of readmission is significantly higher.
The management of Malnutrition does not require high technology or expensive intervention. The vast majority of the patients would be helped by ensuring that they receive adequate quantities of proper food and beverages while in the hospital.
In Bangladesh no study has been conducted to assess the nutritional status of hospital admitted patients. Nutritional assessment and supplementation is not a routine activity in many of the hospitals. Nutritional assessment of the patients is not carried out routinely during hospital admission. Irrespective of the nutritional status all the patients are provided with the same diet from the central cafeteria. Though the quality of curative care has improved tremendously over the decade, there is hardly any stress on nutritional management of the patients. There is neither hardly any improvement in diets of the patients nor any health educational activity in the hospitals regarding the nutritional promotion.
In Bangladesh, a number of studies have been carried out to find out the prevalence of malnutrition in children. However, the prevalence of malnutrition in adult hospitalised population has not been studied in the past.
Therefore, the problem of malnutrition in hospital in Bangladesh has remained largely un recognized and unknown. In this study we seek to determine the prevalence of malnutrition in patients during hospital admission. If a large number of patients are found to be undernourished, individualized nutritional supplementation and nutritional education would not only shorten the hospital stay and overall cost but also the overall well being and ultimate outcome of the patients. Ultimately, this study will guide the health policy makers to design nutritional intervention for the admitted hospital patients.
Rationale of the study:
Malnutrition is common in our part of the world. Though numerous studies have been carried out to find out the extent of malnutrition in children in Bangladesh, not a single study has been done to find out its burden in adult hospitalized population. However several studies in western countries have revealed that the nutritional status of a patient during hospital admission influences the outcome of the patient, and nutritional intervention during hospital stay improves the outcomes. However, in Bangladesh, very little importance is given to the nutritional support of a patient during hospital stay. There is no routine nutritional intervention or counseling during the stay.
Therefore, this study was carried out to establish the prevalence of malnutrition in patients during hospital admission in a tertiary care hospital in Bangladesh. If the study revealed high prevalence of malnutrition, nutritional supplementation to hospitalized patients would not only shorten the hospital stay and overall cost but also the overall well being and ultimate outcome of the patients. The hospital could also introduce routine nutritional intervention and counseling to the admitted patients. Ultimately, this study would guide the policy makers to introduce nutritional interventional program for hospitalized patients throughout Bangladesh.
Literature review:
Nutrition may be defined as “the science of food and its relationship to health” . It is primarily concerned with the role of nutrients in body growth, development and maintenance. The word nutrient or food factor is used for specific dietary constituents as protein, carbohydrate, vitamin, minerals etc. Good nutrition means maintaining a nutritional status that enables us to grow well and enjoy good health. The subject of nutrition is very extensive. Great advances have been made during last 50 years in knowledge of nutrition and in the practical application of that knowledge. Specific nutritional diseases were identified and technologies developed to control them, while attention was concentrated on nutrition deficiency diseases the first decade of century, the science of nutrition was extending its influence on other fields such as: agriculture, animal husbandry, economics and sociology.Significant advances have been made during the past two decades. The associations of nutrition with infection, immunity, fertility, maternal and child health and family health have engaged scientific attention
In global campaign of “health for all”, promotion of proper nutrition is one of the major elements of primary health care. Different nutritional indicators have been developed to monitor health for all.
Assessment of the nutritional status
Nutritional assessment is a structured way to establish nutritional status and energy-requirements by objective measurements and whereby, completed with objective parameters and in relation to specific disease-indications, an adequate (nutritional-) treatment can be developed for the patient. All this happens preferably in a multidisciplinary setting. Nutritional status can be measured for individuals as well as for populations. Accurate measurement of individual nutritional status is required in clinical practice. Population measures are more important in research. They can be used to describe nutritional status of the group, to identify populations or population segments at risk for nutrition-related health consequences, and to evaluate interventions.
Goals of nutritional assessment:
- To identify individuals or population groups who are already malnourished
- To identify individuals or population groups who are at risk of becoming malnourished
- To develop health care programs that meet the community needs
- To assess the effectiveness of nutritional programs and interventions once initiated
Characteristics of ideal nutritional assessment:
An ideal index of nutritional status, for any age group, should meet the following requirements:
- It must be correlated with body fat and protein stores.
- It must be correlated with health or functional outcomes.
- It must be simple to obtain and interpret in the field.
- It must also be accurate (close to the true value), valid (represent what it is thought to represent) and precise (repeatable).
- It must be sensitive and specific
Ideal methods are sensitive and specific. Unfortunately, it is difficult to achieve both in the assessment of nutritional status. Sensitivity refers to the ability of a technique to correctly identify those affected by a condition (for example, undernutrition) as having that condition. Specificity refers to the ability of a technique to correctly classify normal individuals as having normal nutritional status.
There are various assessment methods. They are:
A Direct Methods:
These methods deal with the individual and measure objective criteria. These include:
- Anthropometric methods
- Clinical methods
- Biochemical methods
- Dietary evaluation methods
B Indirect methods:
These methods use community health indices that reflect nutritional influences. These include:
- Vital health statistics such as infant and under 5 mortality and fertility index
- Economic factors such as per capita
- Ecological variables like crop production.
Anthropometric methods:
Anthropometry is the measurement of height, weight and proportions. It is an essential component of examination of infants children and pregnant women. It is used to evaluate both over and under nutrition. The values do not differentiate between acute and chronic changes. Anthropometric approaches are, for the most part, relatively non-invasive methods that assess the size or body composition of an individual. Other anthropometric measurements are:
- Mid-arm circumference
- Skin fold thickness
- Head circumference
- Hip/waist ratio
- Head/chest ratio
Anthropometry in children:
Accurate method of height and weight is essential after which the results can be used to evaluate the physical growth of a child. For growth monitoring the data can be plotted on growth charts over a period of time. Growth charts have been developed to allow researchers and clinicians to assess weight-and height-for-age, as well as weight-for-height. For children, low height-for-age is considered stunting, while low weight-for-height indicates wasting.
In addition to weight and height, measures of mid-arm circumference and skinfold measured over the triceps muscle at the mid-arm are used to estimate fat and muscle mass. The MUAC measurement requires little equipment and is easy to perform even on the most debilitated individuals.
Head circumference can be used in children 36 months and younger to monitor brain growth in the presence of malnutrition.
Measuring children’s growth:
The primary index of growth, used universally, is weight for age. At any particular age, the infant’s or the child’s weight (unclothed) is compared against a reference, a sort of standard to see if its weight is at, below or above the average. If it is far off the average, percentile lines on the reference graph will show how it compares with the reference population. The most used weight-for-age set is probably the US CDC growth reference. There are also separate graphs for boys and girls from birth to 36 months. One reason for the separate graphs is that infants are weighed more frequently, so a broader horizontal scale is needed. The other is that infants’ stature is measured lying down and length is 1.0 –2.0 cm longer than height.
In weight-for-age graphs, the average is the 50th percentile (i.e. median) of the reference sample. An individual’s difference up or down from this median can be read firstly from the percentile lines. A second way used for distance from the median is the standard deviation or Z-score above or below the median. A There is little difference in weight for age of modern children of the privileged class between different countries and ethnic groups. The reference data can thus be used internationally. If a child is somewhat heavy for age (say 80th percentile) or light (say 20th percentile), this does not mean overnutrition or undernutrition. The child may be larger (taller) or smaller (shorter) than average. The weight has to be judged against the height (or length).
Length-for-age (for infants) and stature-for-age references will show if a child’s longitudinal growth is taller or average, or shorter than the reference population. In developing countries, stunting is an important measure of poor nutrition and/or other adverse environment. It is usually defined as 2 standard deviations below the international median reference height for age, i.e. a Z-score of 2. Excessive thinness or wasting is recognized anthropometrically from weight-for-height of 2 standard deviations below the median for age, i.e. a Z-score of 2.This shows the value of simple anthropometry in monitoring the world nutrition situation. In adolescence, the growth references have to be used cautiously because there is a growth spurt around the time of puberty followed by slowing of growth, and some girls mature early and some late, with about 5 years between their peaks. There is the same sort of range in peak height velocity in boys.
When a patient is admitted in the hospital with some kind of illness or injury, it may compromise his or her vital organs or tissues. The condition may worsen if there is any alarming incidence of undetected severe malnutrition occurred in hospitalized patients. Therefore to combat this unnecessary morbidity and mortality, a thorough awareness of the nutritional and metabolic status of the hospitalized patient and a complete assessment of the body’s various compartments should be adequately addressed and any nutritional depletion must be quickly relieved.
Body Mass Index (BMI)
The body mass index (BMI) is a statistical measure which compares a person’s weight and height. Though it does not actually measure the percentage of body fat, it is used to estimate a healthy body weight based on a person’s height. During to its ease of measurement and calculation, it is the most widely used diagnostic tool to identify weight problems within a population, usually whether individuals are underweight, overweight or obese. It was invented between 1830 and 1850 by the Belgian polymath Adolphe Quetelet during the course of developing “social physics”. Body mass index is defined as the individual’s body weight divided by the square of his or her height. The formulae universally used in medicine produce a unit of measure of kg/m2. BMI can also be determined using a BMI chart,which displays BMI as a function of weight (horizontal axis) and height (vertical axis) using contour lines for different values of BMI or colours for different BMI categories.
Steps to measure BMI:
Measurement of weight:
- We should make sure the scale pointer is at zero before taking a measurement.
- The person is required to dress in light clothes and take off shoes. Women should remove scarf.
- He/she must stand straight and unassisted on the centre of the balance platform.
- The weight should be recorded to the nearest 0.1kg.
Measurement of height:
- The person is required to remove his/her shoes, stand erect, looking straight in a horizontal plane with feet together and knees straight. The heels, buttocks, shoulder blades and the back of the head should touch against the wall.
- Height should be recorded to the nearest 0.5cm.
Calculation of Body Mass Index (BMI):
- Convert cm to meters ( 1 metre = 100 cm)
- Calculate BMI using this formula: BMI = Weight in kilograms/(Height in m2)
Usage
While the formula for BMI dates to the 19th century, the term “body mass index” for the ratio and its popularity date to a 1972 paper by Ancel Keys, which found the BMI to be the best proxy for body fat percentage among ratios of weight and height, the interest in measuring body fat being during to obesity becoming a discernible issue in prosperous Western societies. BMI was explicitly cited by Keys as being appropriate for population studies, and inappropriate for individual diagnosis. Nevertheless, due to its simplicity, it came to be widely used for individual diagnosis, despite its inappropriateness. BMI provided a simple numeric measure of a person’s “fatness” or “thinness”, allowing health professionals to discuss over- and under-weight problems more objectively with their patients. However, BMI has become controversial because many people, including physicians, have come to rely on its apparent numerical authority for medical diagnosis, but that was never the BMI’s purpose; it is meant to be used as a simple means of classifying sedentary (physically inactive) individuals with an average body composition. For these individuals, the current value settings are as follows: a BMI of 18.5 to 25 may indicate optimal weight; a BMI lower than 18.5 suggests the person is underweight while a number above 25 may indicate the person is overweight; a BMI below 17.5 may indicate the person has malnutrition, anorexia nervosa or
a related disorder; a number above 30 suggests the person is obese (over 40, morbidly obese).
For a given height, BMI is proportional to weight. However, for a given weight, BMI is inversely proportional to the square of the height. So, if all body dimensions double, and weight scales naturally with the cube of the height, then BMI doubles instead of remaining the same. These results in taller people having a reported BMI that is uncharacteristically high compared to their actual body fat levels. In comparison, the Ponderal index is based on this natural scaling of weight with the third power of the height. However, many taller people are not just “scaled up” short people, but tend to have narrower frames in proportion to their height. It has been suggested that instead of squaring the body height (as the BMI does) or cubing the body height (as the Ponderal index does), it would be more appropriate to use an exponent of between 2.3 and 2.7.
BMI Prime
BMI Prime, a simple modification of the BMI system, is the ratio of actual BMI to upper limit BMI (currently defined at BMI 25). As defined, BMI Prime is also the ratio of body weight to upper body weight limit, calculated at BMI 25. Since it is the ratio of two separate BMI values, BMI Prime is a dimensionless number, without associated units. Individuals with BMI Prime < 0.74 are underweight; those between 0.74 and 0.99 have optimal weight; and those at 1.00 or greater are overweight. BMI Prime is useful clinically because individuals can tell, at a glance, by what percentage they deviate from their upper weight limits. For instance, a person with BMI 34 has a BMI Prime of 34/25 = 1.36, and is 36% over his or her upper mass limit. In Asian populations (see International Variation section below) BMI Prime should be calculated using an upper limit BMI of 23 in the denominator instead of 25. Nonetheless, BMI Prime allows easy comparison between populations whose upper limit BMI values differ.
Categories
A frequent use of the BMI is to assess how much an individual’s body weight departs from what is normal or desirable for a person of his or her height. The weight excess or deficiency may, in part, be accounted for by body fat (adipose tissue) although other factors such as muscularity also affect BMI significantly (see discussion below and overweight). The WHO regards a BMI of less than 18.5 as underweight and may indicate malnutrition, an eating disorder, or other health problems, while a BMI greater than 25 is considered overweight and
above 30 is considered obese. These ranges of BMI values are valid only as statistical categories when applied to adults, and do not predict health.
BMI is used differently for children. It is calculated the same way as for adults, but then compared to typical values for other children of the same age. Instead of set thresholds for underweight and overweight, then, the BMI percentile allows comparison with children of the same sex and age. A BMI that is less than the 5th percentile is considered underweight and above the 95th percentile is considered obese for people 20 and older. People under 20 with a BMI between the 85th and 95th percentile are considered to be overweight.
Recent studies in Britain have indicated that females between the ages 12 and16 have a higher BMI than males of the same age by 1.0 kg/m2 on average.
International variations
The range of normal BMI may vary from time to time and country to country, making global, longitudinal surveys problematic. In 1998, the U.S. National Institutes of Health brought U.S. definitions into line with World Health Organization guidelines, lowering the normal/overweight cut-off from BMI 27.8 to BMI 25. This had the effect of redefining approximately 25 million Americans, previously “healthy” to “overweight”. It also recommends lowering the normal/overweight threshold for South East Asian body types to around BMI 23, and expects further revisions to emerge from clinical studies of different body types.
Japanese Definition
Singapore
In Singapore, the BMI cut-off figures were revised in 2005 with an emphasis on health risks instead of weight. Adults whose BMI is between 18.5 and 22.9 have a low risk of developing heart disease and other health problems such as diabetes. Those with a BMI between 23 and 27.4 are at moderate risk while those with a BMI of 27.5 and above are at high risk of heart disease and other types of health problems.
Statistical device
The Body Mass Index is generally used as a means of correlation between groups related by general mass and can serve as a vague means of estimating adiposity. The duality of the Body Mass Index is that, whilst easy-to-use as a general calculation, it is limited in how accurate and pertinent the data obtained from it can be. Generally, the Index is suitable for recognizing trends within sedentary or overweight individuals because there is a smaller margin for errors.
This general correlation is particularly useful for consensus data regarding obesity or various other conditions because it can be used to build a semi-accurate representation from which a solution can be stipulated, or the recommended daily allowance (RDA) for a group can be calculated. Similarly, this is becoming more and more pertinent to the growth of children.
Clinical practice
BMI has been used by the WHO as the standard for recording obesity statistics since the early 1980s. In the United States, BMI is also used as a measure of underweight, owing to advocacy on behalf of those suffering with eating disorders, such as anorexia nervosa and bulimia nervosa. BMI can be calculated quickly and without expensive equipment. However, BMI categories do not take into account many factors such as frame size and muscularity39. The categories also fail to account for varying proportions of fat, bone, cartilage, water weight, and more.40
Limitations and shortcomings
Some argue that the error in the BMI is significant and so pervasive that it is not generally useful in evaluation of health. University of Chicago political science professor Eric Oliver says BMI is a convenient but inaccurate measure of weight, forced onto the populace, and should be revised.
The medical establishment has generally acknowledged some shortcomings of BMI. Because the BMI is dependent only upon weight and height, it makes simplistic assumptions about distribution of muscle and bone mass, and thus may overestimate adiposity on those with more lean body mass (e.g. athletes) while underestimating adiposity on those with less lean body mass (e.g. the elderly).
A 2005 study in America showed that overweight people had a similar relative risk of mortality to normal weight people as defined by BMI. In an analysis of 40 studies involving 250,000 people, patients with coronary artery disease with normal BMIs were at higher risk of death from cardiovascular disease than people whose BMIs put them in the “overweight” range (BMI 25–29.9). In the intermediate range of BMI (25–29.9), BMI failed to discriminate between body fat percentage and lean mass. The study concluded that “the accuracy of BMI in diagnosing obesity is limited, particularly for individuals in the intermediate BMI ranges, in men and in the elderly. These results may help to explain the unexpected better survival in overweight/mild obese patients.”.
A further limitation relates to loss of height through aging. In this situation, BMI will increase without any corresponding increase in weight.
A study by Romero-Corral et al., using data representing non institutionalized civilians in the United States, found that BMI-defined obesity was present in 19.1% of men and 24.7% of women, but that obesity as measured by body fat percentage was present in 43.9% of men and 52.3% of women.
As a possible alternative to BMI, the concepts fat-free mass index (FFMI) and fat mass index (FMI) were introduced in the early 1990s43.
Mid upper Arm Anthropometry
The anthropometry of the upper arm is a set of measurements of the shape of the upper arms. The principle anthropometry measures are the upper arm length, the triceps skin fold (TSF), and the (mid-) upper arm circumference (M UAC). The derived measures include the (mid-) upper arm muscle area, the (mid-) upper arm fat area, and the arm fat index. Although they are not directly convertible into measures of overall body fat weight and density, and research has questioned the connection between skin fold fat and deep body fat measurements, these measures are and have been used as rough indicators of body fat.
Measures
The anthropometric measures of the upper arm are divided into principal measures, which are measured directly, and derived measures, which are derived from the principal measures using specific formulae and empirically derived corrections. The derived measures attempt to provide better indicators of body composition and nutritional status than the principal measures, by accounting for the fact that external measurements of the arm necessarily compound measurements of bone, fat, and muscle.
Principal measures
The three principal anthropometric measures of the upper arm are the upper arm length; the triceps skin fold, and the mid-upper arm circumference (MUAC). The triceps skin fold is the width of a fold of skin taken over the triceps muscle. It is measured using skin fold callipers. The measurement is taken at a standardized position (one of eight standard skin fold measurement points) at the midpoint of the back of the upper arm.
The skin fold callipers are spring-loaded. Holtain skin fold callipers are marked with 0.2 mm gradation, Lange callipers with 0.5 mm gradation.
The mid-upper arm circumference is the circumference of the upper arm at that same midpoint, measured with a non-stretchable tape measure.
Evaluation
The various measures are evaluated against anthropometric reference data tables, such as those derived from the National Health and Nutrition Examination Survey data.
Correlation
The various measures have been shown to have correlation to other measurements of body fat, including those derived from X-ray absorptiometry.
However, the relationship between measurements of subcutaneous fat in skin folds, such as the triceps skin fold and deep body fat has been questioned. Early research in the 1960s found a positive correlation between the two, and the skin fold measurements do provide a[xlviii].reasonable estimate of the deep body fat. However, research in the 1980s used computed tomography to measure deep fat, and showed a lack of correlation between that and subcutaneous fat. However, for children and adolescents the skin fold and circumference measurements provide a fair assessment of total body fat because that is where most body fat lies during those stages of human growth.
Dietary Approach to Nutritional Status Assessment:
Several techniques exist for collecting dietary data with which to estimate nutritional status. Because these techniques vary in cost for data collection, burden on the respondent, and which aspects of diet they are designed to measure, it is important to clearly specify the goals of dietary assessment of nutritional status before choosing an assessment strategy.
The primary consideration in choosing a dietary assessment method is the specific type of data needed. Is the research intended to document intake of “foods” or of “nutrients”? If the answer is foods, the method must take account of the population’s food ways. These include variability in food intake patterns (for example, day-today, seasonal, ritual cycles); differences in food consumption by sex, age, and ethnicity; and what items the population considers to be legitimate “food.” If the objective is to measure nutrient intake, the method must take into account several additional factors: food preparation techniques, including the addition of condiments and the effects of the technique on nutrient composition of the food; sources of error in the determination of amounts of foods consumed; differentiation distribution of nutrients among foods; and the contribution of “non-food” consumption (such as betel nut, laundry starch, and vitamin and mineral supplements) to total nutrient consumption.
There are many ways to document dietary intake. The accuracy of the data is frequently challenged, however, since both questioning and observing can impact the actual intake. During a nutrition interview the practitioner may ask what the individual ate during the previous twenty-four hours, beginning with the last item eaten prior to the interview. Practitioners can train individuals on completing a food diary, and they can request that the record be kept for either three days or one week. Documentation should include portion sizes and how the food was prepared. Brand names or the restaurant where the food was eaten can assist in assessing the details of the intake. Estimating portion sizes is difficult, and requesting that every food be measured or weighed is time-consuming and can be impractical. Food models and photographs of foods are therefore used to assist in recalling the portion size of the food. In a metabolic study, where accuracy in the quantity of what was eaten is imperative, the researcher may ask the individual to prepare double portions of everything that is eaten—one portion to be eaten, one portion to be saved (under refrigeration, if needed) so the researcher can weigh or measure the quantity and document the method of preparation.
Food frequency questionnaires are used to gather information on how often a specific food, or category of food is eaten. The Food Guide Pyramid suggests portion sizes and the number of servings from each food group to be consumed on a daily basis, and can also be used as a reference to evaluate dietary intake.
During the nutrition interview, data collection will include questions about the individual’s lifestyle—including the number of meals eaten daily, where they are eaten, and who prepared the meals. Information about allergies, food intolerances, and food avoidances, as well as caffeine and alcohol use, should be collected. Exercise frequency and occupation help to identify the need for increased calories. Asking about the economics of the individual or family, and about the use and type of kitchen equipment, can assist in the development of a plan of care. Dental and oral health also impacts the nutritional assessment, as well as information about gastrointestinal health, such as problems with constipation, gas or diarrhea, vomiting, or frequent heartburn.
Waist circumference:
The metabolic complications of overweight and obesity, have been found to be more likely if some of the adipose tissue is specially concentrated inside the abdomen (in the omentum, mesentery, etc.). This abdominal or visceral obesity can be estimated with a simple tape measure around the waist. Waist circumference correlates quite closely with BMI. Some authorities prefer measurement of the waist/hip ratio to allow for people with a heavy frame but it is more complicated to do and does not seem to have better predictive value.
WHO recommendations for Caucasians:
Risk of metabolic Waist circumference
complications (cm)
Men Women
Increased ≥ 94 ≥ 80
Severely increased ≥102 ≥88
Biochemical methods:
Biochemical methods are an essential part of nutritional assessment. Anthropometry mostly reflects undernutrition or overnutrition, too little or too much food energy. Biochemical tests are needed to demonstrate micronutrient status.
I. Measurement of nutrient concentration in the blood eg. estimation of serum iron
2. Measurement of the urinary excretion of a nutrient eg. Iodine excretion in urine
3. Measurement of the urinary metabolites of a nutrient
4. Detection of abnormal metabolites in urine or blood resulting from a nutrient deficiency.
5. Measurement of changes in blood constituents or enzyme activities which are dependent upon
6. Measurement of ‘tissue specific’ chemical markers.
7. Saturation, loading and isotope tests.
The disadvantage with biochemical assessment is that each test costs money, for collecting the blood or urine, for the equipment and chemicals, and the skilled laboratory worker’s time, and for reporting and interpreting the test. So tests have to be selected, based on the situation and the subject, that are likely to yield useful results.
Clinical Examination:
This includes history and physical examination. Clinical data provides information about the individual’s medical history, including acute and chronic illness and diagnostic procedures, therapies, or treatments that may increase nutrient needs or induce malabsorption . Current medications need to be documented, and both prescription drugs and over-the-counter drugs, such as laxatives or analgesics, must be included in the analysis. Vitamins , minerals , and herbal preparations also need to be reviewed. Physical signs of malnutrition can be documented during the nutrition interview and are an important part of the assessment process. They are anaemia, sparse thin hair, smooth glossy tongue, coarse skin etc.
Subjective global assessment (SGA)
Subjective global assessment (SGA) is a clinical technique that assesses nutritional status based on features of the history and physical examination
Illustration is taken with courtesy from Journal of Parenteral and Enteral Nutrition: 11:8‐13, 1987; What is Subjective Global assessment of Nutritional Status By Allan S. Detsky.
A study was conducted in 202 hospitalized patients before gastrointestinal surgery to determine whether clinicians’ SGA ratings were influenced by the individual clinical variables or not. To determine the variable which affected the rating most, multivariate analysis was done and it showed that loss of subcutaneous tissue, muscle wasting, and weight loss were the variables affected the rating most. In consideration to inter-observer variation, a high degree of inter-observer agreement was found (kappa = 0.78%, 95% confidence interval 0.624 to 0.944, p < 0.001).20 Therefore, the authors concluded that SGA can be included in the academically taught courses for the variety of clinicians and is reproducible.
Another nutritional assessment tool that can be used is the creatinine height index. A study on nutritional assessment measurements on 40 healthy young and elderly males and females revealed creatinine height index as a good predictor of reductions in lean body mass in malnourished young males rather than in young females. Besides, to assess the relation of creatinine excretion to total arm length could predict malnutrition in young females and in elderly males. It was also found out that percentage ideal body weight and arm muscle circumference were of limited value in detecting malnutrition whereas triceps skin fold thickness was only useful in elderly females. By measuring anemia by Hb status, total iron-binding capacity and serum albumin they finally found that serum albumin is the best predictor of malnutrition in any age group.21
A review on the recent medical literature on the association between hospital length of stay and nutritional status revealed simple anthropometric parameters underestimate the nutritional risk in hospitalized patients, the malnutrition universal screening tool and nutritional risk screenings are simple screening tools that can identify patients requiring further monitoring. Recent weight loss appears to be the most important single indicator of nutritional status.
Body composition measurements identify patients with muscle mass depletion and excess body fat, both of which are significantly associated with increased length of stay. The Subjective Global Assessment is useful at detecting patients with established malnutrition and the mini nutritional assessment for the elderly is useful at detecting patients who need preventive nutritional measures. The Nutritional Risk Index, which incorporates albumin and weight loss, captures both nutritional risk and poor clinical outcome.22 Therefore to summarize; nutritional screening and assessment tools depend on the type of institution, the patient populations and the resources available.
A study was conducted in Clinical Pathology Department in the University of Genoa for measuring the incidence of malnutrition and the effect of hospitalization in 100 consecutive admissions. Nutritional deficiencies were evaluated at the time of admission and discharge from the hospital, among patients hospitalized 2 weeks or longer, using the following nutrition related parameters: body fat, muscle proteins, weight, rate of weight loss, plasma proteins level, vitamin B12 and folic acid plasma level, plasma iron and ferritin, relation to appetite decrease and to pathological status. During admission in the hospital, the findings showed a high incidence (79%) of alterations in some nutritional parameters.In patients with nutritional impairments they observed a worsening of most of the nutritional parameters during hospitalization, especially in patients with severe appetite decrease and those affected by sepsis, neoplastic, gastric and renal diseases.
In another study several simple, economical parameters were used to evaluate the nutritional status upon admission and upon leaving the hospital of all the patients who in the course of a year occupied four randomly chosen beds in a general surgery ward at a county hospital in the Valencian Community. A significant percentage of the patients admitted to the hospitals showed signs of malnutrition that are neither detected nor treated and often become more severe during the hospital stay that can contribute to the loss of some important functions as, for instance the capacity for immune response and healing. The results showed that hospitalization reduced the number of overweight patients, doubled the number of hypoalbuminemics and tripled the number of people with body weight and body mass index (BMI) below normal levels. Fifty seven percent of the patients suffer some kind of postoperative complication and this incidence is higher among patients with malnutrition upon admission. The most common complication is the nosocomial pneumonia and urine infection. The nutritional parameters that best predict possible postoperative complications are low values of serum albumin, total lymphocyte count, triceps fat skin fold and arm circumference. 24 In general, postoperative complications show only a slight positive correlation with the length of the hospital stay, but the longer the stay, the worst the nutritional status becomes.
A study enrolled 400 patients within 48 hours of admission selected at random using a computer software program and was to assess the nutritional status of patients admitted to a university-affiliated hospital in Spain using anthropometric data (body mass index, triceps skin fold thickness, and upper arm muscle circumference) and by the SGA technique. Using anthropometric data, patients were considered to have normo nutrition or malnutrition. Those with malnutrition were subdivided in patients with low (under nutrition) or high (over nutrition) body weight. Through SGA patients were classified as having normo-nutrition or malnutrition (moderate and severe). Secondary endpoints were hospital length of stay (LOS), mortality, and readmissions (total and non-elective readmissions) over the next 6 months. Overall population, patients scheduled admitted, patients admitted from emergency room, and those with any cancer were individually analyzed.The frequency of malnutrition varied from 72.7% assessed by anthropometry (under nutrition in 26.7% and over nutrition in 46.0%), to 46% using SGA. Malnutrition was not related to the type of admission neither to the diagnosis of cancer. Of 400 patients analyzed, two patients died (0.5%).21 Using SGA, LOS was significantly higher in patients with malnutrition vs. those with normo nutrition, in the overall population and in patients scheduled admitted, and there were more total and non-elective readmissions in patients with malnutrition than in patients with norm nutrition in the overall population, in patients scheduled admitted and in those with cancer.25 When they used anthropometric data, LOS was superior in under-nutrition compared to normo- and over- nutrition in scheduled admitted patients alone. Although there were more total readmissions in under nutrition than in normo-nutrition and over-nutrition in overall population, no significant differences were observed with the non-elective readmission rate. A high prevalence of malnutrition was found in this study. At a time, a high prevalence of over- nutrition was observed. Anthropometric data and SGA technique are not concordant, reflecting the limitations of markers of nutritional status.25 While with SGA malnutrition was detected in patients with normal to high BMI, with anthropometry over nutrition was diagnosed. SGA seems to be more accurate than anthropometry to anticipate hospital LOS and readmission rate. During to the increased LOS and readmission rates found in patients with malnutrition, further steps among health care professionals are warranted to identify and control them.
A multi-center study on randomized population of 213 hospitalized patients (112 males and 101 females) from nine hospitals evaluated the prevalence of malnutrition and the relationship of different nutritional markers to length of hospital stay and mortality.[lv] The nutritional status of the patients was assessed by nutrition specialists in each nutrition unit. The mean age of the patients was 73.5+/-15 years. Their mean weight was 63.5+/-14.5 kg, BMI 25.9+/-6.1, and weight loss in the previous 3 months 4.2+/-6.6 kg.
The mean length of hospital stay was 19.6+/-62.5 days. The prevalence of malnutrition, assessed by means of a mini-nutritional assessment (MNA) test, was 23.9% (score under 17 points), and 50.2% of the patients were at risk of malnutrition (score between 17 and 23.5). An analysis correlating length of hospital stay (LOS) and predictive parameters in the entire group showed a positive association with MNA score (r=-0.23; p<0.05).26 In multivariate analysis with LOS (days) as dependent variable and albumin, weight loss, weight, and MNA score as independent variables, after adjusting for age and sex, only weight loss and MNA score remained independent predictors in the model (F=4.6; p<0.05). There was an increase of 2.6 days in LOS (95% CI: 0.7-4.5) for each decrease of 1 kg, and a decrease of 3.2 days (95% CI: -5.6-0.6) for each increase of 1 point in MNA score.26
Methodology;
Aims and objectives
General objective:
- To determine the prevalence of malnutrition in adult patientsduring admission in the hospital.
Specific Objectives:
- To determine the weight and height of individual patients within 24 hours of hospital admission.
- To determine the mid arm circumference of the patients within 24 hours of hospital admission.
- To calculate and compare the BMI of the patients with the standard charts and identify malnourished individuals.
- To find out specific diseases associated with malnutrition.
Type of study: Observational, cross sectional study.
Place of study: The study was carried out in Department of Gastroenterology and Medicine BSMMU, Dhaka, Bangladesh
Period of study: From Jan 2010 to July 2010.
Study population: 202 Patients admitted in the wards of Department of Gastroenterology and Internal Medicine of BSMMU, Dhaka, Bangladesh were included
Sampling: Non-probability, convenient sampling.
Sample size: Using the precision based calculation, minimum sample size required at 5% level of significance and 95% confidence level was:
z2pq
n ≥ _______
e2
Where, Z = 1.96, which is constant
p = Prevalence, which is not known as prevalence of malnutrition in hospitalised patients in Bangladesh is unknown. So it is taken to be 50%.
q = 1-P
e = Acceptable error, which is 10% of P
According to this formula, the minimum sample size is 384. However, due to time constraint for the study 202 patients were assessed.
Patient selection
Patients admitted in the Department of Gastroenterology and Internal Medicine for any diseases were included in the study.
Inclusion criteria
- Patients aged more than 15 years of both sexes admitted to the inpatient department of gastroenterology and Internal medicine were included for the study.
Exclusion criteria
- Patients admitted only for day care and any patients less than 15 years in the above departments were excluded from the study
Data collection instruments
- History taking using standard data collection sheet
- Anthropometric measurements.
Method
Consecutive admissions in each of two disciplines, Medicine and Gastroenterology were included in the study. Patients admitted as day cases were excluded. Each patient’s nutritional status was determined from history and anthropometric data. Height was recorded from case notes where available or measuredusing a measuring tape. Weight was measured with a bathroom scale. Height and weight were used to determine body mass index (weight (kg)/(height (m))2). Mid-arm circumference (cm) was measured with a tape measure. All heights, weights and arm circumference were measured using the same equipments for all the patients.
Data processing and analysis
Data from the study was analyzed using computer based Microsoft excel program and simple frequency distribution table.
Data presentation
Data and results were presented in the form of table and diagram where applicable.3.15 Ethical consideration
Verbal consent was taken after adequate counselling of the patients about the study. All data were kept confidential by the investigator. In no part of the study the names of the patients were reflected. No sensitive questions were
Hypothesis:
The prevalence of malnutrition in hospitalized patients in Bangladesh is higher than that of developed countries.
RESULTS AND OBSERVATION
Sex distribution:
The total sample available for the study within the stipulated time was 202. Among them 56% patients were male and 44% were female.
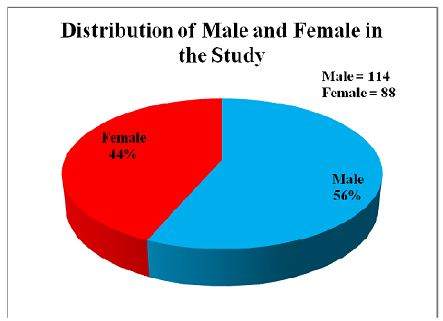
Figure : Distribution of male and female patients in the study population
Age Distribution of the patients:
Among 202 patients 13.8% patients belonged to age group 11-20 years, 20.8% were of 21-30 years, 12.9% were 31 – 40 years, 19.8% were 41 – 50 years, 16.8% were 51-60 years, 12.9% were from 61 – 70 years and 2.9% from over 70 years age. Highest number of patients belonged to 21 – 30 years age group followed by 41 – 50 years group. The lowest number belonged to over 70 years age group.
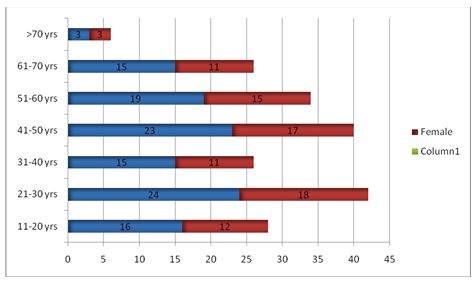
Figure2: Age and sex distribution of the study population
Age distribution in different Gastro-intestinal disease
Table: Age Distribution of the study population in different diseases [n = 202]
| Age (in year) | CLD | TB | Lymphoma | Carcinoma | Others | Total |
| 11 – 20 | 6 | 10 | 2 | 0 | 10 | 28 |
| 21 – 30 | 4 | 14 | 10 | 5 | 9 | 42 |
| 31 – 40 | 11 | 4 | 0 | 0 | 11 | 26 |
| 41 – 50 | 18 | 2 | 4 | 5 | 11 | 40 |
| 51 – 60 | 10 | 8 | 0 | 10 | 6 | 34 |
| 61 – 70 | 6 | 6 | 0 | 10 | 4 | 26 |
| > 70 | 2 | 0 | 2 | 0 | 2 | 6 |
Patients were subdivided to five groups according to admission frequency in the hospital. They are Chronic Liver Disease (CLD), Intestinal Tuberculosis (TB), Intestinal lymphoma, Carcinoma in the Gastro-intestinal tract. The rest of the diseases were kept in others group.
Disease distribution in study population
Table : Distribution of disease in the study population [n = 202]
| Number | Percentage (%) | |
| Chronic Liver Disease (CLD) | 57 | 28.2 |
| Intestinal Tuberculosis | 44 | 21.8 |
| Intestinal lymphoma | 18 | 8.9 |
| Carcinoma in the Gastro-intestinal tract | 30 | 14.9 |
| Others | 53 | 26.2 |
Among the hospitalised patients for different diseases, the most common was chronic liver disease (28.2 %). It was followed by intestinal tuberculosis. The gastrointestinal malignancy comprised the least.
Major clinical Feature in the Patients:
Table : Distribution of different clinical features among the patients [same patient may have multiple features]
| CLD | TB | Lymphoma | Carcinoma | Others | Total | |
| Ascities | 29 | 8 | 0 | 6 | 2 | 45 |
| Jaundice | 20 | 0 | 1 | 8 | 12 | 41 |
| Diarrhoea | 3 | 10 | 9 | 3 | 6 | 31 |
| Anorexia | 12 | 7 | 1 | 13 | 7 | 40 |
Major clinical features which were specific for gastro-intestinal patients were recorded. They were ascites, jaundice, diarrhea and anorexia. Ascites was the most common clinical feature among all the admitted patients followed by Jaundice and anorexia. Diarrhea was the least common clinical feature among the admitted patients. Their distribution according to diseases was described in table 3. Please note that each patient was allowed multiple answers.
Prevalence of Malnourished Patients among the hospital admitted patients:
Table : Prevalence of malnourished patients
| Number of patients | Malnourished patients | Percentage (%) | |
| CLD | 57 | 17 | 29.8 |
| Intestinal TB | 44 | 19 | 43.2 |
| lymphoma | 18 | 5 | 27.8 |
| Carcinoma | 30 | 11 | 36.7 |
| Others | 53 | 14 | 26.4 |
| Total | 202 | 66 | 32.7 |
*Patient with BMI less than 18.5 are considered as malnourished]
At the beginning, all the patients who were admitted as inpatients were recorded for weight and height. So BMI of all the patients were calculated. Thus prevalence of malnutrition in admitted patients were recorded. Of them, 32.7% of the admitted patients were malnourished. Among them, 29.8% chronic liver disease patients were malnourished, 43.2% of intestinal tuberculosis patients were malnourished. 36.7% patients with gastro-intestinal carcinoma patients were malnourished when they were admitted. Intestinal lymphoma patients were the lowest in number among all the malnourished patients, they were only 27.8%.
Table : Distribution of BMI and MUAC at admission
| Number | Lowest | Highest | Mean | SD | |
| BMI | 202 | 14.8 | 28.4 | 19.9 | 2.9 |
| MUAC | 202 | 15 | 34 | 22.8 | 3.4 |
The table shows the BMI and MUAC of the study subjects. The study revealed that mean BMI was 19.9 ± 2.9. The mean MUAC was 22.8 ± 3.4. The MUAC was not used as an index of malnutrition in our study. However, this could be used as future reference if further studies are carried out.
Discussion:
This study for prevalence of malnutrition involving adult hospitalized patients is the first of its kind in Bangladesh to the best of my knowledge. It involved 202 patients out of which 56% comprised of males and 44% comprised of females, indicating slightly higher proportion of males than females. The reason for this is not clear.
Inour study, highest number of admitted patients belonged to 21 – 30 years age group followed by 41 – 50 years group. This is the most productive age group and illness in this age reduces the productivity of the citizens of a country. It is also a huge economic burden to the family and the country as a whole.
The study has also revealed that 28.2% of patients had Chronic Liver Disease, 21.8% patients had intestinal tuberculosis, 14.9% had carcinoma in the gastrointestinal tract, 8.9% had intestinal lymphoma and the 26.2% patients had other diseases of gastrointestinal tract. Considering the fact that bulk of the patients were from department of Gastroenterology, the bulk of the patients had diseases of gastrointestinal tract. Further these diseases are also the causes of malabsorption and would have contributed significantly to causing malnutrition in our patients.
Amongst the clinical features, ascites was the most common among all the admitted patients followed by Jaundice and anorexia. Diarrhea was the least common clinical feature among the admitted patients. Again, considering the fact that the most common diagnosis was chronic liver disease, ascites is expected in majority of the patients. However, as the presence of ascites increased the weight of a patient and since BMI was used as the indicator of malnutrition in it would have confounded our findings. Therefore, the overall prevalence of malnutrition would be higher than what the study has revealed. Anorexia was the next symptom. This would have contributed significantly to weight loss and malnutrition in the patients. Interestingly, diarrhoea, which is one of the components of malabsorbtion, and would have contributed to malnutrition, was least common amongst the study population.
In the current study, we assessed the nutritional status of adult patients during hospital admission. The study revealed that as per BMI, 32.7 % of the patients were malnourished during the hospital admission. The BMI index cut off value we used for undernutrition was 18.5. However, in a study carried out United Kingdom in a multi disciplinary hospital the overall prevalence of under nutrition on admission to hospital was 40%59. The study had used BMI index of less than 20 as the cut off value for under nutrition. If we had used this as our cut off value the prevalence would be higher in our study. Besides, a significant number of patients in our study had ascites which would have falsely increased the weights of the patients, thereby increasing the weight falsely high BMI. Thus the true prevalence would be higher than what we have obtained.
It would be interesting to find out whether these patients had any alteration in their nutritional status during their hospital stay. This could have been done if we had measured their BMI on discharge from the hospital. However due to limited study duration, we could not do so. Logically, if the patients received appropriate treatments for their ailments, and their diseases were managed properly, their nutritional status should have improved. However, considering the fact that there was no additional nutritional supplementation or nutritional intervention on these patients the extent of improvement would be minimal. Some earlier studies in developed countries have indicated similar findings. In Britain, as in the United States, under-nutrition was prevalent and largely unrecognized in hospital patients on admission and tended to get worse during their hospital stay. If this was the scenario in those affluent countries the problem should be even bigger in developing county like ours. These hospitalised patients would have further lost their weight during their stay in the hospital because previous studies on hospitalized had revealed that patients do lose weight during hospital stay. In one of the earlier studies, weight loss during hospitalization resulted in patients’ nutritional status being re-categorized 7% of the overweight patients lost weight to within the normal weight range, while 26% of the mildly undernourished patients became moderately undernourished; and 37% of the moderately undernourished patients became severely undernourished. No patient moved from the undernourished groups to the normal or overweight groups59. In our study too, since the patients did not receive any nutritional supplementation or nutritional intervention they would have lost significant amount of weight during their hospital stay which in turn have affected the outcome and duration of hospital stay.
A study was conducted in Clinical Pathology Department in the University of Genoa for measuring the incidence of malnutrition and the effect of hospitalization in 100 consecutive admissions. Nutritional deficiencies were evaluated at the time of admission and discharge from the Hospital, among patients hospitalized 2 weeks or longer, using the nutrition-related parameters to appetite decrease and to pathological status. The findings showed a high incidence (79%) of alterations in some nutritional parameters.19 In patients with nutritional impairments they observed a worsening of most of the nutritional parameters during hospitalization, especially in patients with severe appetite.19 However in our study the change in weight according to the level of appetite of the patients was not studied and would have been useful if the appetite level and change in weight were correlated. Besides, A review on the recent medical literature on the association between hospital length of stay and nutritional status revealed simple anthropometric parameters underestimate the nutritional risk in hospitalized patients, the malnutrition universal screening tool and nutritional risk screenings are simple screening tools that can identify patients requiring further monitoring.
The importance given to diet in medical treatment has had many ups and downs in the past 300 years. Nutritional science was rudimentary in the eighteenth century. The golden period for nutrition was the 1930s, when most of the vitamins were discovered and shown to be therapeutically effective – in 1932; for example, the death rate among children with measles in a London fever hospital was reduced from 8.7% to 3.7% by a daily supplement of vitamin A from cod liver oil. Despite these proven effects of nutritional supplementation on outcome of different diseases, the present day hospital patient management has very little importance on nutritional management. This is specifically so in government hospitals in this region in general and Bangladesh in particular.
This study has used BMI as the indicator of nutritional status of the patients. This was because most of the patients were unaware of the weight loss. Few of them who did realise couldn’t quantify it. However, recent weight loss appears to be the most important single indicator of nutritional status18. One study, involving 202 hospitalized patients was conducted before gastrointestinal surgery to determine whether clinicians’ SGA ratings were influenced by the individual clinical variables or not. To determine the variable which affected the rating most, multivariate analysis was done and it showed that loss of subcutaneous tissue, muscle wasting, and weight loss were the variables affected the rating most20.
The cost of malnutrition to society is enormous. Addressing malnutrition requires an effective delivery chain that cuts across the domains of multiple national and local public agencies, the private, and the non-profit sector. Partnerships between different organizations are essential.
Conclusion
The current study demonstrates prevalence of significant malnutrition among the hospital admitted adult patients. Intestinal tuberculosis patients are the most vulnerable, followed by intestinal malignancy. Duration of stay may have important role in malnutrition. Longer stay of hospital may increase the chance of making patient with normal nutrition into a malnourished patient as there is no nutritional support in the hospital or special feeding programs in the hospital.
A lack of awareness of under nutrition is common in hospital care. The neglect of nutrition in clinical medicine has now gone too far and malnutrition during hospital stay is a major concern now a days. It adversely affects physical and psycho-social well being by predisposing to disease, adversely affecting its outcome, and reducing the likelihood of independence. Malnutrition is both a cause and a consequence of disease.
The limited amount of documented information relating to nutrition at outpatient visits and on admission to hospital highlights the continued problem of lack of awareness of nutrition. Awareness of the importance of nutritional status by treating physicians and the nurses involved in patient care may afford intervention at an earlier stage and allow nutritional status to improve during admission in the hospital hospital. This would not only improve the ultimate outcome of the patients by reducing the morbidity and mortality of the patients but also reduce the cost of health care by reducing the number of days of hospital stay.
Recommendations
- The number of study subjects in this study was inadequate to assess the burden of the problem objectively. Therefore further studies with larger sample size and involving multiple hospitals in Bangladesh including the rural hospitals may be carried out. Thus the current study is a breakthrough for further well designed multi-centric prospective studies to assess the burden of malnutrition in hospitalized patients in Bangladesh.
- This study did not evaluate the change in nutritional status of the patients during their hospital stay. The change of nutritional status of the patients during their hospital stay is another issue that could be looked into. The change in nutritional status along with the degree of appetite could also be evaluated.
- Further studies on assessment of nutritional status of hospitalized patients could use other anthropometric, clinical or biochemical parameters to assess or monitor the nutritional states of the patients
- The study included patients from Department of Medicine and Gastroenterology only where a higher number of subjects with malnutrition are expected to be admitted. A larger group including patients from other departments would give a more authentic picture of malnutrition in hospitalized patients.