1.1.Introduction
Nutritional status is the result of complex interactions between food consumption, overall health status and care practices. At the individual level inadequate or inappropriate feeding patterns lead to malnutrition. Numerous socio-economic and cultural factors influence patterns of feeding and nutritional status. Poor nutritional status is one of the most important health and welfare problems facing Bangladesh. Malnutrition is a result and cause of the social and economical underdevelopment of Bangladesh. The prevalence of malnutrition in Bangladesh is among the highest in the world. Millions of children and women suffer from one or more forms of malnutrition including low birth weight, wasting, stunting, underweight and anemia.
Malnutrition not only affects individuals but its effects are passed from one generation to the next as malnourished mothers give birth to infants who struggle to develop and thrive.
A factor that contributes to malnutrition among infants is that 50 percent of children in Bangladesh are born with low birth weight (LBW). This is caused by maternal malnutrition and high prevalence (75 percent) of anemia during pregnancy. Globally malnutrition is attributed to almost one-half of all children deaths. Survivors are left vulnerable to illness, stunted growth and lack of intelligence. If these children are girls, they often grow up to become malnourished mothers themselves.
The gift of nature is that a malnourished mother can even is able to provide enough good quality milk for the normal growth of her child, as indicated by growth pattern of exclusively breastfed infants.2 Breastfeeding also affects mothers by physiologically suppressing the return to fertility, thereby affecting the length of interval between pregnancies. UNICEF and WHO recommend that children be exclusively breastfed for the first six months of life and that children be given solid or semisolid complementary foods beginning with the seventh month of life. The standard indicator of exclusive breastfeeding is the percentage of children less than six months of age who are exclusively breastfeeding. The standard indicator of timely complementary feeding is the percentage of children age 6-9 months who are breastfeeding and receiving complementary foods. The WHO recommends that breastfeeding be continued through the second year of life.
If infants are exposed to faulty feeding and weaning practices they becomes malnourished and already LBW babies can not catch up growth. Breastfeeding and weaning practices are crucial for optimal growth and development during infancy and play a vital role in determining the optimal development of infants. Poor breastfeeding and infant feeding practices have adverse consequences for the health and nutritional status of children. This, in turn, has consequences for their mental and physical development. For example, if complementary foods are introduced inappropriately and with insufficient dietary diversity malnutrition occurs.4 After the age of two years, the effects of under nutrition are largely irreversible. Missing the “window of opportunity” – the thousand-day period from conception to two years of age – to improve nutrition can result in long-term permanent damage.
These problems are very crucial and common factors contributing to high prevalence of malnutrition in Bangladesh. From an initially disadvantaged beginning, many Bangladeshi infants briefly improve in nutritional status during the first six months of life due to near-universal breast-feeding. However after weaning at age 6 months, inadequate food intake and a high burden of diarrhoea and other diseases exert a serious toll on the nutritional status of a child. In most cases, in our country complementary foods are introduced too early or too late with insufficient quality and quantity. Although there is a national Infant and Young Child Feeding (IYCF) strategy, there is no implementation plan for that and as a result, the strategy has not led to the desired impact. UNICEF supports the National Nutrition Programme to scale-up community-based peer counseling through mothers’ support groups. An estimated 50,000 pregnant women and lactating mothers are getting counseling on Infant and Young Child Feeding (IYCF) through Mother Support Groups in ten upozillas covered by the National Nutrition programme and supported by UNICEF.
Prevalence of anemia among women of reproductive age and children are very common in Bangladesh. Successive pregnancy, high rate of abortion, inappropriate maternal care for pregnant and lactating mothers, intra-household insecurity of food –all these are contributory factors for anemia among lactating females. To prevent anemia in children, adolescent girls and pregnant and lactating women some packages of interventions have been taken by government and different national and international NGO. These projects include iron-folate supplements, deworming tablets and counseling to improve dietary intake, control disease and improve iron-folate intake. A network of adolescent girls groups is used to reach those who do not have regular contact with health services. In some urban slums of Dhaka and seven selected upazillas, Multiple Micronutrient Powder is being provided to families to prevent and correct anemia in children under five by UNICEF.
In the recent decades rapid urbanization has become a trend in almost all developing countries. Majority of the world’s biggest cities are in the developing countries and 60 percent of their population lives in the urban slums.7 Urbanization is associated with industrialization and economic development and results in an increase in slum and squatter settlements.8 Urban population growth is also occurring at an alarming rate throughout Bangladesh. Thirty millions of people, over 20 percent of the population of Bangladesh, live in urban areas. Urban growth is currently estimated at over 9 percent per year in Bangladesh.9 This rate includes a significant number of poor and landless households moving to city slums from rural areas in search of better opportunities.
In 2010, the population of the city of Dhaka has been projected at 17.6 million people, with upto 60 percent in the slums. Everyday we observe the influx of hundreds of new people to Dhaka city. There are two factors behind mostly encouraging people to come to Dhaka. These are – pull factor and push factor. Bangladesh is urbanizing fast. People are moving to places where there are or perceived to have jobs and opportunities. The cities are the new centers of jobs and opportunities. The bigger the center, the stronger is the pool. Dhaka is the primate city in Bangladesh according for over 30 percent of the total GDP. It is pulling rural migrants faster and larger than any other cities in Bangladesh. Findings showed that, 56 percent people migrated to Dhaka city for economic reasons. There are also some push factors working in the process of migration to the cities, especially to Dhaka city. Now-a-days maximum slum dwellers are one kind of environmental migrants. The often natural disasters: flood, drought, cyclones, riverbank erosion destroys the agricultural outcomes every year. While Bangladesh is an agro-based country these disasters are much painful for the farmers and they are obliged to go to the cities. The job sectors of rural areas are not much strong so people are pushed to the cities. And for many other people demonstration effect is big enough to push them to the cities. This uncontrollable rapid growth of urban population is accompanied by increasing poverty, food insecurity and malnutrition, which leaves serious implications for welfare and well being of the country’s urban population.11 However urbanization adversely affects the social environment when it outstrips the capacity of the infrastructure to meet people’s needs. In addition, overcrowding and poor working conditions can lead to anxiety, depression and chronic stress and have a detrimental effect on the quality of life of families and communities.
The population of slums in 2008 was estimated at between six and seven million people, 30 per cent of the metropolitan population and about 15 percent of the overall urban population. In other words, the population of slums is about 5 percent of the total population or about 7 million people in 2010. Number of migrants is increasing everyday in Dhaka, which is leading towards new slum areas. A World Bank study counted 1,925 slums in Dhaka comprising 275,000 households (1.5 million people). 13 Within the fast growing urban slums in each of the three major cities – Dhaka, Khulna and Chittagong, there exists such communities where prevalence of malnutrition is higher than in the worst affected rural areas of Bangladesh.14 Compared to other parts of the country, currently Khulna has the lowest prevalence of underweight population (38.9 percent), followed by Dhaka (45.2 percent).
Slum dwellers are distressed migrants from rural areas, with poverty-driven urbanization due to unsustainable rural economy. Consistent with a 1993 UNICEF report, the main reasons for migration to Dhaka remain poverty, landlessness, unemployment and river erosion. The urban poor have been noted to pay very high rent for dismal housing and dwellings in Dhaka are often on government-owned land, moving within slums is common due to land re-appropriation. Unsanitary latrine conditions are found in 76.6 percent and many pay intermediaries for utilities. Though most slum dwellers uses pumped/tap water for drinking while open or surface water is used for non-drinking purposes. 16 The inhabitants of slums are exposed to new environmental dynamics of poor housing, water supply and sanitation with poor access to health care. Moreover, most urban slum dwellers face particular hardships that contribute to high rates of child illness, malnutrition and food insecurity. Many of the main hazards to health are present in these urban slum areas such as over-crowding, together with the unhealthy environment due to poor sanitation, inadequate supply of clean water, pollution and lack of systematic removal of garbage and solid wastes.17 Slum people are exposed to greater risk of nutritional deficiency disease than non-slum urban areas. Young children and women of reproductive age among slum dwellers are more vulnerable to nutritional deficits.
1.2. Rationale of the Study
Malnutrition is a serious public health and socio-economic problem of Bangladesh, where the most affected populations are under 5 years’ children, adolescent girls, pregnant and lactating women. The infant mortality rate (IMR) is 57 per 1000 in the country. However, 43 percent preschool age children are stunted and 17 percent of them are severely stunted. Again, 13 percent are wasted and 1 percent is severely wasted. In our country 48 percent of the children are underweight, with 13% severely underweight.
Rates of child malnutrition rise very rapidly from 6 months of age and reach their peak during weaning age among nutritionally vulnerable children aged 6 to 24 months.
There are many factors which accelerate malnutrition. Non-exclusive breast feeding, delay of early initiation of breast milk, delayed and faulty weaning practices, prolong breast feeding are the most crucial factors among those. Maternal malnutrition is another significant cause of child malnutrition. A malnourished mother gives birth of Low Birth Weight (LBW) babies. However, if those children are not taken care with proper feeding practices, it expedites malnutrition.
Anemia is a most common public health concern among all age groups, but highest among children and pregnant and lactating women and affects about 2 billion people in developing countries. The consequences of anemia in pregnant women include increased risk of low birth weight or premature delivery, pre-natal and neonatal mortality, inadequate iron stores for the newborn, lowered physical activity, fatigue and increased risk of maternal morbidity. It is also responsible for almost a quarter of maternal deaths. Inadequate iron store in a newborn child, coupled with insufficient iron rich food intake during the weaning period, causes impaired intellectual development by adversely affecting language, cognitive, and motor development of the child. Iron deficiency among adults contributes to low labor productivity. Exclusive breastfeeding until age of 6 months and continuation of breastfeeding after this age combined with qualitatively and quantitatively appropriate feeding may contribute towards an increase in hemoglobin concentration in the first year of life. So, in a nutshell infant and young child feeding practices not only influence the growth, development, nutritional and health status of the child but also have life long implications on the health of a person.
Intra-uterine malnutrition resulting in low birth weight of the new born coupled with early childhood malnutrition is the major cause of diet related chronic diseases like diabetes, hypertension, cardio-vascular diseases and other chronic diseases in later life. However, nutritional deficiency disorders affect productivity of the person resulting in household food insecurity thus making a vicious cycle of poverty and malnutrition. Through precipitating disease and speeding its progression, malnutrition is a leading contributor to infant, child and maternal mortality and morbidity. Children and lactating mothers living in slum areas are more affected as they belong to an overcrowded under hygienic environment. The urban non-slum children along with their mothers are expected to give a different picture because of their better socio-economic and educational attainment.
The study was taken to evaluate the nutritional status of children aged 6 to 24 months and their mothers to identify the current nutrition situation. A comparison has been done between the slum and non-slum child-mother pairs. This study will help decision making to maximize utilization of limited resources particularly important for developing countries like us burdened with numerous health, nutrition and economic problems to address.
2.1. Literature Review
In developing countries inadequate access to food and nutrients, inadequate care of mother and children, inadequate health services and unhealthy environment are very common all of which leads to malnutrition. Leading scientists link 60 percent of all childhood deaths to malnutrition.19 The five major nutrition problems in Asia and the Pacific Region are- Low birth weight (LBW) which related to maternal malnutrition, early childhood growth failure, iron deficiency anemia (IDA), Vitamin A deficiency and Iodine deficiency disorders (IDD)
Child under nutrition is not spread evenly across the globe but is instead concentrated in a few countries and regions. More than 90 percent of the world’s stunted children live in Africa and Asia, where rates of stunting are 40 percent and 36 percent respectively.
Bangladesh is a poverty stricken malnourished nation with a population of 112 million denser than any other country. Malnutrition is endemic in the country with high infant, under five children and maternal morbidity and mortality. Almost the whole population suffers from micro nutrient deficiencies, chronic dietary deficiencies, non food factors such as personal and environmental hygiene, sanitation, quality of water that is used for drinking and washing, the ways of waste disposal all contribute to the present state of malnutrition. Both food and non food factor assumed special importance in case of expected and nursing mothers, adolescent girls and children who constitute the vulnerable group of the population.
The prevalence of malnutrition in Bangladesh is amongst the highest in the world. 2.4% of all children was severely malnourished by Gomez classification of Malnutrition (WAM < 60%), 34.7% were moderately malnourished (WAS = 60 – 74%) and 50.7% were mildly malnourished (WAM = 75 – 89%). 11.5% children were normal (WAM = 90 – 109%) by Gomez classification and 0.6 % were over weight (WAM ≥ 110%).
In Bangladesh 43 percent of children under five are stunted, and 16 percent are severely stunted, seventeen percent of children under five are wasted, and 3 percent are severely wasted. Weight-for-age results show that 41 percent of children under five are underweight, with 12 percent are severely underweight (measured in WHO Child Growth Standard) in our country. 15
In the recent decades child malnutrition has been addressed at a successful rate. Prevalence of underweight in children under five years (%) in Bangladesh in 1988–92 was 56.5; whereas in 2003–08 it decreased to 41.3.24 This rate is still alarming.
To assess the nutritional status and to determine potential risk factors of malnutrition in children under 3 years of age in Nghean, Vietnam a study was undertaken. The study carried out in November 2007, a total of 383 child/mother pairs were selected by using a 2-stage cluster sampling methodology. A structured questionnaire was administered to mothers in their home settings. Anthropometric measurement was defined as being underweight (Weight-for-age), wasting (weight-for-height) and stunting (Height-for-age) on the basis of reference data from the National Center for Health Statistics (NCHS) / World Health Organization (WHO). Logistic regression analysis was used to into account the hierarchical relationships between potential determinants of malnutrition. The mean Z-score for weight-for-age was -1.51 (95% CI -1.64, -1.38), for height-for-age was -1.51 (95% CI -1.65, -1.37) and for weight-for-height was -0.63 (95% CI -0.78, -0.48). Of the children, 103 (27.7.8%) were underweight, 135 (36.3%) were stunted and 38 (10.2%) were wasted. Region of residence, ethnic, mother’s occupation, household size, mother’s BMI, number of children in family, weight at birth, time of initiation of breast-feeding and duration of exclusive breast-feeding were found to be significantly related to malnutrition. The findings of this study indicate that malnutrition is still an important problem among children under three and socio-economic, environmental factors and feeding practices are significant risk factors for malnutrition among under-three years of age in Nghean, Vietnam. This study also identified that a greater risk of malnutrition was associated with poor knowledge of mothers on child feeding practice. These findings are very importance, suggesting the need for improving knowledge of mothers on child feeding practice.
Pregnant women and children during growth stages are the groups most vulnerable to iron deficiency anemia. This is a highly prevalent disease worldwide, but rates are highest in developing countries. The highest prevalence is detected among children in the 6 to 24 month age group, a period which coincides with the termination of breastfeeding. There is also evidence that the occurrence of anemia decreases as the child grows, even though anemia is still an important health problem among preschool children.
A study was undertaken to assess the relationship between hemoglobin concentration and breastfeeding and complementary feeding during the first years of life in the city of Salvador, Bahia, in northeastern Brazil, between July 1998 and August 1999. A Cross-sectional study was conducted among 553 children under age 12 months, who attended public healthcare facilities. Hemoglobin concentration was measured by cyanmethaemoglobin method, using the HemoCue system. As an outcome of the study Hemoglobin concentrations compatible with anemia were identified in 62.8% of the children studied, with greater occurrence among the 6-12 months age group (72.6%).
Exclusive breastfeeding during the first six months of life was associated with the highest levels of hemoglobin. The remaining feeding regimes were associated with different levels of reduction in hemoglobin levels, which became compatible with anemia in children fed with formula (p=0,009). Tea and/or water consumption was associated with a reduction in hemoglobin concentration of 0.76 g/dl (p<0,001) among children under age 6 months. For children aged 6-12 months, hemoglobin concentrations increased significantly with the consumption of sugar (p=0.017) and beans (p=0.018), and decreased significantly with the consumption of fruit (p<0.001).
Micronutrient deficiencies especially iron and folic acid deficiencies that result in nutritional anemia in children and women and neural tube defects in newborns remain a public health problem in Bangladesh. Poor intake of foods rich in iron and folic acid and multiple infections have resulted in high rates of anemia among pregnant women and children under two years. Coverage of pre and postnatal iron and folic acid supplements is very low (only 15% of pregnant women in rural areas take at least 100 tablets during pregnancy) 27 due, in part, to low compliance rates and low coverage of antenatal services. Coverage of multiple micronutrient supplements formulated to address iron and other micronutrient deficiencies is also very low.
Urban population growth is occurring at an alarming rate throughout Bangladesh. The national census conducted in 2001 showed that the urban population had grown by 38% in the previous ten years, compared with only 10% in rural areas.28 The scale of urban poverty in Bangladesh has become a critical policy issue. If current trends continue, it is predicted that the numbers affected by urban poverty will rise to 23 million by 2010.29The rate of urbanization in Bangladesh includes a significant number of poor and landless households moving to city slums from rural areas in search of better opportunities.9 However, it adversely affects the social environment when it out strips the capacity of the infrastructure to meet peoples’ need. In addition, overcrowding and poor working condition can lead to anxiety, depression and chronic stress and have a detrimental effect on the quality of life of families and communities.
Under-nutrition remains a major problem in most developing countries, especially in underserved areas such as urban slums. A cross-sectional study was planned to know the role of various factors influencing the nutritional status. The study was conducted in the urban slums of Rohtak, a city in Haryana, on 540 children aged 1-6 years and the relation of under-nutrition with age, sex, birth order, and type of family, literacy, and calorie intake were studied and analyzed using percentages and chi-square test. 57.4% of children were found malnourished. Proportion of malnourishment was more in males. Birth order, age type of family, number of living children, literacy status of mother and calorie intake were statistically significantly associated with grades of malnutrition.30
In Bangladesh the prevalence of stunting (%<-2 z-score) among the pre-school children was higher in the urban slums, followed by the rural and urban non-slum areas (66.2%, 61.1%, and 52.5%) respectively in 1996.
The Nutrition Surveillance Project conducts nutrition and health surveillance in partnership with NGOs in 4 urban slum working areas of Dhaka, Chittagong and Khulna and 41 sites throughout rural Bangladesh. In December 1996, the Helen Keller International (HKI) and the International Centre for Diarrhoeal Disease Research, Bangladesh collaborated on a crosssectional health and nutrition study in Lalbagh, a non-slum area in Dhaka. Data from the December round of the NSP for slum areas (n=1,788) and the rural sites (n=16,140) were used with the non-slum site (n=1,392). The prevalence of stunting (%<-2 z-score) among the pre-school children was higher in the urban slums, followed by the rural and urban non-slum areas (66.2%, 61.1%, and 52.5%) respectively. Analysis of the household socioeconomic situation showed that there was also great disparity within each of these areas. Comparing nutritional status among the children from vulnerable households (landless and/or where the main earner is a casual worker) by area revealed the severity of underweight in the urban slums: 71.0% vs. 61.9% in the urban non-slums vs. 64.8% in the rural areas. Diarrhoea, vulnerability, and slum habitat were significantly associated with increased risk of being underweight.
As seen from this analysis, the pre-school children in the slum areas of Dhaka and other sites were at equal or greater risk of poor health and malnutrition than their counterparts in the rural and non-slum areas. While the malnutrition rates for children living in the areas are also high by international standards, the results of the study suggest that particular attention should be given to improve the situation for children living in the urban slums.
In selected upazilas of Chittagong Hill Tracts, seven National Nutrition Program convergence upazilas and selected slums of Dhaka and Chittagong City Corporation areas Community-based models for preventing anemia in children, adolescent girls and women have been piloted. This pilot project is being expanded to other areas in urban and rural Bangladesh, targeting 75,000 children, 15,000 adolescent girls and 6,000 women.
In many developing countries, the low status of women is considered to be one of the primary determinants of under nutrition across the life cycle. Women’s low status can result in their own health outcomes being compromised, which in turn can lead to lower infant birth weight and may affect the quality of infant care and nutrition. A study in India showed that women with higher autonomy (indicated by access to money and freedom to choose to go to the market) were significantly less likely to have a stunted child when compared with their peers who had less autonomy.
The mean height of Bangladeshi women is 150 centimeters, which is above the critical height of 145 centimeters. Thirty percent of women are chronically malnourished, their body mass index (BMI) being less than 18.5. One in weight women was found to be overweight or obese (BMI 25 or higher). A woman’s place of residence, level of education and household wealth status are strongly associated with her nutritional status. For example, 33 percent of rural women are considered thin (<18.5), compared with 20 percent of their urban counterparts. Between the 2004 and 2007 BDHS surveys, the proportion of women who are over-weight or obese increased slightly from 10 percent to 12 percent. The average height of women did not change.
Lower health care facilities for women of reproductive age result in higher maternal malnutrition in the country. In Bangladesh 1 in 5 women (21 percent) with a live birth receives postnatal care from a medically trained provider, and mostly only in the first two days after delivery.
Data from the 2007 BDHS show that under-five mortality (65 deaths per 1000 live births) has continued its notable decline. Large decreases were observed in child mortality (age 1-4 years). The number of children die before reaching the first birthday has decreased from one in fifteen children compared to one in 19 (52 deaths per 1000 live births) in the 2004 BDHS.
Another contributing factor for malnutrition is faulty treatment seeking behavior and absence of health care facility for the target population. . Among children under 5 years of age, 5 % showed the symptoms of acute respirator illness in the two weeks preceding the Bangladesh Demographic and Health Survey 2007. Of these, only 37% were taken to a health facility or a medically trained provider for the treatment while 13% received no treatment at all. Among thirty eight percent of children under five years had a fever in the two weeks preceding the survey. Of these 24 percent were taken to a medically trained provider or health facility for treatment. For 23 percent of children with fever, help was sought at a pharmacy.
There is a strong association between under-five mortality and mother’s education. It ranges from 32 deaths per 1000 live births among children of women with secondary complete or higher education to 93 deaths per 1000 live births among children of women with no education.
A greater risk of malnutrition is associated with poor knowledge of mothers on child feeding practice. Almost all (98 %) Bangladeshi children are breastfed for some period of time. Forty-five percent of last-born infants who ere ever breastfed were put to the breast within one hour of birth, and 89 percent started breastfeeding within the first day. The median duration of any breastfeeding in Bangladesh is 32 months. Exclusive breastfeeding of children under six months (based on 24-hour period before the survey) has not improved in the past 15 years; it remained unchanged at around 45 percent in between 1993-94 and 1999-2000, declined to 42 percent in 2004, and remained essentially unchanged, 43 percent in 2007.15 The majority of mothers breastfed their children well into the second year of life (>88% of children aged 12-14 mo and >74% of children aged 21-23 mo), and many for much longer.33
On the other hand, supplementary feeding of children who are also breastfed has greatly increased over the past 15 years. In 1993-1994, only 29 percent of children age 6-9 months received complementary foods while being breastfed, compared with 62 percent in 2004 and 74 percent in 2007.The most commonly used complementary foods are those made from grains such as rice, wheat and porridge (over 60 percent; one-third of the children in this age group received fruits and vegetables rich in vitamin A. Sixteen percent received meat, fish, poultry or eggs.
Maternal malnutrition, insufficient health care facilities, lower education level, poor knowledge, attitude and practices about child feeding are more common in slum areas. Maximum people of the slum are below poverty level and are living vulnerable life as malnutrition and poverty in interlinked. Their housing conditions are appalling with many living in flimsy shakes (Jhupri). Only 41% have access to sanitary toilets. Most of their income is spent on food. They enjoy any utility services very hardly. They use open spaces and drains for defecation and cook their food on the street.34
Many tens of thousands of people live in desperately poor circumstances in the slums of towns and cities of Bangladesh and all the evidence suggests that their numbers are rising. The number of slum settlements has grown rapidly in recent years and the urban poor are now estimated at around 11 million or 37% of the urban population of Bangladesh. Most of these slums only provide shelter for poor people.
A study was done to asses the determinants of malnutrition among the children under 2 years of age of Dhaka city. For this purpose, two hundred and twenty five mothers of Dhaka medical college hospital are interviewed to investigate of determinants of malnutrition. All of the respondents were under two years of age. One hundred fourteen of them were girls and rests 111 were boys. All of the children were from different socio-economic status coming different places of Bangladesh. 28% of the respondents’ family monthly income was below 3001-5000, 3.6% were below 20,000-25,000 and 16.4% were 10,000-15,000, 21.3% respondents’ mothers were illiterate, 24.4% mothers completed primary level, 32% completed secondary level, 11.1% completed higher secondary level and 11.1% mothers were graduated. The nutritional status children were not found very from normal to 3 degree malnourishment. Nearly 45.8% were normal, 1.8% was over nourished and 2.2% were 3 degree malnourished. 35
Recent findings from a survey of slums in Dhaka suggested that anemia is a serious public health problem among the school children. Special study from the urban slum sides of the GOB/HKI nutrition surveillance project (NSP) showed that 75.8% of children aged 6-59 months suffered from anemia (Hemoglobin < 110g/L). The prevalence of anemia was highest among children aged 6-11 months (92.3%) and children aged 12-23 months (87.4%). Many mothers and children are still malnourished and according to WHO definitions, prevalence of malnutrition was very high or serious during most time of the year. Data showed that 58-70% of households in slums of Dhaka had an energy intake ≤ 2122Kcal/Person/Day indicating at least moderate poverty. The majority of these households also had an intake below 1805Kcal/Person/Day (29-34%) in Dhaka. Approximately a quarter of mothers were under weight. Severity of child wasting (Low weight of height) was poor (4-8%) prevalence was higher among 0-23 months old children in the slums of Dhaka.
In the above context, it can be concluded that a large number of the population of Bangladeshi children are suffering from malnutrition and are likely to grow smaller and smaller. This is implication of the fact that we are heading towards a nation that will see its children to be of small status and low weight population. So, we need to give highest priority to child health and nutrition if we hope for a brighter future of our country.
3.1.Objectives
3.1.1. General Objective
To assess the nutritional status of children aged 6 to 24 months and their mothers from selected slum and non-slum areas of Dhaka city and to compare the existing nutritional situation in terms of feeding practices as well as socio-economic conditions.
3.1.2. Specific Objectives
- To assess the socio-economic and demographic situation of the slum and non-slum target populations.
- To evaluate the nutritional status of children (6 to 24 months) and their mothers by anthropometric measurements and clinical observations between two target populations.
- To estimate blood hemoglobin level of both mothers and children (aged 6 to 24 months) from two target populations using HemoCue method.
- To assess Knowledge, Attitude and Practice (KAP) between two target populations in terms of pregnancy, delivery and lactation aspects of the mothers.
- To find out child feeding practices and to evaluate dietary intake pattern of the mothers using 24 hours dietary recall method of both target populations.
- To understand the morbidity pattern of children and treatment seeking behavior of two target populations.
- To compare the existing situation between the selected slum and non-slum populations of Dhaka city in terms of study parameters.
- Finally, to recommend appropriate interventions to improve the feeding practices as well as nutritional status of both target populations based on the study findings.
3.2.Hypothesis
3.3.Conceptual Framework
A conceptual framework was drawn to summarize all influential factors that affecting nutritional status of mothers and in turn their children. Maternal malnutrition is the outcome of poor socio-economic and demographic condition (i.e. low income, low level of education, occupation and family size), which is expedite by poor sanitation, frequent morbidity, lack of health care facilities, lack of pure water source for different usages, unhealthy environment and living condition. An unhealthy mother with poor body storage of different nutrients and short stature gives birth of a low birth weight (LBW) baby in most cases. Again improper treatment seeking behavior, frequent morbidity, lack of proper Knowledge, Attitude and Practice (KAP) of mothers about pregnancy, delivery, lactation and faulty feeding practices (non-exclusive breast feeding, faulty complementary feeding practice, prolonged breast feeding) – all these leaves a dangerous impact on child growth and development. Children at their early life fail to catch-up growth. Such trauma at the beginning of life has bad consequences in the long run. A malnourished child becomes a malnourished adult and the cycle of malnutrition continues from generation to generation.
4.1.Materials and Methods
4.1.1.Study Design
This was a comparative cross-sectional study. The study was conducted among the children aged 6 to 24 months and their mothers of selected slum and non-slum areas of Dhaka Metropolitan city. The aim of the study was to investigate the comparison between the target populations from slum and non-slum areas. The study was, therefore designed into the following four schematic parts:
Part one: Socio-economic & demographic information:
It included age, education, religion, occupation, total family member, monthly income, sector wise expenditures, utility facilities and water sources for different household usages.
Part two: KAP related Information among mothers:
I. Information related to pregnancy, lactation and delivery
II. Feeding Practices: Colostrum feeding, Pre-lacteal feeding, exclusive breast feeding, supplementary feeding and complementary feeding practices.
III. Morbidity and treatment seeking behavior
Part three: Anthropometric assessment:
Height/length and weight of target children
Height and weight of their mothers
Part four: Biochemical assessment:
Hemoglobin level of target children and their mothers
Part five: Dietary assessment:
Food Intake of mothers by 24 hour recall method
Part six: Clinical Assessment:
Clinical signs and symptoms of target children and their mothers
Part seven: Statistical analysis:
Different statistical analysis was undertaken. These are-
Descriptive analysis
Pearson’s Chi-square test
Bivariate correlation
Linear regression
Time Frame: The study was carried out from January to December 2010 which includes study design, data collection, data analysis and write up.
4.1.2.Study Location
The study was conducted at Koilarghat slum, Chandirghat slum at Kamrangirchar slum area and randomly selected non-slum areas of Dhaka city. Data for non-slum areas were collected from the mother-child (aged 6 to 24 months) pairs visiting different immunization centers in Dhaka city. These were the immunization centers of Holy Family Red Crescent Medical College and Hospital, Monowara Hospital Private Ltd and Brighton Hospital, Dhaka. The places were chosen in a purpose to reach the target population during the limited time of data collection. A large number of mother-child pairs from different parts of non-slum Dhaka attended these centers for immunization.
4.1.3. Study Population
The study was conducted among 95 child-mother pairs from both slum and non-slum areas of Dhaka city by simple random sampling. The study subjects included children aged 6 to 24 months and their mothers. Ages of the children were confirmed mostly by using the child’s birth certificate or immunization card. The purpose of the study was explained to the authority of those centers and all the respondents. To conduct the study, consent was taken from the mothers of the children.
4.1.4.Sample Selection Criteria
Inclusion Criteria:
- Mother alive as well as care giver of 6-24 months child
- Residing in the habitation for at least 6 month
Exclusion Criteria:
- Severely sick child or mother
- Mother is not the caregiver
4.1.5.Sample Size Calculation
The sample size was estimated by considering the prevalence of malnutrition among the children aged less than two years of slums of Dhaka. The prevalence of underweight children of less than 2 years of age in urban slum of Dhaka is 46%.36
The sample size for slum and non-slum children (6 -24 months) was estimated using the following formula
Considering p=0.46 (q=0.54), z=1.96 and d=10% we obtain
Where,
p = 0.46 (maximum variability i.e. prevalence of underweight in < 2 years children in urban slum Dhaka)
q = (1-p) = (1-0.46) = 0.54
Z = the value associated with 95% confidence interval = 1.96
e = level of precision (±10%) = 0.
A total of 95 children aged 6 to 24 months were thus selected in the study having equal number of their mothers. Similarly for comparative purpose equal number that is 95 child-mother pairs were included in the study, even though the prevalence of malnutrition among non-slum area children is much lesser in number.
Thus a total of 190 child-mother (6-24 months) pairs who were residing in their habitation for more than 6 months were selected randomly for the study purposes.
4.1.6. Questionnaire Design and Field Trial
A standard close ended questionnaire was developed to obtain relevant information based on the objectives of the study. In order to standardize the data collection procedure, pre-testing of the questionnaire was conducted in both slum and non-slum areas who were not included in the study. Based on the observations and pre-test findings necessary corrections were made in the questionnaire. The questionnaire was then finalized. A detail questionnaire is given in annexure1.
4.1.7. Overview of Data Collection Method
The mothers were interviewed to collect information. In the slum areas target child-mother pairs were reached by door to door visit. Data for non-slum areas were collected from the target child-mother pairs visiting different immunization centers in Dhaka city. These were the immunization centers of Holy Family Red Crescent Medical College and Hospital, Monowara Hospital Private Ltd and Brighton Hospital, Dhaka. The places were chosen in a purpose to reach the target population during the limited time of data collection.
To avoid information missing or faulty information, the collected information from the locations were checked, coded everyday and crosschecked at the field sites in order to avoid any misreporting. Any confusion arising in this matter was settled on the following day during subsequent spot visit.
Socio-economic & Demographic Data Collection:
Information regarding socio- economic and demographic condition was collected as an essential part of the study by a personal interview with target mothers. Socio-economic information such as educational attainment, occupation, number of family members, income, monthly expenditure age, religion, sector wise expenditures, utility facilities and water sources for different household usages were carefully investigated and recorded in the specified portion of the questionnaire.
KAP related Data Collection:
Data was collected about:
I. Information related to pregnancy, lactation and delivery
II. Child feeding practices: colostrum feeding, pre-lacteal feeding, exclusive breast feeding, supplementary feeding, complementary feeding practices.
III. Morbidity and treatment seeking behavior
Anthropometric Data Collection:
Nutritional status of the target children and their mothers were assessed with the help of anthropometric measurements.
Weight: Body weight of children and their mothers were weighed by using weighing scale, which was calibrated with known weight and balanced at zero before each series of measurements. Mother was made to stand at the center of the platform with hands on his side, barefoot and in light clothing and her weight was recorded to the nearest 0.1 kilogram. Then the mother was made to stand with the baby in her lap and then their combined weight was taken. Then by subtracting the two values the weight of the child was estimated.
Height: For mothers and children (who were able to stand alone), the height was measured using a vertical scale. Boards for measuring height were manufactured with the assistance of INFS. After removing the shoes, the subject was made to stand on the flat surface of the scale with feet parallel to heels and eyes looking straight ahead with arms hanging loosely at the sides. The headpiece of the measuring device was a metal bar, which gently lowered crushing the hair and contact with the top of the head. The measuring scale was 175 cm and height was measured to an accuracy of 0.1 cm.
Since the measurement of standing height for most of children was not possible, a recumbent length (crown-heel length) was measured. The child was laid on a table or flat surface placing head firmly against the fixed metal headpiece with the baby’s eyes looking vertically and extending the knee by firm pressure, and flexing the feet at right angles to the lower legs against the upright foot piece of the height scale. The length of the child was read to the nearest 0.1 cm.
Weight-for-age, height-for-age, weight-for-height (in z-scores) were adopted for characterizing the child’s anthropometric status. The cut-off points for WHO Global Database on Child Growth and Malnutrition was used in this study as standards for classification of children in various grades of nutritional status
The cut-off levels are given below:
| Height-for-age Z-score (HAZ) | Classification |
| < –3SD | Severe stunted |
| < -2SD to –3SD | Moderate stunted |
| ≥ -2SD | Normal (not stunted) |
| Weight-for-age Z-score (WAZ) | Classification |
| < –3SD | Severe under weight |
| < -2SD to –3SD | Moderate under weight |
| ≥ -2SD | Normal (not under weight) |
| Weight-for-height Z-score (WHZ) | Classification |
| < –3SD | Severe wasted |
| < -2SD to –3SD | Moderate wasted |
| ≥ -2SD to 2SD | Normal (not wasted) |
| > 2SD | Over weight |
Mothers’ nutritional status was measured by Body Mass Index (BMI). BMI is calculated by dividing weight in kilogram by the square of height in meter. The cut-off value was adopted for characterizing mother’s nutritional status by using WHO reference (1995).
| BMI (kg/m²)Principal cut-off points | Classification |
| ≤ 18.49 | Under Nutrition |
| 18.50 – 24.99 | Normal |
| ≥ 25.00 | Obese |
Blood Collection:
Level of blood hemoglobin was used as an index of biochemical status. Hemoglobin concentration was determined in the field using the cyanmethemoglobin method, in HemoCue system (WHO, 2001), considered as reliable and recommended for the determination of hemoglobin concentration during fieldwork. Blood collection was done by fingertip lancing, using disposable lance. 20 micro liter of blood was collected by microcuvettes from each target population. Which was preserved by soaking in blotting paper and was stored in the refrigerator until the blood test was carried out the following day.
Estimation of Hemoglobin:
Photometric Colorimetric Test (cyanmethemoglobin method) has been carried out for the determination of hemoglobin from collected blood sample using Drabkin’s solution prepared previously in the laboratory of INFS. The absorbance (optical density) was measured in the spectrophotometer at 540 nm.
Calculation of Hemoglobin Concentration:
Blood hemoglobin level was calculated using the following equation:
Hemoglobin (g/dl) = 36.8 ×Optical Density
The cut-off values for hemoglobin concentration to determine anemia was considered based on the suggested criteria for the diagnosis of anemia (WHO, 2001)
| Population Group | Levels of Hemoglobin considered anemic |
| Children aged 6 months to 6 years | <11 g/dl |
| Adult Females : non pregnant | <12 g/dl |
Dietary Information:
Data regarding mothers’ dietary intake were collected by 24 hour recall method. The mothers were interviewed and asked to demonstrate the amounts of food eaten over the past 24 hours by her. Detailed information on menu, family measurement and food ingredients were collected from mothers. Bangladeshi food conversion table developed by INFS was used to code and calculate the weight of all foods. Information on the child’s regular food consumption was obtained at the time of interviewing mothers
Clinical Observations:
The target children and mothers from both slum and non-slum areas were carefully observed to examine if there are any clinical signs and symptoms.
4.1.8.Analytical Methods
A data entry form was first prepared and data from the finally checked questionnaires were entered in that form using Statistical Package for Social Scientists (SPSS) Windows version17 software and this was followed by an extensive period of logical checking to identify any data entry errors. Those identified errors were corrected by consulting the original questionnaires.
Then data analyzed by applying percentages, means, standard deviations, chi-square test, correlation test and regression analysis. Anthropometric status evaluation was carried out using WHO Anthro program. Dietary analysis was done by using Fortran 77 software.
Descriptive analysis was undertaken to explore the differences in household socioeconomic, demographic, monthly income, sector wise monthly expenditure, parity, number of abortion, delivery place, birth weight, colostrums feeding, exclusive breast feeding, supplementary feeding, complementary feeding, morbidity and treatment seeking behavior, anthropometric status, dietary intake, anemia level, clinical findings among the children aged 6 to 24 months and their mothers of both slum and non-slum areas. Chi-square test was done to see the level of significance and bivariate correlation test was done to estimate the strength of correlation between two variables. Linear regression analysis was done for estimating the correlation coefficient between dependent and independent variables for the target population from both slum and non-slum areas of Dhaka.
4.1.9. Limitations of the Study
During the time of the study some difficulties and challenges were faced which were addressed and mitigated properly to ensure most accuracy. Those are:
1. The study was conducted in different areas of Dhaka city where the level of education and standard of living were different than those of slum dwellers who were sometimes difficult to communicate.
2. The respondents (mothers) had to give the history of dietary intake by 24 hours recall method, where assumption of amount of food consumed may not be accurate.
3. Most of the respondents were unwilling to express their original monthly income. Several of them tried to lessen their income.
4. Some of the households in non-slum areas were not cooperative for allowing blood collection for hemoglobin estimation, so it needed more persuasion to convince them.
5. Managing time for interview of non-slum mothers were one of the difficult tasks which was overcome by repeated motivations.
6. While collecting age of the mothers in slum, some difficulties were faced as few of them had no birth cards or immunization cards and even they could not remember the exact year. Various referral questions related to remarked incidents were asked to make her recall for calculating the approximate age. So, there is a chance of recall bias.
5.1.Results of the Study
5.1.1.Socio-economic & Demographic Information
Background Characteristics:
Table 1 shows the composition of respondents by their religion. 94.7% of the respondents from slum area were Muslim, 5.3% of them were Hindu. Among the non-slum respondents 88.4% were Muslim, 8.4% were Hindu and 3.2% was Christian. 91.6% of all respondents were Muslim. So, it is clear that in the total sample most of the respondents were Muslims.
Table 1: Percent Distribution of Households by Religion
| Religion | Slum (%) | Non-slum (%) | Total (%) |
| Islam | 94.7 (90) | 88.4 (84) | 91.6 (174) |
| Hindu | 5.3 (5) | 8.4 (8) | 6.8 (13) |
| Christian | 0 (0) | 3.2 (3) | 1.6 (3) |
| Total | 100.0 (95) | 100.0 (95) | 100.0 (190) |
* (Figures in parenthesis are numbers of respondents)
Figure 1 represents that most of the respondents belong to small family with maximum 4 family members. Only 3.2 slum families and 2.1 percent non-slum families were large.
Table 2 represents that most of the slum mothers (58.9 percent) were between 19 and 25 years, whereas the largest portion of mothers (49.5 percent) in the non-slum areas were from 26 to 32 years of age.
Table 2: Distribution of Mothers according to their age
| Age of Mothers | Slum ( n=95) | Non-slum (n=95) |
| 16 to 18 years | 10.5 | 2.1 |
| 19 to 25 years | 58.9 | 23.2 |
| 26 to 32 years | 22.1 | 49.5 |
| 33 years & above | 8.4 | 25.3 |
| Total | 100.0 | 100.0 |
Education Level
Marked variations were found in the education level of slum and non-slum population. Table 3 shows the education level of the mothers and main income earners of both slum and non-slum areas. However, 35.8 percent of the mothers from slum were illiterate, 4.7 percent had completed primary level and 29.5 percent had completed S.S.C., no mother in the slum found completed H.S.C. level. On the contrary, education level of mothers of non-slum areas was at least S.S.C. level. Again, 52.6 percent mothers reported having had graduation or above, 18.9 percent mothers from non-slum areas had completed primary level and 28.4 percent had completed H.S.C.
In case of education level of the main income earner a big portion (77.9 percent) from non-slum areas were graduated or had higher education level, 7.4 percent had completed S.S.C. and 14.7 percent had completed H.S.C. On the other hand, in the slum area, 30.5 percent of the main income earners were illiterate, 35.8 percent reported having had primary education, 28.4 percent had completed S.S.C. and only 5.3 percent had completed H.S.C. It is thus evident that, respondents from slum were lagging behind in terms of education level than from non-slum respondents.
Table 3: Education Level by Areas
| Education Level | Mother | Main Income Earner | ||
Slum (%) | Non-slum (%) | Slum (%) | Non-slum (%) | |
| Illiterate | 35.8 | 0 | 30.5 | 0 |
| Upto Primary level | 34.7 | 0 | 35.8 | 0 |
| Completed S.S.C. | 29.5 | 18.9 | 28.4 | 7.4 |
| Completed H.S.C. | 0 | 28.4 | 5.3 | 14.7 |
| ≥ Graduate | 0 | 52.6 | 0 | 77.9 |
| Total | 100 | 100 | 100 | 100 |
Economic Condition:
Figure 2 shows that in slum areas, 57.9 percent of the mothers reported being housewives whereas, 23.2 percent was industry workers, 11.6 percent was day laborer and 5.3 percent was involved in small business, while 2.1 percent reported as worker.
Main occupations of the main income earners of the households have been given in figure 3. Among them 35.4 percent of slum areas was involved in small business. A large part (34.7 percent) reported as day laborer.
Figure 4 and 5 respectively represents the occupation of mothers and main income earning members of non-slum areas. 65.3 percent mothers of non-slum areas were housewives. Major portion (54.7 percent) of the main income earning members of non-slum areas was service holder. 5.5 percent major income earning members were found working at abroad.
Figure 6 demonstrates that 16.8 % households of slum had a monthly income less than Tk. 4000, 18.9 % had a monthly income Tk. 4001 to Tk. 7000, 51.6 % had a monthly income Tk. 7001 to Tk. 10000, 12.6 % had a monthly income Tk. 10001 to Tk. 15000.
Figure 7 shows that 2.1 % households of non-slum areas had a monthly income from Tk. 10001 to Tk. 15000, 6.3 % had a monthly income Tk. 15001 to Tk. 20000, 47.4 % had a monthly income Tk. 20001 to Tk. 30000, 37.9 % had a monthly income Tk. 30001 to Tk. 50000 and 6.3% had more than Tk50000.
Data on per capita monthly income is shown in table 4. In the slum areas, 37.9 percent of households reported having per capita monthly income of Tk. 1500 or less, 62.1 % a per capita monthly income of Tk. 1501 to Tk. 2500. In the non-slum areas, 42.1 percent of households reported having per capita monthly income of Tk. 4001 to 6000, 42.1 % a per capita monthly income of Tk. 6001 to Tk. 8000, 15.8 percent a per capita monthly income was above Tk. 8000
Table 4: Percent Distribution of Households by Per Capita Monthly Income
Per Capita Monthly Income (Taka) | Slum (%) ( n=95) | Non-slum (%) (n=95) |
<1500 | 37.9 | 0.0 |
1501-2500 | 62.1 | 0.0 |
4001-6000 | 0.0 | 42.1 |
6001-8000 | 0.0 | 42.1 |
>8000 | 0.0 | 15.8 |
Total | 100.0 | 100.0 |
Figure 8 shows monthly mean expenditure in different sectors in slum and non-slum areas. The mean food cost in slum area was Tk.5242, whereas the mean food cost was Tk.11858 in non-slum areas and the mean treatment cost in slum areas was Tk.400, whereas the mean treatment cost was Tk.1611 in non-slum areas. In each sector a huge difference existed.
Figure 8: Percent Distribution of Households by Sector wise Average Monthly Expenditure
Utility Facilities and Practices:
The respondents in slum did not use to live a decent life in healthy abodes. They did not have any gas or water supply. According to table 5 in slum areas, it was found that 58.9 percent of them only had kitchen facilities. During data collection it was observed that most of the accommodation set up in slum was mostly a house with 5 to 6 rooms, one toilet and one kitchen, where each family resides in a room and share the single bathroom and kitchen with other residents. 74.8 percent respondents reported having sanitary latrine in slum areas.
Table 5: Percent Distribution of Households by selected variables regarding Utility
Utility Facilities | Slum (%) ( n=95) | Non-slum (%) (n=95) | |
Sanitary Latrine | Yes | 75.8 | 100.0 |
No | 24.2 | 0.0 | |
Kitchen | Yes | 58.9 | 98.9 |
No | 41.1 | 1.1 | |
Water Supply | Yes | 0.0 | 94.7 |
No | 100.0 | 5.3 | |
Gas Supply | Yes | 0.0 | 91.6 |
No | 100.0 | 8.4 | |
Source of water is of great importance for better health and nutritional status. Though 66.3 percent slum people reported drinking deep tubewell water; only 46.5 percent used water from deep tubewell for cooking purpose.
All respondents in slum areas reported washing utensils in the nearer river or pond, whereas 93.7 percent also reported bathing by this same source of water. A major part of non-slum respondents reported same source of water for drinking, cooking, utensil washing and bathing which is tap water. Data on different sources of water is given in table 6.
Table 6: Percent Distribution of Households by selected variables regarding Water Sources
Water Usage | Sources of Water | Slum (%) ( n=95) | Non-slum (%) (n=95) |
| Drinking Water | Tap | 0.0 | 94.7 |
| River/Pond | 33.7 | 0.0 | |
| Deep tubewell | 66.3 | 3.2 | |
| Tubewell | 0.0 | 2.2 | |
| Cooking Water | Tap | 0.0 | 94.7 |
| River/Pond | 53.5 | 0.0 | |
| Deep tubewell | 46.5 | 3.2 | |
| Tubewell | 0.0 | 2.2 | |
| Utensil Washing Water | Tap | 0.0 | 94.7 |
| River/Pond | 100.0 | 0.0 | |
| Deep tubewell | 0.0 | 3.2 | |
| Tubewell | 0.0 | 2.2 | |
| Bathing Water | Tap | 0.0 | 94.7 |
| River/Pond | 93.7 | 0.0 | |
| Deep tubewell | 6.3 | 3.2 | |
| Tubewell | 0.0 | 2.2 |
5.1.2.KAP related Information among Mothers
Information related to Pregnancy, Delivery and Lactation:
Reproductive health situation in slum and non-slum areas of Dhaka city has been focused through the given tables and figures.
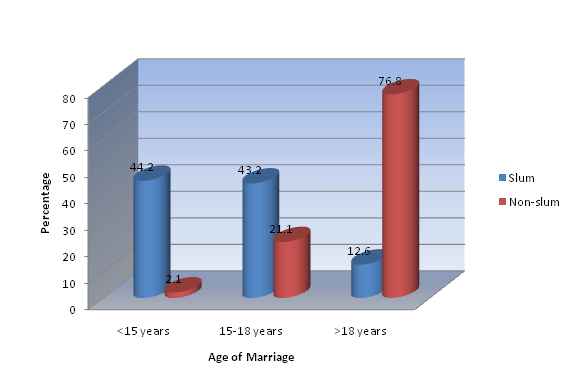
Figure 9 demonstrates most (76.8 percent) of the non-slum respondents got married at the age of more than 18 years, whereas in slum the situation was found completely different. Only 12.6 percent mothers in slum were of more than 18 years of age while marrying.
Adoption of family planning was higher among the non-slum occupants. Figure 10 and figure 11 respectively demonstrate the percentage of households adopted family planning or not in slum and non-slum areas. However, 30 percent of slum respondents reported adopted family planning, whereas adoption of family planning was much higher (67 percent) among non-slum households.High parity and abortion rate both are very crucial incidences for women health. Socio-economic different influential factors promote their occurrences. From table 7, it is clear that percentage of parity was almost similar in both slum and non-slum areas. This was because the target children were mostly the first children of slum mothers.
Occurrence of abortion is higher (38.9 percent) among the non-slum mothers. It is clear from the table that among the mothers who had incidence of abortion in their life, most of them (69.5percent in slum and 63.2 percent in non-slum area) experienced multiple abortions.
Child spacing is important for maternal and child health. Short birth intervals are associated with an increased risk of death for mother and child. Studies have shown that children born at less than 24 months after a previous sibling are generally of poorer health. Short birth intervals also threaten maternal health.
However, 77 percent slum mothers did not have child spacing for at least 3 years, while the value for this in non-slum area is 58 percent.
Table 7: Percent Distribution of Mothers according to Reproductive Characteristics
| Reproductive Characteristics | Slum (%)( n=95) | Non-slum (%)(n=95) | |
| Parity | < 3 | 83.2 | 87.4 |
| ≥3 | 16.8 | 12.6 | |
| Total | 100.0 | 100.0 | |
| Abortion | Occurred | 29.5 | 38.9 |
| Never Occurred | 70.5 | 61.1 | |
| Total | 100.0 | 100.0 | |
| No. of Abortion | <2 | 30.5 | 36.8 |
| ≥2 | 69.5 | 63.2 | |
| Total | 100.0 | 100.0 | |
| Child Spacing | ≥3 Years | 23.0 | 42.0 |
| < 3 Years | 77.0 | 58.0 | |
| Total | 100.0 | 100.0 | |
Table 8 shows that a major part of the respondents’ place of delivery was the nearest NGO delivery centre. Most of them reported mainly BRAC delivery centre as their delivery place. In case of non-slum part of Dhaka, 91.6 percent mothers reported different hospitals and clinics as their delivery place.
However, 66.3 percent of non-slum mothers reported that their last baby was caesarean, whereas in slum most babies (69.5 percent) were delivered normally. Major respondents from both areas (15.8 percent for slum and 23.2 percent form non-slum) did not report about much blood loss after delivery.
It was seen that 43.2 percent mothers of slum reported that their last child born between 8 to 9 months. Again, 66.3 percent non-slum mothers reported giving last child birth at less than 8 months of pregnancy.
Low birth weight leads to malnutrition in later life. Table 8 shows that 58.7 percent mothers gave birth of LBW babies in slum and 25.8 percent non-slum mothers also reported giving birth of LBW babies.
Table 8: Percent Distribution of Mothers according to Delivery Information
Delivery related Information | Slum (%) ( n=95) | Non-slum (%) (n=95) | |
| Place of Delivery | Home | 33.7 | 8.4 |
| NGO Delivery Centre | 54.7 | 0.0 | |
| Hospital/ Clinic | 11.6 | 91.6 | |
| Total | 100.0 | 100.0 | |
| Type of Delivery | Normal | 69.5 | 33.7 |
| Caesarean | 30.5 | 66.3 | |
| Total | 100.0 | 100.0 | |
| Blood Loss After Delivery | Occurred | 15.8 | 23.2 |
| Not Occurred | 84.3 | 76.5 | |
| Total | 100.0 | 100.0 | |
| Month of | |||
KAP regarding Anemia
Anemia is very common among women of reproductive age in our country. Before and during pregnancy if it is not corrected mother gives birth of baby with depleted iron store and most dangerously the mother’s body iron status become poorer and she becomes more anemic. Knowledge about Anemia can help one to win against it.
Table 9 shows that 68.4 percent of slum mothers did not have knowledge about anemia which is very alarming. 25.3 percent non-slum mothers also did not know about this.
70.5 percent of slum mothers even did not know that if they were suffering from anemia during pregnancy or not. 43.2 percent non-slum mothers had anemia during pregnancy whereas 21.1 percent among them also did not know that if they had anemia during pregnancy or not.
Only 23.2 percent slum mothers got Iron supplementation during pregnancy. Among them 52 percent had taken 1 to 150 iron tablets during whole pregnancy.57.9 percent mothers reported that they did not take any folic acid supplementation during pregnancy period.
Table 9: Percent Distribution of Mothers according to Knowledge, Prevalence of Anemia and Supplementation (Iron, Folic acid) taken during Pregnancy
| Criteria | Variables | Slum (%) ( n=95) | Non-slum (%) (n=95) |
| Knowledge about Anemia | Know | 31.6 | 74.7 |
| Don’t Know | 68.4 | 25.3 | |
| Total | 100.0 | 100.0 | |
| Anemia During Pregnancy | Yes | 20.0 | 43.2 |
| No | 9.5 | 35.8 | |
| Don’t Know | 70.5 | 21.1 | |
| Total | 100.0 | 100.0 | |
| Iron Supplementation | Taken | 26.3 | 71.6 |
| Not Taken | 73.7 | 28.4 | |
| Total | 100.0 | 100.0 | |
| No. of Iron Tablet Taken | 1-150 | 52.0 | 39.7 |
| 151-300 | 8.0 | 11.8 | |
| 301-500 | 4.0 | 17.6 | |
| Unlimited | 36.0 | 30.9 | |
| Total | 100.0 | 100.0 | |
| Folic Acid Supplementation | Taken | 7.4 | 58.9 |
| Not Taken | 57.9 | 20.0 | |
| Don’t Know | 34.7 | 21.1 | |
| Total | 100.0 | 100.0 |
Information related to Feeding Practices
Feeding Practices of Newborns
Breast feeding is the first fundamental right of a baby. The initiation of breast feeding and the timely introduction of adequate and safe appropriate complementary foods in conjunction with continued breast feeding are of prime importance for the growth, development, health and nutrition of infants and children.
Breast feeding also have importance for mothers. Breast feeding promotes uterine contractions and expels the placenta in the immediate postpartum period and reduces maternal blood loss.
According to Figure 12, most newborns from both slum (61.1 percent) and non-slum (67.4 percent) areas were first introduced colostrum just after birth. A big portion of the respondents gave different pre-lacteal foods to their newborns other than colostrum. 15.8 percent of slum respondents used to give sweetened water as pre-lacteal feed to their babies. It is to be mentioned that introducing formula milk to the newborns as first feed is higher (14.7 percent) among non-slum respondents.
Early initiation of breastfeeding is encouraged for a number of reasons. It is also benefitial for mothers because early suckling stimulates breast milk production and facilitates the release of oxytocin, which helps the contraction of the uterus and reduces postpartum blood loss. The first breast milk is known as colostrum, which is highly nutritious and contains antibodies that protect the newborn from infection and diseases. Early initiation of breastfeeding also encourages bonding between a mother and her newborn. Breast feeding within an hour or two after delivery is associated with the establishment of exclusive breast feeding and also for longer or more successful breast feeding.
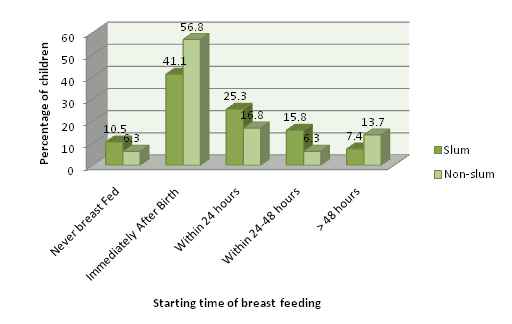
Percentage of mothers who had started breast feeding immediately after birth has been shown in figure 14, where it is seen that the rate is higher in non-slum areas which is 56.8 percent. However, 10.5 percent of slum children were never breast fed and in the non-slum areas it was 6.3 percent. First starting time of breast feeding of 7.4 percent babies of slum was after 48 hours of birth
Figure 13: Percent Distribution of Households by First Starting time of Breast Feeding
Colostrum is important for child’s nutrition, immunological protection and brain development. UNICEF and WHO recommend that children be fed colostrum (the first breast milk) immediately after birth and continue to be exclusively breastfed even if regular breast milk has not begun flowing. Table 10 illustrates that major parts of both slum and non-slum areas had fed colostrum to their newborns. The reason to reject colostrum was mostly mother’s illness. However this percentage was 56.5 in non-slum areas and 30.5 percent in slum areas.
Lack of knowledge about benefit of colostrum reflects a practical reasoning of the basic cause of rejecting colostrum. Almost all non-slum respondents (95.6 percent) reported that they knew about the benefits of colostrum, this percentage was 79.8 for slum respondents.
Exclusive Breast Feeding and Supplementary Feeding
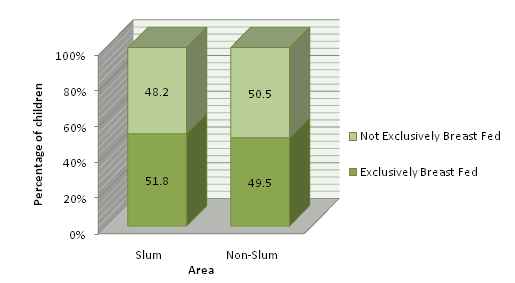
Exclusive breast feeding is recommended by WHO for the first six months from birth. Mother’s milk alone provides all the required nutrients for the baby at proper quantity and quality during this period. Figure 15 shows that exclusive breast feeding was not practiced in almost half of the total respondents in both slum(48.2 percent) and non-slum areas (50.5 percent).
Figure 14: Percent Distribution of Children according to Exclusive Breast Feeding
It is recommended that no supplementary food is needed from birth till 6 months if mother is not severely ill. Almost every mother is capable of breast feeding, rare exceptions can be due to HIV positive cases and other selective communicable disease conditions. However breast size, diet, fluid intake, exercise, multiple births sometimes cause less milk production. But infant suckling can initiate and sustain this breast feeding process. Artificial feeding is expensive and carries risks of additional illness, particularly where the levels of infectious disease are high and access to safe water is poor. So, if supplementary food is given to the child it has to ensure that foods are prepared and given in a safe manner, meaning that measures are taken to minimize the risk of contamination with pathogens. And they are given in a way that is appropriate, meaning that foods are of appropriate texture and given in sufficient quantity.
According to figure 16, Suji was the most common (33.3 percent) as supplementary feeding among slum respondents. However, 26.6 percent of slum respondents reported feeding confectionary or snacks as supplementary feeding which was very health hazardous. Because eating confectionary or snacks leads to less appetite and the growth chart automatically starts declining.
Figure 15: Percent Distribution of Slum Children according to Supplementary Feeding
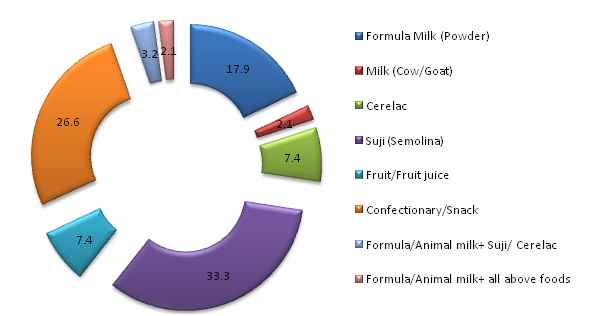
Figure 17 illustrates the percentage of feeding different supplementary foods in non-slum areas. Use of formula milk as supplementary feeding is found most common (52.1 percent) among non-slum respondents.
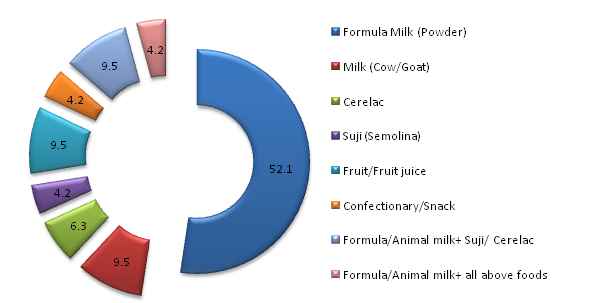
Figure 16: Percent Distribution of Noon-slum Children according to Supplementary Feeding
Some More Parts
Report On Comparative Study On Nutritional Status Of Children And Their Mothers (Part-2)