Introduction of Hydrogen Spectrum
A Hydrogen atom consists of only one proton and the electron that revolves in the electron cloud. The emission spectrum of Hydrogen is observed when the Hydrogen molecule breaks up into Hydrogen atoms and the electrons present in them are promoted to higher energy levels.
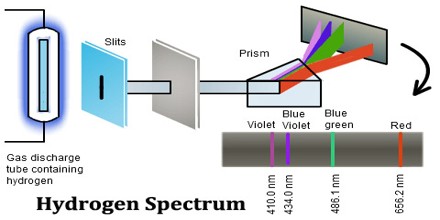
In physics a hydrogen atom consists of an electron orbiting its nucleus. The electromagnetic force between the electron and the nuclear proton leads to a set of quantum states for the electron, each with its own energy. These states were visualized by the Bohr model of the hydrogen atom as being distinct orbits around the nucleus. The Hydrogen spectrum is relatively simple and understandable easily as compared to other elements.
Hydrogen Spectrum Series
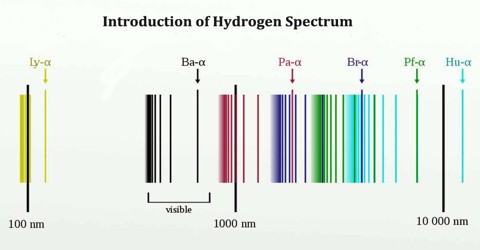
The complete spectrum of Hydrogen consists of separate series of distinct wavelengths concentrated in the ultra violet, visible and Infra-red regions of the electro –magnetic spectrum. The six series found are named after their discoverers. In the order of increasing wavelength they are the Lyman series (ultra violet), Balmer series (visible), Paschen series, Brackett series, Pfund series, and Humphrey’s series (infra-red).
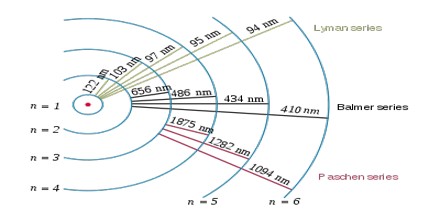
Lyman Series: – when the electron jumps from any higher stationary orbit to first stationary orbit, the spectral lines falls in the Lyman series. For Lyman series, ni=1.
Now putting nf=1 in the relation given by Bohr, w=RH(1/12 – 1/ni2), ni=2, 3, 4…
Balmer Series: – when the electron jumps from any higher stationary orbit to the second stationary orbit with n=2, the spectral lines falls in the Balmer Series. Here, ni=2
W=RH (1/22 – 1/ni2), ni=3, 4, 5…
Paschen Series: – when the electron falls from any higher stationary orbit to third stationary orbit with n=3, the spectral lines falls in the Paschen Series. Here nf=3
w= RH (1/32 – 1/ni2), ni=4, 5, 6…
Brackett Series: – when the electron jumps from any higher stationary orbit to fourth stationary orbit with n=4, the spectral lines fall in Bracket Series. Here, nf=4
w= RH (1/42 – 1/ni2), ni= 5, 6, 7…
Pfund Series: – when the electron from any higher stationary orbit jumps to fifth stationary orbit with n=5, the spectral lines falls in Pfund Series. Here, nf=5
w= RH (1/52 – 1/ni2), ni=6, 7, 8…
Humphrey Series: – when the electron falls from any higher stationary orbit to sixth stationary orbit with n=6, the spectral lines falls in Humphrey Series. Here nf=6
w= RH (1/32 – 1/ni2), ni=7, 8, 9…
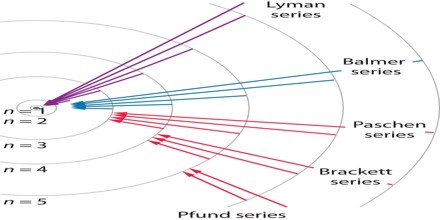
Each of these series is called line spectrum because the images in spectrometer appears as a pattern of thin vertical lines.
The Hydrogen emits a red- violet characteristic colour. This light when passed through a prism shows four separate lines in the visible range. These are Hα, Hβ, Hϒ, and Hδ. This is the spectrum of Balmer series for Hydrogen. These individual lines become more closely spaced in a regular way as we get to see from longer to shorter wavelengths.
The Origin of the Hydrogen Emission Spectrum
The lines in the hydrogen emission spectrum form regular patterns and can be represented by a (relatively) simple equation. Each line can be calculated from a combination of simple whole numbers.
When nothing is exciting it, hydrogen’s electron is in the first energy level – the level closest to the nucleus. But if you supply energy to the atom, the electron gets excited into a higher energy level – or even removed from the atom altogether.
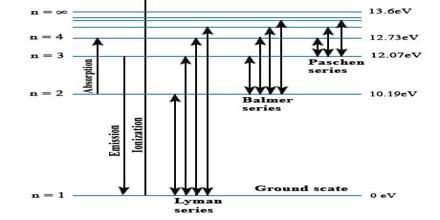
The high voltage in a discharge tube provides that energy. Hydrogen molecules are first broken up into hydrogen atoms (hence the atomic hydrogen emission spectrum) and electrons are then promoted into higher energy levels.
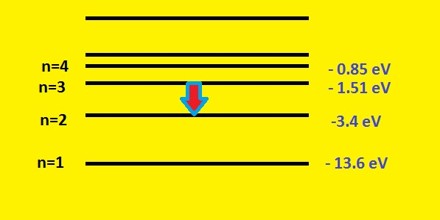
Suppose a particular electron was excited into the third energy level. This would tend to lose energy again by falling back down to a lower level. It could do this in two different ways.
It could fall all the way back down to the first level again, or it could fall back to the second level – and then, in a second jump, down to the first level.
Extension to Other Systems
The concepts of the Rydberg formula can be applied to any system with a single particle orbiting a nucleus, for example a He+ ion or a muonium exotic atom. The equation must be modified based on the system’s Bohr radius; emissions will be of a similar character but at a different range of energies.
All other atoms possess at least two electrons in their neutral form and the interactions between these electrons makes analysis of the spectrum by such simple methods as described here impractical. The deduction of the Rydberg formula was a major step in physics, but it was long before an extension to the spectra of other elements could be accomplished.
