Tree effect
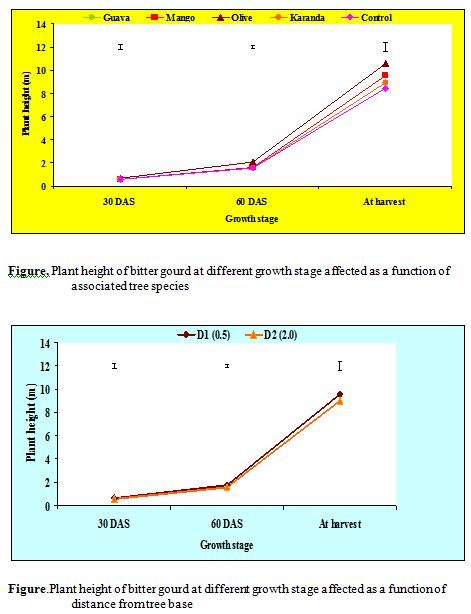
The height of bitter gourd plant was significantly influenced by different tree based agroforestry systems for all the growth period. Different agroforestry systems did not showed wide variation in the height of plant. Significantly the highest (0.65 m) plant height was recorded at 30 days after sowing (DAS) under O. europea based agroforestry system whereas the lowest (0.56 m) was observed under control treatment at the same time. At 60 DAS and at harvest time the highest (2.10 m and 10.60 m) plant height of bitter ground was obtained under O. europea species based agroforestry system while the lowest (1.57 m and 8.43 m) was observed under control treatment. Higher plant height was observed throughout the growth period when bitter ground grown under O. europea based agroforestry system. Under reduced sunlight the increased in internode length resulted increased the plant height. This was probably due to higher apical dominance under shade condition (Hillman, 1984).
Distance effect
Different spacing of lowerstorey crop from tree base had significantly influenced on plant height . At 30 DAS, the tallest (0.61 m) plant of bitter ground was recorded form the close distance (D1) while the shortest (0.57 m) plant was observed at D2 distance at that time. Similarly at 60 DAS and at harvest time the tallest (1.77 m and 9.56 m) bitter ground plant was recorded at D1 distance whereas the shortest plant was observed at D2 (1.58 m and 8.99 m) distance. Plant grown at closer distance form tree base experienced deep shade than longer distance which influenced apical dominance and plant height increased thereafter.
Combined effect between associated tree species and distance from tree base
Plant height of bitter gourd was significantly influenced by the combined effect of tree species and distance from tree base. The tallest (0.69 m) plant height was obtained at D1 distance under O. europea based agroforestry system and the shortest (0.54 m) was recorded at D1 distance under control treatment. Similar pattern of plant height was observed at 60 DAS and at harvest time. Significantly the tallest (2.13 m and 10.84 m) plant height was recorded at D1 distance under O. europea based system at 60 DAS and at harvest time whereas the shortest (1.47 m and 7.74 m) plant height was observed at D2 distance at the same time
Table 24: Combined effect between associated tree species and distance from tree base on plant height of bitter gourd
| Tree species | Distance from tree base (m) | Plant Height (m) | ||
30 DAS | 60 DAS | At harvest | ||
| P. guajava | D1(0.5) | 0.58 cd | 1.60 bc | 9.12 b |
D2(2.0) | 0.56 de | 1.58 bc | 8.30 c | |
| M. indica | D1(0.5) | 0.61 bc | 1.68 bc | 9.76 b |
D2(2.0) | 0.59 b-d | 1.57 bc | 9.28 b | |
| O. europea | D1(0.5) | 0.69 a | 2.13 a | 10.84 a |
D2(2.0) | 0.62 b | 1.78 b | 9.96 b | |
| C. acuminata | D1(0.5) | 0.58 c-e | 1.59 bc | 9.54 b |
D2(2.0) | 0.57 de | 1.54 bc | 8.28 c | |
| Control | D1(0.5) | 0.54 e | 1.57 bc | 9.50 b |
D2(2.0) | 0.58 cd | 1.47 c | 7.74 c | |
| CV (%) | – | 3.52 | 7.75 | 4.89 |
| LSD | – | 0.36 | 0.22 | 0.77 |
Plant duration
Tree effect
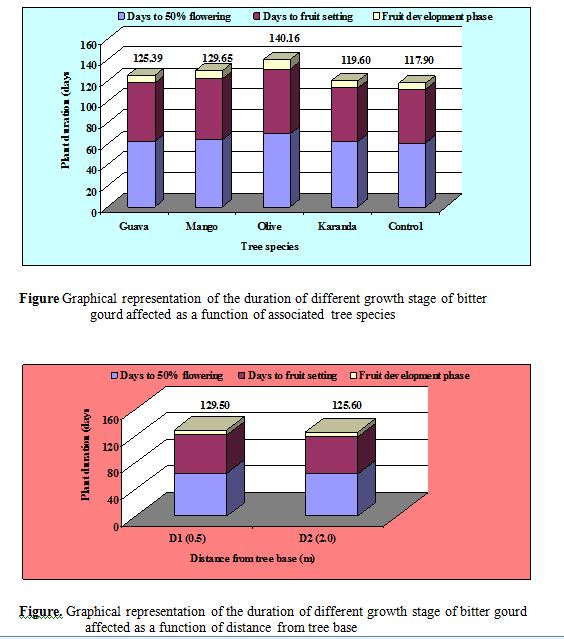
Different agroforestry systems had significant influence on plant duration of bitter gourd. The highest days to 50% flowering (69.33 days) was recorded under O. europea based agroforestry system whereas the lowest (60.83 days) was observed under control treatment. Days to fruit setting were recorded highest (61.67 days) under O. europea based system while the lowest (51.17 days) was observed under control treatment. Plant grown under full sunlight resulted shortest period to reach the first flowering stage. It means that shading somewhat delayed flowering. Similar finding was reported by Buge et al., (1987). Fruit development period and total crop duration were the longest (9.16 and 133.16 days) under O. europea based agroforestry system and the shortest (5.94 and 117.90 days) were recorded under contort treatment. The longer duration of individual fruit under reduced sunlight contributed to the longer crop duration by enhancing the post-anthesis growth duration.
Distance effect
Distance form the base had no significant influence on days to 50%flowering, days to fruit setting and fruit development periods. However the longer days to 50% flowering (64.47 days), days to fruit setting (57.13 days ) and fruit development period (7.77 days were obtained at closer distance (D1) from tree base while the shorter days to 50% flowering (62.80 days) and fruit development period (7.14 days) were recorded at D2 distance. Total crop duration had significantly influenced by the distance from tree base. The longest (129.37 days) days to crop duration was recorded at D1 distance whereas the shortest (125.81 days) crop duration was observed at D2 distance. Shading reduced the light intensity which enhance the post-anthesis growth period at closer distance form tree base and increased total crop duration.
Combined effect between associated tree species and distance form tree base
Plant duration of bitter gourd was significantly influenced by the combined effect of associated tree species and distance from base . The longest (71.67 days) days to 50% flowering was recorded at D1 distance under O. europea based agroforestry system whereas the shortest ( 60.67 days) days to 50% flowering was recorded at D2 distance under control treatment. Days to fruit setting were observed the longest (134.34 days) at D1 distance under O. europea tree based system and the shortest (112.00 days) at D2 distance under control treatment. Fruit development period and total crop duration were followed the same trend. The longest fruit development period (9.77 days) and total crop duration (138.70 days) were recorded at D1 distance under O. europea based agroforestry system while the shortest fruit development period (5.73 days) and total crop duration (117.70 days) were recorded at D1 distance under control treatment.
Table 25: Combined effect between associated tree species and distance from tree base on plant duration of bitter gourd
| Tree species | Distance from tree base (m) | Plant Duration | |||
Days to 50% flowering | Days to fruit setting | Fruit development phase (Days) | Total crop duration (days) | ||
| P. guajava | D1(0.5) | 62.67 c-e | 118.67 de | 8.01 b | 126.00 d |
D2(2.0) | 61.67 de | 116.67 e | 7.44 bc | 127.60 cd | |
| M. indica | D1(0.5) | 64.33 c | 122.33 cd | 8.17 b | 130.20 c |
D2(2.0) | 63.00 cd | 121.33 c | 7.46 bc | 128.80 cd | |
| O. europea | D1(0.5) | 71.67 a | 134.34 a | 9.77 a | 138.70 a |
D2(2.0) | 67.00 b | 130.67 b | 8.24 b | 134.20 b | |
| C. acuminata | D1(0.5) | 62.67 c-e | 113.67 f | 6.84 cd | 119.80 e |
D2(2.0) | 61.67 de | 112.67 f | 6.41 c-e | 119.40 e | |
| Control | D1(0.5) | 61.00 de | 112.00 f | 5.73 e | 117.70 e |
D2(2.0) | 60.67 e | 112.00 f | 6.14 de | 118.10 e | |
| CV (%) | – | 1.81 | 2.23 | 7.96 | 1.31 |
| LSD | – | 1.97 | 2.17 | 2.10 | 2.85 |
SPAD value (Soil Plant Analysis Development)
Tree effect
The SPAD value of bitter gourd under different agroforestry systems were measured and found significant variations. The highest (44.55) SPAD value was recorded under O. europea based agroforestry system while the lowest was (30.60) recorded under control treatment at 30 days after sowing (DAS). At 60 DAS, the highest (48.78) SPAD value was recorded under O. europea based system whereas the lowest (29.30) was observed under control treatment. SPAD value at harvest time was also significantly influenced by the tree based agroforestry system. The highest (40.13) SPAD value was observed under O. europea based agroforestry system while the lowest (29.27) was recorded under control treatment
Distance effect
SPAD value was significantly influenced by various distances from tree base. The highest (38.49) SPAD value was recorded at D1 distance while the lowest (35.01) was observed at D2 distance at 30 DAS. At 60 DAS and at harvest time the highest SPAD value were recorded at D1 distance and lowest was observed at D2 distance. Plants grown at vicinity of tree experience deep shade which helps to increased more chlorophyll to harvest more light. So, SPAD value at closer distance from tree base increased which decrease as the distance from tree base increased.
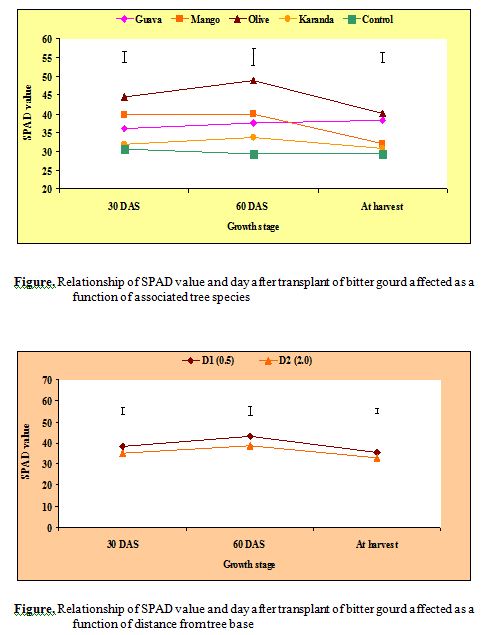
Combined effect between associated tree species and distance from tree base
SPAD value of bitter gourd was significantly influenced by tree species and distance from tree base. Irrespective of distance, the highest SPAD value was observed under O. europea based agroforestry system whereas the lowest was observed under control treatment (Table 26). The canopy of O. europea was deep and dense and the highest (45.43) SPAD value was recorded at D1 distance under this tree and the lowest (30.10) was recorded at D2 distance under control treatment at 30 DAS. Simultaneously, at 60 DAS and at harvest the highest (47.43 and 39.80) SPAD value was observed at D1 distance while the lowest (28.10 and 28.97) was recorded at D2 distance under control treatment.
Table 26. Combined effect between associated tree species and distance from tree base on SPAD value of bitter gourd
| Tree species | Distance from tree base (m) | SPAD value (30 DAS) | SPAD value (60 DAS) | SPAD value (at harvest) |
| P. guajava | D1(0.5) | 37.67 c | 38.93 b-d | 39.43 b |
D2(2.0) | 34.47 d | 36.27 c-e | 37.10 bc | |
| M. indica | D1(0.5) | 41.47 b | 40.80 bc | 33.37 d |
D2(2.0) | 38.00 c | 39.10 b-d | 30.77 de | |
| O. europea | D1(0.5) | 45.43 a | 47.43 a | 39.80 a |
D2(2.0) | 40.67 bc | 42.13 b | 36.47 c | |
| C. acuminata | D1(0.5) | 33.80 de | 34.57 d-f | 31.53 de |
D2(2.0) | 31.80 d-f | 32.73 ef | 30.07 e | |
| Control | D1(0.5) | 31.10 ef | 30.50 fg | 29.57 e |
D2(2.0) | 30.10 f | 28.10 g | 28.97 e | |
| CV (%) | – | 4.64 | 6.72 | 4.41 |
| LSD | – | 2.93 | 4.36 | 2.58 |
Stem diameter
Tree effect
In bitter gourd, the stem diameter was increased significantly at all levels of reduced light intensity under agroforestry systems. The highest (1.45 cm) stem diameter was observed under control treatment whereas the lowest (0.67 cm) was recorded under O. europea based agroforestry system.
Distance effect
Stem diameter was significantly influenced by the distance from tree base. The highest (1.12 cm) stem diameter was observed at D2 distance while the lowest (0.96 cm) was recorded at D1 distance irrespective of tree species.
Internode length
Tree effect
Bitter gourd plant exhibited the longest (18.97 cm) internode length under O. europea based agroforestry system and the shortest (9.99 cm) length was obtained under control treatment. Bitter gourd plant grown under tree experienced deep shade which exhibited apical dominance and hence increases internode length.
Distance effect
Internode length was not significantly influenced by the distance from tree base. The highest (13.20 cm) internode length was observed at D2 distance while the lowest (12.83 cm) was recorded at D1 distance irrespective of tree species (74.2).
Fruit number per plant
Tree effect
Number of fruits per plant is the most dominance yield contributing character, which was significantly influenced by various agroforestry systems (Fig. 75.1). The maximum (15.74 fruits/plant) number of fruits per plant was found under control treatment. A drastic reduction of fruits per plant was recorded as increasing shade level. Significantly the minimum number of fruits (11.44 fruits /plant) per plant was observed under O. europea based agroforestry system.
Distance effect
Fruit number per plant was not significantly influenced by the distance effect. However the maximum (14.71 fruits/plant) number of fruits per plant was recorded at D2 distance while the minimum (12.83 fruits/plant) was observed at D1 distance. Shade influence the vegetative growth then reproductive and hence under deep shade fruit number per plant was lower as compared to light shade and full sun light. Similar influencing pattern in number of fruits per plant was found in bottle gourd under reduced PAR levels (Miah, 2000).
Fruit length
Tree effect
Fruit length was also significantly influenced by the agroforestry systems . Fruit length increased with the increase of light levels. The highest (25.68 cm) fruit length was recorded under full sunlight whereas the lowest (20.10 cm) was observed under O. europea based agroforestry system. Under P. guajava, M. indica and C. acuminata based agroforestry systems fruits length was moderate. Similar result was found in cucumber under reduced PAR level (Haque, 2001).
Distance effect
Distance had no significant effect on the fruit length of bitter gourd. However, the highest (23.31 cm) fruit length was observed at D2 distance and the lowest (21.84 cm) was recorded at D1 distance irrespective of tree species.
Combined effect between associated tree species and distance from tree base
Stem diameter, internode length, fruit number per plant and fruit length were significantly influenced by the combined effect of associated tree species and distance from tree base (Table 27). The highest stem diameter (1.62 cm), fruits number per plant (18.37 fruits/plant ) and fruit length (23.90 cm) were recorded at D2 distance under control treatment while the highest (17.22 cm) internode length was recorded at D1 distance under O. europea based agroforestry system. Significantly, the lowest stem diameter (0.63 cm), fruits number (10.65 fruits/plant) and fruit length 19.71 cm) were recorded at D1 distance under O. europea based agroforestry system whereas the lowest (9.73 cm) internode length was observed at D2 distance under control treatment. Bitter gourd grown under tree based agroforestry systems exhibit different shade irrespective of tree species which decrease photosynthesis and increase internode length due to apical dominance.
Table : Combined effect between associated tree species and distance from tree base on stem diameter, internode length, fruit number plant-1 and fruit length of bitter gourd
| Tree species | Distance from tree base (m) | Stem diameter (cm) | Internode length (cm) | Fruit number plant-1 | Fruit length (cm) |
| P. guajava | D1(0.5) | 1.01 d | 12.25 e | 12.35 c-e | 21.55 c-e |
D2(2.0) | 1.20 c | 9.68 f | 13.52 b-d | 22.34 b-e | |
| M. indica | D1(0.5) | 0.67 f | 14.21 c | 12.22 de | 21.55 b-e |
D2(2.0) | 0.93 e | 12.54 de | 12.43 c-e | 21.85 b-e | |
| O. europea | D1(0.5) | 0.63 f | 17.22 a | 10.65 e | 19.71 e |
D2(2.0) | 0.66 f | 15.71 b | 11.11 de | 20.49 de | |
| C. acuminata | D1(0.5) | 1.18 c | 13.61 cd | 14.96 bc | 22.58 b-d |
D2(2.0) | 1.18 c | 9.96 f | 14.93 bc | 26.78 a | |
| Control | D1(0.5) | 1.28 b | 10.25 f | 15.13 b | 23.00 bc |
D2(2.0) | 1.62 a | 9.73 f | 18.37 a | 23.90 b | |
| CV (%) | – | 4.45 | 5.58 | 10.14 | 5.43 |
| LSD | – | 0.08 | 1.25 | 2.39 | 2.10 |
Fruit diameter
Tree effect
Fruit diameter of bitter gourd showed decreasing trend at reducing light levels under different agroforestry system but the variation was not significant. Data showed that the highest (51.35 cm) fruit diameter was observed under control treatment whereas the lowest (49.25 cm) fruits diameter was recorded under O. europea leased agroforestry system.
Distance effect
No significant variation of fruit diameter was observed at different distances from tree base. Higher fruit diameter was observed throughout the growing period when bitter gourd grown at D2 distance.
Single fruit weight
Tree effect
Single fruit weight was significantly affected under different agroforestry systems . The heaviest (169.80 g) single fruit weight was recorded under control treatment whereas the smallest (115.80 g) fruit was observed under O. europea based agroforestry system. Under reduced light condition (agroforestry system) translocation of the carbohydrates from source to sink is poor which reduced fruit yield significantly by reducing fruit size (Murty and Murty, 1981).
Distance effect
Single fruit weight was significantly influenced by distance from tree base. The heaviest (153.20 g) single fruit weight was obtained at D2 distance whereas the smallest (145.5 g) fruit weight was observed at vicinity to the tree (D1).
Yield
Tree effect
Eventually, there was significant influence of variation of light intensity (agroforestry system) on the yield of bitter gourd. Among the treatments, the highest yield (11.75 t/ha) was recorded under control treatment followed by C. acuminata (11.63 t/ha) based agroforestry system. The lowest (9.05 t/ha) yield of bitter gourd was recorded under O. europea based agroforestry system.
Diffuse light promotes the development of vegetative structure while intense light favors the development of flowers, fruits and seeds (Weaver and Clements, 1973). Light intensity also influences the translocation of carbohydrates from source to sink. Under reduced light condition, translocation of the carbohydrate from source to sink is poor which reduced total yield significantly (Murty and Murty, 1981). So bitter gourd yield was lower under agroforestry system as compared to control.
Distance effect
There was no significant variation of yield was observed at various distances from tree base. The highest (11.86) t/ha) bitter gourd yield was recorded at D2 distance while the lowest (11.63 t/ha) was recorded at D1 distance from tree base.
Bitter gourd grown at vicinity to tree got enough moisture as plant litters absorbed sufficient water but experience less sunlight as compared to away from tree base. On the other hand plants away from tree base uptake a little moisture but sufficient sunlight. So distance does not significantly affect the yield of bitter gourd. Emebiri and Nwufo (1994) observed similar trend as vegetable yield of Telfairia occidentails grown at various distance (3, 4, 5 and 6m) from row of M. indica trees remained unaffected by proximity to the tree line if moisture is not limited.Combined effect between associated tree species and distance from tree base
Bitter gourd fruit diameter, single fruit weight and yield were significantly affected by the combined effect of tree species and distance form tree base (Table 28). The highest (55.49 cm) fruit diameter was recorded at D1 distance under control treatment whereas the lowest (47.93 cm) was recorded at D1 distance under O. europea based agroforestry system. Single fruit weight and yield of bitter gourd were also followed the same pattern. The heaviest single fruit height (178.00 g) and yield (12.42 t/ha) were observed at D2 distance under control treatment whereas the smallest single fruit weight and the lowest yield (111.70 m and 9.17 t/ha) were recorded at D1 distance under O. europea based agroforestry system.
Under agroforestry systems, bitter gourd experience medium to deep shade which decreases photosynthesis and production of carbohydrates under O. europea species, the light intensity was much lower and carbohydrate production and transfer from source to sink was less as compared to M. indica, P. guajava and C. acuminata based agroforestry systems. So, yield of bitter gourd was much lower under O. europea based system than other agroforestry systems as well as control plot also.
Table 28: Combined effect between associated tree species and distance from tree base on fruit diameter, single fruit weight and yield of bitter gourd
| Tree species | Distance from tree base (m) | Fruit diameter (cm) | Single fruit weight (g) | Yield (tha-1) |
| P. guajava | D1(0.5) | 49.66 bc | 151.00 cd | 9.53 b |
D2(2.0) | 51.25 bc | 157.3 bc | 10.28 b | |
| M. indica | D1(0.5) | 48.60 bc | 148.00 d | 9.55 b |
D2(2.0) | 48.84 bc | 151.30 cd | 10.55 b | |
| O. europea | D1(0.5) | 47.93 c | 111.70 f | 9.17 b |
D2(2.0) | 48.80 bc | 120.00 e | 9.76 b | |
| C. acuminata | D1(0.5) | 49.73 bc | 155.30 b-d | 11.00 a |
D2(2.0) | 51.73 b | 158.3 bc | 11.07 a | |
| Control | D1(0.5) | 55.49 a | 161.7 b | 11.11 a |
D2(2.0) | 51.44 bc | 178.00 a | 12.42 a | |
| CV (%) | – | 3.66 | 2.82 | 7.55 |
| LSD | – | 3.17 | 7.23 | 1.59 |
Light intensity
Tree effect
Graphical representation of the effect of light intensity and day after measurement on bitter gourd field affected as a function of associated tree species was presented in figure 80.1. The relationship between day after measurement and light intensity was studied in the filed of bitter gourd and significant effect was observed. At the initial stage of cropping season the light intensity was lower which increased correspondingly with the increasing of day after measurement. The cropping season of bitter gourd was Kharif 2 season which was from June to September. At that time sun light was sufficient and the air temperature was high. As moderate to heavy rainfall occur during this cropping season. So, light intensity was not increased sharply but slowly.
Considering the tree species, the maximum light intensity was recorded under control treatment followed by C. acuminata based agroforestry system. On the other hand, the minimum light intensity was recorded under O. europea based system followed by M. indica and P. guajava.
C. acuminata species is bushy and the canopy was the lowest (1.69 m). So, light intensity was the same as control. The canopy area of O. europea is deep and dense and measured as (3.48 m2) which was more or less same as compared to M. indica (3.57 m2) and P. guajava (4.54 m2). The canopy of M. indica and P. guajava species were light and spreading branching. So, light penetration within O. europea canopy was lowest as compared to other tree species. As a result, the trend of light intensity throughout the bitter gourd growing period was control > C. acuminata> P. guajava > M. indica > O.europea.
Distance effect
No significant variation of light intensity was recorded as a function of distance form tree base (Fig. 80.2). However, the highest (880.5 µmm-2s-1) light intensity was observed at D2 distance whereas the lowest (790.9 µmm-2s-1) light intensity was observed at D1 distance.
Soil moisture
Tree effect
The relationship between day after measurement and soil moisture was studied is the field of bitter gourd intercropped with different tree species. The significant effect of soil moisture and day after measurement was observed (Fig. 81.1)
The slight variation of soil moisture was observed with the increase of day after measurement. Initially the soil moisture was higher which decreased with the increase of day after measurement. At initial stage of bitter gourd growing season (March to June), the soil moisture was higher due to irrigation application and litter rain. After that the rain decreased which decreased the soil moisture simultaneously.
Considering the tree species, the minimum soil moisture was observed under control treatment followed by C. acuminata based agroforestry system. The maximum soil moisture was recorded under O. europea based agroforestry system followed by M. indica and P. guajava. C. acuminata species has light canopy area (1.69 m2) with shallow root system which uptake more soil moisture. Moreover scorching sunlight helps to evapo-transpiration correspondingly. So, soil moisture under control and C. acuminata was least. While O. europea species had deep and dense crown which usually reduce sunlight penetration to the ground level. Moreover the plant litters make an organic layer over the ground and absorb much water. All the above phenomena helped to increase soil moisture under O. europea species. The soil moisture content under M. indica and P. guajava were moderate. As a result the trend of soil moisture at bitter gourd field throughout the growing period was O. europea> M. indica> P. guajava > C. acuminata > control.
Distance effect
Distance had significant effects on soil moisture content (Fig. 81.2). The highest (20.66%) soil moisture was recorded at D1 distance whereas the lowest (16.61%) was observed at D2 distance. Vicinity to the tree, the ground layer contains much plant litters which capture sufficient water. Moreover, air temperature at closest distance from tree base was lower which reduce evapo-transpiration. So nearest distance from tree, soil contains comparatively more moisture.
Soil temperature
Tree effect
The graphical representation of day after measurement and soil moisture was presented in the Figure 82.1 and significant effect was observed. Bitter gourd grown from March to June in the Kharif 1 season. At the initial stage, the soil temperature was lower as soil moisture was higher. After that the soil temperature increased gradually as irrigation reduced or stopped due to little rain occurs.
Considering the tree species, the highest soil temperature was recorded under control treatment. On the other hand the lowest was observed under O. europea based agroforestry system which was followed by M. indica, P. guajava and C. acuminata based agroforestry system. At the control plot, the air temperature was high and evaporation and transpiration occur simultaneously from soil and bitter gourd plant. So, soil temperature was high at the control plot. On the contrary, the agroforestry systems covered with crops as well as tree species which is turn reduce air temperature beneath the tree and the temperature was lower as compared to no tree control. Among the agroforestry system, the canopy of O. europea species was deep and dense which reduce soil temperature rapidly as compared to other agroforestry systems like M. indica, P. guajava and C. acuminata. So, the trend of soil temperature throughout the growing period of bitter gourd was control> C. acuminata> P. guajava> M. indica> O. europea.
Distance effect
Soil temperature was significantly influenced by the distance form tree base (Fig. 82.2). The highest (34.74 oC) soil temperature was recorded at D2 distance while the lowest (33.02 oC) was recorded at D1 distance.
Closest distance form tree base, air temperature was lower and plant litters create an organic layer which in turn reduce soil temperature and increase soil moisture as compared to longer distance form tree base.
Combined effect between associated tree species and distance from tree base
Climatic parameters like light intensity, soil moisture and soil temperature were significantly influenced by the combined effect of associated tree species and distance from tree base (Table 29). When distance increased, light intensity and soil temperature increased correspondingly whereas decrease soil moisture. Among the agroforestry systems, light intensity and soil temperature was the lowest (451.00 µmm-2s-1) and 29.80 oC) at D1 distance under O. europea based agroforestry system because of dense shade decrease the light intensity and soil temperature. The highest light intensity (1207.00 µmm-2s-1) and soil temperature (36.24 oC) were observed under control treatment as it was devoid of tree. On the other hand soil moisture decreased with increasing distance from tree base and decreasing canopy area. Significantly the highest (24.47%) soil moisture was obtained at D1 distance under O. europea based agroforestry system whereas the lowest (13.697%) was recorded at D1 distance under control treatment.
Table 29. Combined effect of associated tree species and distance from tree base on climatic parameters of bitter gourd
| Tree species | Distance from tree base (m) | Light intensity (μ molm-2s-1) | Soil moisture (%) | Soil temperature (0c) |
| P. guajava | D1(0.5) | 765.00 c | 20.54 b | 33.17 cd |
D2(2.0) | 804.00 c | 17.84 cd | 33.50 c | |
| M. indica | D1(0.5) | 669.30 cd | 16.12 de | 32.00 e |
D2(2.0) | 739.70 cd | 16.27 de | 32.31 de | |
| O. europea | D1(0.5) | 451.00 e | 24.47 a | 29.80 f |
D2(2.0) | 585.00 de | 21.26 b | 30.70 f | |
| C. acuminata | D1(0.5) | 1050.00 ab | 17.84 de | 33.17 cd |
D2(2.0) | 983.00 b | 19.18 bc | 33.97 bc | |
| Control | D1(0.5) | 1104.00 ab | 13.69 f | 36.24 a |
D2(2.0) | 1207.00 a | 14.15 ef | 34.91 b | |
| CV (%) | – | 11.57 | 6.99 | 1.77 |
| LSD | – | 165.90 | 2.24 | 1.03 |
Correction between light intensity (µmm-2s-1) and yield (tha-1) of bitter gourd
The relationship between light intensity and yield of bitter gourd under P. guajava based agroforestry system showed a linear relationship and estimated as Y = 0.0112 x + 6.2379 (R2 = 0.9283), where R2 value is positive and highly significant (Fig. 83). The R2 value indicated that about 93 percent of the contribution to the yield of bitter gourd can be explained by light intensity. This equation also stated that the yield o bitter gourd was minimum i.e. 11.7 t/ha at 510 µmm-2s-1 light intensity and an increased of this light intensity yield increased at the rate of 0.0112 t/ha for per unit changing of light intensity.
The linear relationship between light intensity and yield of bitter gourd under M. indica, O. europea and C. acuminata based agroforestry systems were positive and estimated as y = 0.008 x + 5.958 (R2 = 0.6997) for M. indica, Y= 0.0118x +5.3729 (R2 = 0.7423) for O. europea and Y = 0.0286x – 19.47(R2 = 0.8193) for C. acuminata. The R2 value of these systems was significant. The relationship also stated that the yield of bitter gourd under M. indica, O. europea and C. acuminata based systems were changed at the rate of 0.008 t/ha, 0.0118 t/ha and 0.0286 t/ha respectively, for per unit changing of light intensity.
Correlation between soil moisture (%) and yield (tha-1) of bitter gourd
The linear relationship between soil moisture and yield of bitter gourd under P. guajava, M. indica, O. europea and C. acuminata based agroforestry systems were estimated as Y = – 0.2062 + 15.919 (R2 = 0.7699) for P. guajava, Y = – 0.6492x + 21.372 (R2 = 0.6788) for M. indica, Y = -0.2406x + 15.482 (R2 = 0.6223) for O. europea and Y = -2.2422x + 54.339 (R2 = 0.7617) for C. acuminata. The R2 values of this equation for P. guajava, M. indica, O. europea and C. acuminata were about 77, 68, 62 and 76 percent respectively and significant. The relationship also stated that the yield of bitter gourd under P. guajava, M. indica O. europea and C. acuminata based system were decreased at the rate of 0.2062 t/ha, 0.6492 t/ha, 0.2406 t/ha and 2.2422 t/ha respectively for per unit changing of soil moisture.
Correlation between soil temperature (oC) and yield (tha-1) of bitter gourd
Correlation between soil temperature and yield of bitter gourd under P. guajava, M. indica O. europea and C. acuminata based agroforestry system were estimated as Y = 2.2976 x – 63.248 (R2 = 0.8482) for P. guajava, Y = 1.4998 x – 37.371 (R2 = 0.8365) for M. indica, Y = 0.777 x -12.362 (R2 = 0.7133) for O. europea and Y = 3.5452 x – 106.19 (R2 = 0.9186) for C. acuminata. The R2 value of these equations for biter gourd under different agroforestry systems were 0.8482, 0.8365, 0.7133 and 0.9186, respectively, which were positive and significant. The R2 values indicated that about 85, 84, 71 and 92 percent yield of bitter gourd under P. guajava, M. indica O. europea and C. acuminata based systems were attributed due to soil temperature. The relationship also stated that the yield of bitter gourd under different agroforestry systems were increased at the rate of 2.2976 t/ha, 1.4998 t/ha, 0.777 t/ha and 3.5452 t/ha respectively, for per unit changing of soil temperature.
Correction between canopy volume (m2) and yield (tha-1) of bitter gourd
Linear relationships between canopy volume and yield of bitter gourd were estimated as Y = – 4.2133 x + 38.63 (R2 = 0.8853) for P. guajava, Y= – 2.5933 x + 23.995 (R2 = 0.7614) for M. indica, Y = – 5.5307 x + 31.292 (R2 = 0.9731) for O. europea and Y = – 3.9612 x + 19.529 (R2 = 0.538) for C. acuminata. The R2 values of these equations are negative and significant. The R2 value indicated that about 89%, 76%, 97% and 54% yield of bitter gourd under P. guajava, M. indica, O. europea and C. acuminata were attributed due to canopy volume. The relationship also stated that the yield of bitter gourd under different systems were decreased at the rate of 4.2133 t/ha, 2.5933 t/ha, 5.5307 t/ha and 3.9612 t/ha respectively, for per unit changing of canopy volume (Fig. 86).