Growth Performance
Tree effect
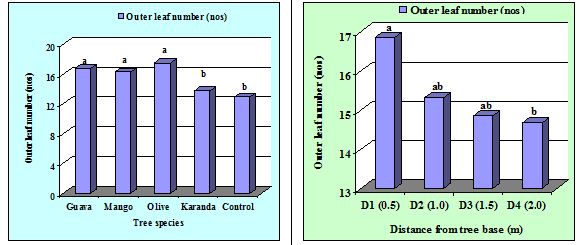
The number of outer leaf per plant of cabbage varied significantly with the disparity of tree species . Significantly the highest (17.50) number of outer leaf per plant was observed under O. europea based agroforestry system that was statistically identical to P. guajava (16.75) and M. indica (16.25) based systems. The lowest number of outer leaf of cabbage was recorded in the open field (12.92) which was statistically similar to C. acuminata based agroforestry system (13.75). Under full sunlight, modifications of maximum inner leave were turned into head formation. In this case lowest number of outer leaf was found. Similar result was found by Amin, et al.,(2010).
Distance effect
Outer leaf number of cabbage was significantly influenced by the effect of distance from tree base . The highest (16.87) outer leaf number was recorded at D1 distance which was statistically identical to that of D2 (15.33) and D3 (14.87) distances. Significantly the lowest (14.67) number of outer leaf was observed at D4 distance. The outer leaf number recorded at D4 distance was also identical to both D2 and D3 distances. Cabbage grew at far away from tree base (e g. D3 and D4) was got sufficient sunlight, nutrient and moisture which influenced modification of maximum inner leaf in head formation.
Outer leaf length
Tree effect
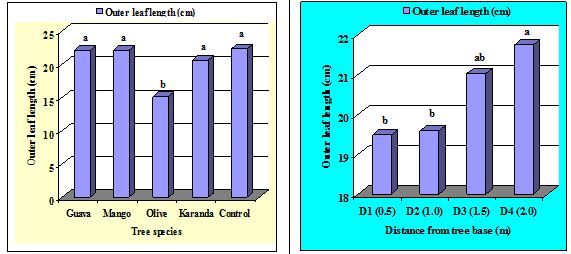
There was significant variation observed on outer leaf length among the treatments. The longest (22.33 cm) outer leaf length was recorded under control treatment which was statistically similar to P. guajava (22.10 cm), M. indica (22.09 cm) and C. acuminata (20.64 cm) based agroforestry system. Significantly the shortest (15.17 cm) outer leaf length was recorded under O. europea based agroforestry system . This may be attributed due to the low light intensity and competition of moisture and nutrient under shaded condition (Scott, 1987).
Distance effect
Statistically significant variation was recorded on outer leaf length of cabbage at various distances from tree base . The longest (21.75 cm) outer leaf length was observed at D4 distance followed by D3 (21.03 cm). The shortest (19.49 cm) outer leaf length was recorded at D1 distance which was statistically similar to D2 (19.59 cm) distance. Shade reduce photosynthesis which increase the leaf area for harvesting more light result in thinner and frequently smaller leaves thus reducing the volume of photosynthetic cells per unit leaf and affecting the LAI (Wilson and Cooper, 1969).
Outer leaf breadth
Tree effect
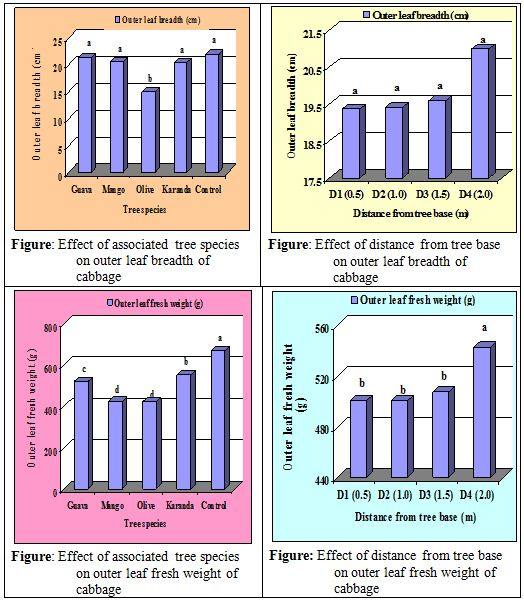
Outer leaf breadth of cabbage varied significantly under different agroforestry systems as compared to open field . Significantly the longest (21.92 cm) outer leaf breadth was recorded under control treatment which was statistically similar to that of M. indica (20.53 cm), P. guajava (21.35) and C. acuminata (20.41 cm) based agroforestry system. The shortest (15.00 cm) outer leaf breadth was found O. europea based agroforestry system.
Distance effect
There was no significant variation on outer leaf breadth of cabbage was observed among the treatments . The longest (20.99 cm) outer leaf breadth was found at D4 distance which was followed by D3 (19.59 cm), D2 (19.41 cm) and D4 (19.37 cm) distances. Outer leaf of cabbage cultivated at closer distance from tree base experienced deep shade with nutrient deficiencies resulting simulation of cellular expansion and cell division of outer leaf under shaded condition (Scott, 1987).
Outer leaf fresh weight
Tree effect
Fresh weight of outer leaf per plant was also affected by different tree species The highest ( 668.80 g) outer leaf fresh weight per plant was recorded when cabbage cultivation under control treatment, that was significantly different from C. acuminata (551.10 g) based agroforestry system. Significantly the lowest (421.80 g) outer leaf fresh weight was observed under O. europea based agroforestry system. This may be attributed due to higher number but minimum length and breadth of outer leaf under O. europea species (Deep shade). Under shaded condition leaves of cabbage was suffer much for sunlight, nutrient and soil moisture which in turn decrease its fresh weight. Amin et al., (2010) found same result as cabbage cultivated in open field produced highest outer leaf fresh weight.
Distance effect
Fresh weight of outer leaf of cabbage was significantly affected by distance from tree base . The highest (542.90 g) outer leaf fresh weight was recorded at D4 distance. Significantly the lowest (500.04 g) fresh weight of cabbage was obtained at D1 distance which was followed by D2 (500.04 g) and D3 (508.0 g) distances. Cabbage cultivation at closer distance from tree base experienced deep shade and lower nutrient and thus yield lower outer leaf fresh weight.
Combined effect between associated tree species and distance from tree base
Outer leaf umber of cabbage was significantly affected by the combined effect of tree species and distance from tree base (Table 19). Under O. europea species, the highest (21.33) outer leaf number was recorded at D1 distance which was followed by D2 (18.00), D3 (17.00) and D4 (16.67) distances. Significantly the lowest number of outer leaf was recorded at D3 (11.00) distance under control treatment. Under this treatment D1 (13.67), D2 (13.00) and D4 (12.33) distances produced almost similar outer leaf number per cabbage plant.
In case of outer leaf length D1 distance recorded the longest (25.00 cm) as compared to D2 (22.39 cm), D3 (22.36 cm) and D4 (21.96 cm) distances under control treatment. While D3 distance recorded the shortest (14.33 cm) outer leaf length distance under O. europea based agroforestry system.
Significant difference was also observed in case of outer leaf breadth of cabbage. D4 distance recorded the highest (26.50 cm) outer leaf breadth under control treatment. While the lowest (13.67 cm) outer leaf breadth was recorded at D3 distance under O. europea based system.
Similar trend was also recorded on outer leaf fresh weight of cabbage. O. europea species had the highest (740.00 g) outer leaf fresh weight at D2 distance which was statistically similar to D1 (722.00 g) under control treatment while the lowest (354.70 g) outer leaf fresh weight was recorded at D3 distance under O. europea based agroforestry system.
Table 19: Combined effect between associated tree species and distance from tree base on leaf characteristics of cabbage
Tree species | Distance from tree base (m) | Leaf Characteristics | |||
Outer leaf number (nos) | Outer leaf length (cm) | Outer leaf breadth (cm) | Outer leaf fresh weight (g) | ||
P. guajava | D1(0.5) | 16.00 b-e | 21.66 bc | 20.02 b | 436.7 f-h |
D2(1.0) | 16.33 b-d | 20.67 b-d | 20.76 b | 482.2 e | |
D3(1.5) | 16.67 bc | 21.66 bc | 22.78 b | 513.0 de | |
D4(2.0) | 16.67 bc | 22.17 b | 21.83 b | 585.3 c | |
M. indica | D1(0.5) | 16.00 b-e | 21.90 b | 20.71 b | 531.0 d |
D2(1.0) | 14.33 d-g | 22.39 b | 20.70 b | 566.6 c | |
D3(1.5) | 14.00 efg | 22.39 b | 20.05 b | 525.4 d | |
D4(2.0) | 14.33 d-g | 21.96 b | 20.67 b | 630.0 b | |
O. europea | D1(0.5) | 21.33 a | 16.33 e | 17.33 c | 404.4 h |
D2(1.0) | 18.00 b | 15.33 ef | 15.33 cd | 413.0 gh | |
D3(1.5) | 17.00 bc | 14.33 f | 13.67 d | 354.7 i | |
D4(2.0) | 16.67 bc | 21.96 b | 20.40 b | 633.3 b | |
C. acuminata | D1(0.5) | 16.00 b-e | 19.90 cd | 20.39 b | 511.0 de |
D2(1.0) | 16.00 b-e | 19.79 d | 20.33 b | 404.3 h | |
D3(1.5) | 15.33 c-f | 19.95 cd | 20.33 b | 448.7 f | |
D4(2.0) | 14.00 e-g | 19.50 d | 20.50 b | 417.3 f-h | |
Control | D1(0.5) | 13.67 fg | 25.00 a | 26.50 a | 722.0 a |
D2(1.0) | 13.00 gh | 22.39 b | 20.83 b | 740.0 a | |
D3(1.5) | 11.00 h | 22.36 b | 20.00 b | 580.0 c | |
D4(2.0) | 12.33 gh | 21.96 b | 26.50 a | 722.0 a | |
| CV(%) | – | 7.67 | 4.87 | 7.30 | 3.65 |
| LSD | – | 1.96 | 1.65 | 2.39 | 31.17 |
Crop duration
Tree effect
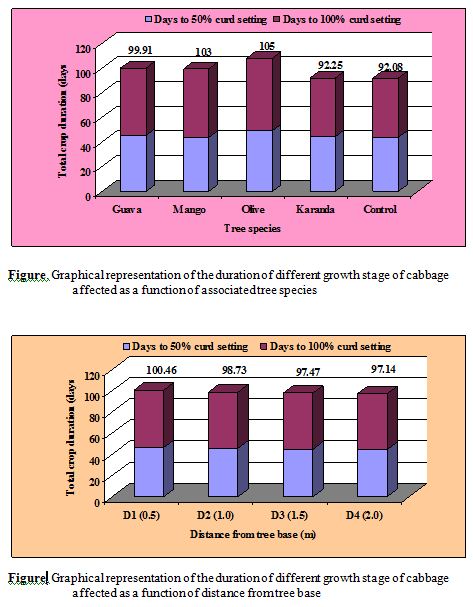
Crop duration was significantly affected by different treatments. Crop duration of cabbage increased significantly with increasing shade levels. The highest (49.33 days) days to 50% curd setting was recorded under O. europea species and the lowest (44.08 day) was recorded under control treatment which was statistically similar to C. acuminata (44.25 days), M. indica (44.00 day) and P. guajava (45.33 days) based agroforestry systems. Curd setting may be occurring due to the modification of maximum inner leaf into head formation which was governed by adequate light intensity and available nutrients. These phenomena were occurred under control treatment and curd setting day was reduced as compared to agroforestry systems.
Days to 100% curd setting and total crop duration of cabbage was recorded highest (59.00 days and 105.00 day respectively) under O. europea species which was statistically similar to M. indica (55.67 days and 103.00 days) based agroforestry system. Significantly the lowest (48.17 and 92.08 days respectively) days to 100% curd setting and total crop duration was recorded under control treatment. Sufficient nutrient and adequate sunlight may be helped to modification of maximum inner leaves into head formation. Therefore the reproductive period was longer under tree based agroforestry system as compared to full sunlight. Similar finding was reported by Buge et al., 1987.
Distance effect
There was no significant difference on days to 50% curd setting, 100% curd setting and total crop duration among the distances . However, the maximum days to 50% curd setting (46.33 days), 100% curd setting (54.13 days) and total crop duration (100.46 days) were observed at D1 distance and the minimum days to 50% curd setting (44.47 days), 100 % curd setting (52.60 days) and total crop duration (97.14) was observed at D4 distance. Cabbage cultivation away from tree base got adequate sunlight and sufficient nutrient which therefore helped to modification of maximum inner leaves into head formation and hence need fewer days to curd setting and total crop duration as compared to cabbage cultivation at closer distance from tree base.
Combined effect between associated tree species and distance
Days to 50% curd setting, 100% curd setting and total crop duration were significantly affected by the combined effect of tree species and distance from tree base (Table 20). Significantly the maximum (52.67 days) day to 50% curd setting was recorded under O. europea species at D1 distance which was followed by D2 (48.33 days), D3 (47.00 days) and D4 (46.67 days) distances. The minimum (43.00 days) days to 50% curd setting was recorded at D2 distance which was statistically similar to D3 (43.00 days), D1(43.33 days) and D4 (43.33 days) distances under control treatment. Similarly the maximum days to 100% curd setting and total crop duration were (62.67 and 115.34 days respectively) recorded at D1 distance under O. europea species and the minimum days to 100% curd setting and total crop duration were recorded at D4 distance (46.67 and 90.00 days respectively) under control treatment.
Table 20: Combined effect between associated tree species and distance from tree base on crop duration of cabbage
Tree species | Distance from tree base | Crop duration (days) | ||
Days to 50% curd setting | Days to 100% curd setting | Total crop duration | ||
P. guajava | D1(0.5) | 46.33 b-e | 54.00 cd | 100.33 cd |
D2(1.0) | 45.00 c-e | 52.67 c-e | 96.00 cd | |
D3(1.5) | 44.00 c-e | 52.33 c-e | 95.33 cd | |
D4(2.0) | 43.67 c-e | 56.00 bc | 99.00 cd | |
M. indica | D1(0.5) | 46.67 b-d | 58.33 b | 105.00 a-c |
D2(1.0) | 45.67 b-e | 53.67 c-e | 99.34 b-d | |
D3(1.5) | 44.67 c-e | 54.00 cd | 98.67 cd | |
D4(2.0) | 44.33 c-e | 57.67 b | 102.00 de | |
O. europea | D1(0.5) | 52.67 a | 62.67 a | 115.34 a |
D2(1.0) | 48.33 b | 58.33 b | 106.66 ab | |
D3(1.5) | 47.00 bc | 58.33 b | 105.33 a-c | |
D4(2.0) | 46.67 b-d | 59.00 b | 105.67 a-c | |
C. acuminata | D1(0.5) | 44.00 c-e | 50.33 d-f | 94.33 e-g |
D2(1.0) | 44.00 c-e | 50.00 ef | 94.00 ef | |
D3(1.5) | 44.67 c-e | 48.00 fg | 92.67 fg | |
D4(2.0) | 44.67 c-e | 47.33 fg | 92.00 fg | |
Control | D1(0.5) | 43.33 de | 47.00 fg | 92.00 fg |
D2(1.0) | 43.00 e | 47.33 fg | 91.33 fg | |
D3(1.5) | 43.00 e | 47.33 g | 91.00 g | |
D4(2.0) | 43.33 de | 46.67 g | 90.00 g | |
| CV(%) | – | 3.80 | 3.84 | 2.63 |
| LSD | – | 2.85 | 3.37 | 4.25 |
SPAD value (Soil Plant Analysis Development)
Tree effect
SPAD reading accounted for various agroforestry systems showed that cabbage showed considerably highest (54.42) SPAD reading at 30 days after transplant (DAT) under O. europea based agroforestry system which was statistically similar to P. guajava (51.57). Significantly the lowest SPAD reading (41.53) was recorded under control treatment at the same DAT. At 60 DAT and at harvest time the highest SPAD reading were recorded i.e 61.99 and 80.72 respectively under O. europea species and the lowest (54.47 and 61.18) was recorded under control treatment. Importance of SPAD value was demonstrated by Peng et al., (1996) which many be used directly to monitor leaf N status in rice and determine the time of top dressing of nitrogen. Hasan et al., (2007) observed considerably higher SPAD value at flowering (60 DAT) of rice.
Distance effect
Distance from tree base also affected the SPAD reading of cabbage at different DAT. At 30 days after transplant, the highest (52.71) SPAD value was recorded at D1 distance while the lowest (46.89) SPAD value was recorded at D4 distance which was statistically similar to that of D3 (47.22) and D2 (48.33) distances. No significant variation was observed on SPAD value at 60 DAT and at harvest time. The highest SPAD value at 60 DAT and at harvest time was observed at D1 distance (60.23 and 73.78 respectively) while the lowest reading was observed at D4 distance under the same cropping time. Cabbage cultivation at closer distance from tree base, harvest more PAR resulting uptake enough nitrogen from soil. So, leaves of cabbage turned into deep green and SPAD value increases.
Combined effect between associated tree species and distance from tree base
SPAD value of cabbage was significantly affected by the combined effect of associated tree species and distance from tree base (Table 21). Significantly the highest SPAD reading was recorded at D1 distance at 30 DAT (63.23), 60 DAT (72.15) and at harvest (87.83) time under O. europea species. The lowest SPAD value was recorded at D4 distance on 30 DAT (41.10), 60 DAT (52.70) and at harvest time (56.23) under control treatment. Cabbage grown at closer distance from tree base experienced deep shade as compared to far away and therefore impatient to uptake more nitrogen from soil which in turn helped to increase leaf area. Thus SPAD reading was higher on closer plant as compared to distant from tree base.
Table 21: Combined effect between associated tree species and distance from tree base on SPAD value in cabbage field
Tree species | Distance from tree base | SPAD value (30 DAT) | SPAD value (60 DAT) | SPAD value (at harvest) |
P. guajava | D1(0.5) | 49.63 d-f | 58.47 b-e | 75.57 bc |
D2(1.0) | 49.20 ef | 58.63 b-e | 74.47 bc | |
D3(1.5) | 51.43 c-e | 56.99 b-e | 67.87 de | |
D4(2.0) | 49.37 ef | 58.79 b-e | 69.87 cd | |
M. indica | D1(0.5) | 53.77 bc | 58.00 b-e | 74.23 bc |
D2(1.0) | 48.23 e-g | 59.50 b-d | 75.87 bc | |
D3(1.5) | 49.73 d-f | 56.66 b-e | 77.63 b | |
D4(2.0) | 49.70 d-f | 57.95 b-e | 69.83 cd | |
O. europea | D1(0.5) | 63.23 a | 72.15 a | 87.43 a |
D2(1.0) | 55.33 b | 61.01 b | 79.23 b | |
D3(1.5) | 53.33 b-d | 59.89 bc | 78.90 b | |
D4(2.0) | 52.10 b-e | 59.00 b-d | 77.33 b | |
C. acuminata | D1(0.5) | 49.00 ef | 57.38 b-e | 65.10 d-g |
D2(1.0) | 46.03 f-h | 54.62 c-e | 62.13 e-h | |
D3(1.5) | 44.20 h-j | 53.53 de | 63.13 e-g | |
D4(2.0) | 45.30 g-i | 54.86 b-e | 61.60 f-h | |
Control | D1(0.5) | 42.20 ij | 54.99 b-e | 66.57 d-f |
D2(1.0) | 41.53 j | 55.33 b-e | 61.80 e-h | |
D3(1.5) | 41.30 j | 53.90 c-e | 60.13 gh | |
D4(2.0) | 41.10 j | 52.70 e | 56.23 h | |
| CV(%) | – | 4.13 | 5.48 | 4.71 |
| LSD | – | 3.33 | 5.23 | 5.47 |
Yield Performance
Head length
Tree effect
The important yield contributing character of cabbage is head length. Head length was affected by the different upperstorey trees . Significantly the largest (18.54 cm) cabbage head was recorded under control plot and the smallest (14.60 cm) was recorded under O. europea species which was statistically similar to that of M. indica (15.18 cm), P. guajava (15.20 cm) and C. acuminata (15.65 cm) based agroforestry system. Cabbage grown under full sunlight produced largest head because of modification of maximum inner leaves into head formation which governed by adequate light intensity and sufficient soil nutrients. Similar results were observed by Amin et al., (2010).
Distance effect
No significant variation of cabbage head length was observed when it was cultivated at various distances (0.5, 1.0, 1.5 and 2.0 m) from tree base . The largest (16.18 cm) cabbage head length was recorded at D4 distance which was followed by D3 (15.99 cm) and D2 (15.70 cm) distance. D1 distance produced the smallest cabbage head (15.47). Cabbage cultivation at closer distance from tree base received insufficient PAR and nutrients which drastically reduced the inner leaf into head formation.
Head breadth
Tree effect
Like head length, head breadth of cabbage was significantly affected by various agroforestry systems. Maximum head breadth (17.87 cm) was found when cabbage cultivation under full sunlight . Significantly the minimum (13.07 cm) head breadth of cabbage was recorded under O. europea species which was statistically similar to M. indica (14.43 cm), P. guajava (13.91 cm) and C. acuminata (14.77) based agroforestry system. In the full sunlight cabbage plant harvest adequate PAR and soil nutrient and hence maximum inner leaf turned into head formation. Amin et al., (2010) observed minimum head breadth (11.32 cm) under maximum shade levels (Kala koro -1) and maximum head breadth under open field ( 15.42 cm).
Distance effect
There was no significant variation was observed as cabbage grown at various distances from tree base. The maximum (16.02 cm) cabbage head breadth was recorded at D4 distance and the minimum (13.90) was recorded at D1 distance from tree base .
Head weight
Tree effect
Influencing pattern of different agroforestry systems on head weight of cabbage were observed which was similar to the head length. The highest (1.97 kg) fresh head weight of cabbage was observed under open field and the lowest (1.40 kg) head weight of cabbage was observed under O. europea based agroforestry system . The lowest head weight per plant may be due to lower production of photosynthates under tree (low light condition) for a longer period (Miah et al., 1999).
Distance effect
Significant variation of head weight per plant was observed when cabbage grown as a function of distance from tree base . Significantly the highest head weight (1.72 kg) was observed at D3 distance followed by D4 (1.68 kg) and D2 (1.65 kg) distances. The lowest (1.52 kg) head weight of cabbage was recorded at D1 distance from tree base.
Yield (t/ha)
Tree effect
Marketable yield of cabbage (t/ha) was significantly influenced by different agroforestry systems. Total yield showed the similar trend to that of head weight per plant of cabbage. Yield of cabbage was gradually decreased with the increase of shade level . The highest (69.03 t/ha) yield of cabbage was recorded under open field which was statistically different from C. acuminata (62.22 t/ha). The highest yield of cabbage under 30-47% shaded condition was found by Wolff and Coltman (1990). Significantly the lowest (44.00 t/ha) yield was recorded under O. europea based agroforestry system which was statistically similar to M. indica (51.80 t/ha) based agroforestry system.
Distance effect
Yield of cabbage was also influenced by distance from tree base . Significantly the highest cabbage yield (59.05 t/ha) was recorded at D3 distance which was statistically similar to D4 (57.88 t/ha) and D2 (56.69 t/ha) distances. The lowest cabbage yield was recorded at D1 (52.17 t/ha) distance. Lower light condition exerted lower production of photosynthates for a longer period (Miah et al., 1999)
Combined effect between associated tree species and distance from tree base
Head length of cabbage was significantly influenced by the combined effect of associated tree species and distance from tree base (Table 22). The highest (20.73 cm) length of cabbage was recorded at D4 distance and the second highest was recorded at D3 (17.53 cm) distance which was followed by D2 (16.57 cm) and D1 (16.33 cm) distances under control treatment while the lowest (13.83 cm) length of cabbage was recorded at D1 distance which was statistically similar to D4, D3 and D2 distances under O. europea based agroforestry system.
Similarly the highest cabbage breadth was recorded at D4 (20.83 cm) distance under control treatment and the lowest was recorded at D1 (12.46 cm) distance under O. europea species. In case of head weight of cabbage per plant, the maximum (2.10 kg) head weight of cabbage was recorded at D4 distance which was statistically similar to D3 (2.02 kg) distance under control treatments. While the minimum (1.36 kg) cabbage head weight was recorded at D1 distance which was statistically similar to D2, D3 and D4 distances under O. europea based system. Similar pattern of yield of cabbage was also observed. Significantly the highest (68.25 t/ha) cabbage yield was recorded to D4 distance followed by D3 (65.45 t/ha) distance under control treatment while the lowest (47.40 t/ha) cabbage yield was recorded at D1 distance which was statistically similar to D2, D3 and D4 distance under O. europea species.
Cabbage cultivation under O. europea species experienced deep shade and high moisture. As distance increased, shade and soil moisture decreased corresponding which helped adequate sunlight penetrated to the ground level and moisture and nutrient availability was increased. Thus, increased distance from tree base promote cabbage yield.
Table 22. Combined effect of associated tree species and distance from tree base on yield and yield contributing characteristics of cabbage
Tree species | Distance from tree base | Head length (cm) | Head breadth (cm) | Head weight (kg) | Yield (Tha-1) |
P. guajava | D1(0.5) | 15.07 b-d | 13.22 ef | 1.53 g-i | 53.68 fg |
D2(1.0) | 15.83 b-d | 14.40 bf | 1.56 gh | 54.55 e-g | |
D3(1.5) | 15.73 b-d | 13.61 d-f | 1.71 ef | 59.61 cd | |
D4(2.0) | 16.20 b-d | 13.57 d-f | 1.62 fg | 56.80 d-f | |
M. indica | D1(0.5) | 15.87 b-d | 13.72 c-f | 1.4 ij | 49.56 hi |
D2(1.0) | 15.57 b-d | 14.50 b-f | 1.52 g-i | 53.15 f-h | |
D3(1.5) | 15.63 b-d | 14.91 b-f | 1.57 g | 55.02 ef | |
D4(2.0) | 15.38 b-d | 14.57 b-f | 1.45 h-j | 50.82 ghi | |
O. europea | D1(0.5) | 13.83 d | 12.46 f | 1.36 j | 47.40 i |
D2(1.0) | 14.47 cd | 12.63 f | 1.38 j | 48.20 i | |
D3(1.5) | 14.85 b-d | 13.83 b-f | 1.37 j | 47.77 i | |
D4(2.0) | 14.73 cd | 14.17 b-f | 1.37 j | 47.92 i | |
C. acuminata | D1(0.5) | 14.73 cd | 14.17 b-f | 1.63 fg | 57.12 d-f |
D2(1.0) | 14.13 cd | 14.67 b-f | 1.85 cd | 64.89 ab | |
D3(1.5) | 15.83 b-d | 15.30 b-e | 1.78 de | 64.95 ab | |
D4(2.0) | 14.67 cd | 14.97 bf | 1.85 cd | 62.47 bc | |
Control | D1(0.5) | 16.33 b-d | 15.93 b-d | 1.95 bc | 58.22 de |
D2(1.0) | 16.57 bc | 16.30 bc | 1.81 de | 63.12 bc | |
D3(1.5) | 17.53 b | 16.43 b | 2.02 ab | 65.45 ab | |
D4(2.0) | 20.73 a | 20.83 a | 2.10 a | 68.25 a | |
| CV(%) | – | 8.63 | 8.94 | 3.77 | 3.82 |
| LSD |
| 2.26 | 2.19 | 0.10 | 3.56 |
Light intensity
Tree effect
The relationship between days after measurement and light intensity (µmm-2s-1) was studied in the cabbage field intercropped with different tree species and significant effects of light intensity was recorded with the increase of day after measurement. At the initial stage, the light intensity was higher for all the tree species. Those were decreased gradually up to 100 days after measurement.
Considering the tree species under agroforestry system, the minimum light intensity was recorded for O. europea species throughout the cabbage growing season. On the other hand, the maximum light intensity was observed under control treatment i.e., cabbage grown in the open field. This was followed by C. acuminata, P. guajava and M. indica. As a result, the trend of light intensity throughout the cabbage growing season for different agroforestry systems were control > C. acuminata > P. guajava > M. indica > O. europea.
Distance effect
No significant variation of light intensity (µmm-2s-1) was recorded when cabbage cultivation as a distance from tree base . The highest light intensity (417.3 µmm-2s-1) was observed at D4 distance followed by D3 (411.4 µmm-2s-1), D2 (400.8 µmm-2s-1) and D1 (395.2 µmm-2s-1) distances. Around the trunk of a tree, the ground area was most shady. Therefore as the distance from tree base increase, the light intensity increased significantly. So, light usually penetrate through the apex of the canopy and hence light intensity increased as the distance from tree base increased.
Cabbage cultivation under P. guajava M. indica, O. europea and C. acuminata based agroforestry system and under full sunlight (open field) experienced different kind of shade due to various canopy levels. It was observed that canopy area of P. guajava was the highest (3.45 m2) which is spreading and light. So, light usually pass through the P. guajava canopy. Although the canopy area of M. indica (2.82 m2) and O. europea (2.42 m2) was more or less same and were deep and dense as compared to P. guajava, so light usually retard penetration to the ground area. The canopy of C. acuminata species was comparatively small (1.60 m2) resulting the trend of light passing through the canopy of the tree species were control > C. acuminata >P. guajava> M. indica> O. europea.