Prime objective of the report is to analyze the issue of quality for garments exporting and analyzing overall performances, here focus on Quality Product is Main Issue of Customer Satisfaction of Titanic Garments. Other objectives are analyze the customers perception about the products and analyze current marketing strategies practiced by Titanic. Finally identify the link between our study and real fact and analyze existing distribution process of Titanic Garments.
Objectives of the Study
The research report has a broad objective and some specific objectives.
Broad Objective
The broad objective of the report is
- To analyze the issue of quality for garments exporting.
- Analyzing overall performances
Short Objectives
The specific objectives of the report are:
- To analyze the customers perception about the products
- To analyze current marketing strategies practiced by Titanic.
- To analyze existing distribution process of Titanic.
- To know the actual situation and contribution of RMG to the country.
- To identify the link between our study & real fact.
- To increase our ability & skill for future steps.
Significance of the Report
Garments industry is one of the major economic pillars for Bangladesh economy. Large amount of foreign currency are being earned by this sectors with good reputation. As this sector has entered in quota free market so our garments industry has been faced in significant competitive market. So quality product with reasonable price is mandatory for capturing the market share. So finding the most effective process to be the best is very much crucial for us. So wise steps and policy would be effective tools for our garments and it will help it to sit in driving position among the world’s garments market. So this report will be very much helpful for following:
- Management of Titanic.
- Members of the BGMEA.
- Members of the BKMEA.
- Buyers of garments and accessories.
- Students of textiles and garments manufacturing
Research Methodology
- Research type:
It is a descriptive research.
- Source of data:
In this report all-necessary information to prepare are collected forms both sources of data.
These are:
Primary data: It includes the following sources of data. In depth interview with questionnaire.
Secondary data: I need much information for the report, which we get from secondary data. These are:
- Annual Report of Textown group.
- Annual report of Titanic garments.
- Different types of brochures of Titanic garments.
- google.com.
- textowngroup.com
Data Collection Procedure:
- Secondary: Secondary data has been collected through the discussion session with officials and their given documents about the company and their business activities.
- Primary: A semi structured questionnaire has been prepared in order to collect data for the analysis part of the report. The proposed sample size is 6 buyers who have been selected by Non probability judgmental random sampling method.
Contact methods:
To collect data for the report I use personal or face to face contact method which flexibility, quantity of data collection, response rate is good.
Research Instrument
Questionnaires are prepared with very flexibility consisted with close ended & open ended questions to get actual answers and find out the result about customers perception and about the market.
Questionnaire
Questionnaire has been designed with the semi structured questions with
- A4 paper size has been used.
- of pages 3.
- Both open ended & Close ended questions are used in the questionnaire and average administer time is 10 minutes.
- 12 questions are designed to gather information.
Sampling Plan:
- Population: All garments buyers in Bangladesh are the population size.
- Sample elements: Buyers of garments industry of Bangladesh
- Sample frame: No structured sample frame has been found.
- Sampling Procedure: Non probability judgmental random sampling method has been used for this research
Analysis & reporting:
I have used different types of statistical tools and computer software for analyzing and reporting my gathered information, such as – Microsoft Excel, Microsoft Word.
Company Profile:
Titanic is one of the member production factories of Textown which has been operated from 1997 with modern equipment machineries to produce high quality product with reasonable pricing. Textown group is a 100% export oriented vertically setup Knit garments manufacturing industry, started its journey through minuscule operation. Today it has its own clients list of renowned principles and export to EU countries especially Sweden, Germany, Netherlands, UK, Italy, France. A brief profile is given below:
| Period | Events |
| 1990 | Beginning of Production of Textown with 27 sewing machines. |
| 1997 | A modern equipped factory named Titanic for readymade garment production. |
| 2003 | A modern vertically setup plant including knitting, dying fabric finishing and garment manufacturing units. |
| 2005 | Printing Factory named “Teximage” for screen and allover printing. |
| 1996 | Expanded its first Ornate factory with modern machineries and equipments. |
| 1997 | Embroidery factory and new mashing plant to support its production process |
Aptitude Production:
- Knitting, aptitude is 12 tons/day.
- Dying, aptitude is 12 tons/day.
- Sewing, 40 thousands/10 hours.
- In finishing, 40 thousands/10 hours.
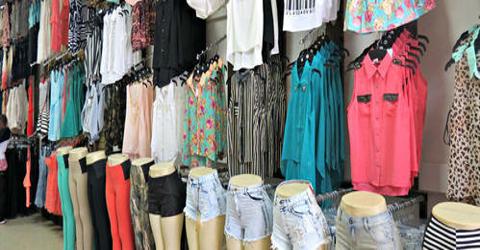
Products Item:
- Basic tee,
- Polo.
- Top.
- Trouser.
- And other fancy items for boys, girls, mans and ladies.
Fabric: 100 % cotton, polyester, cvc, pc and elasten with 2% to 10% single joursey, rib, interlock, pique.
Production Unit of Titanic:
Knitting Machines:
50 Japan and Taiwan origins Fukuhara & Poilung branded machine having different diameter knitting ability is used in production of Titanic.
Dyeing Machines:
Most of the dyeing machines of Titanic are China Origin Fongs branded.
Titanic has Italy Turkey and Taiwan based Fabric processing and Finishing machine of different fames band like CORINO; ARIOLI; LAFAR;ACC;BEANCO; HC-AEN; LAFAR;PC-7
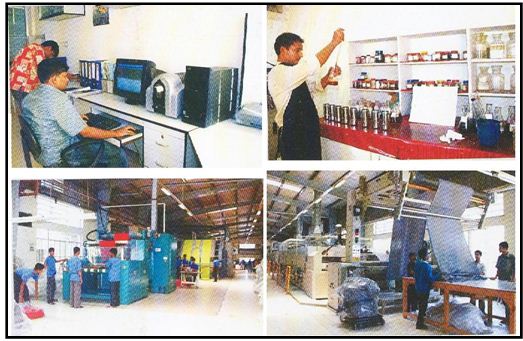
Textown group has total 30 sewing lines in three garment factory. All production lines are agronomic and well designed considering human factor engineering. These 30 lines are designed to manufacture 14 for basic T-shirt, 6-for polo shirt and 10 for fancy ladies items. This have Japan and China based 750 Sewing M/C of JUKI; BROTHER; PEGASUS brand.
Spectacular working environments are ensured by the management for protecting employees and the environment from dust and fumes. Dealing perfectly with noise & noise pollutions, Mange harmful substances in different section safely brings high performance and significant success for this group. Cooling and exhaust system are available for air refreshment and meeting maximum workplace standard in all sections, compliance regulations are strictly followed which bring a positive impression on this garments group and buyers and all external bodies are highly satisfied especially organization of human rights and protecting environment from pollution.
Marketing
Marketing is one of the major sectors for an organization which help the organization to reach to the goal effectively and efficiently. It is the process by companies creates value for customers and builds strong customer relationships in order to capture value from customers in return.
In achieving the business goal organization have to identify their target customers groups to which they provide the products. For this, organization screen out their potential customers group through
- Market Segmentation – The process of dividing a market into distinct groups of buyers with different needs, characteristics or behavior.
- Target Marketing – The process of evaluating each market segment’s attractiveness and selecting one or more segments to enter.
- Market Positioning – Occupying a clear, distinctive and desirable place relative to competing products in the minds of target customers.
In achieving the target effectively marketing tools are used to provide the products to the customers. Marketing tools is known as marketing mix or 4ps.
The marketing mix is probably the most famous phrase in marketing. Marketing decisions generally fall into the following four controllable categories:
- Product
- Price
- Place (distribution)
- Promotion
4Ps analysis
- Product: “Anything that can be offered to a market for attention, acquisition, use or consumption that might satisfy a want or need. In includes physical ob-jects, services, persons, places, organizations and ideas.”
- Price: “The amount of money charged for a product or service, or the sum of the values that consumers exchange for the benefits of having or using the product or service.”
- Promotion: “Activities that communicate the product or service and its merits to target customers and persuade them to buy.”
- Place: “All the company activities that make the product or service available to target customers.”
Product:
The product is the most important aspect of the marketing mix. Products have both tangible and intangible benefits. Tangible benefits include benefits which can be measured such as the top speed of a car. Intangible benefits are benefits that cannot be measured such as the enjoyment of the customer will get from the product.
Exactly what product or service are you going to sell to this market? Define it in terms of what it does for your customer. How does it help your customer to achieve, avoid or preserve something? You must be clear about the benefit you offer and how the customer’s life or work will be improved if he or she buys what you sell.
Here are some examples of the product decisions to be made:
- Brand name
- Functionality
- Styling
- Quality
- Safety
- Packaging
- Repairs and Support
- Warranty
- Accessories and services
Price:
The amount of money customers have to pay to obtain the product. Many things influence prices, including the number of suppliers, the number of customers, and the availability of the product.
Effective pricing for a product is very much important to keep current customers and potential customers. If the price is too high consumers will avoid the product as they will believe it to be too expensive yet if the product is priced too low they may believe that there is something wrong with the product for it to be so cheap. But in luxuries or fashionable products or in case of reputed brand product value pricing is important. So in here extra price should be charged for their values which differentiate it from others related products. In this case this statement the higher the price, the more you sell will be effective. So pricing of products should be taken very carefully so that customers can measure price with their expected quality.
Exactly how much are you going to charge for your product or service, and on what basis? How are you going to price it to sell at retail? How are you going to sell it at wholesale? How are you going to charge for volume discounts? Is your price correct based on your costs and the prices of your competitors?
Some examples of pricing decisions to be made include:
- Pricing strategy (skim, penetration, etc.)
- Suggested retail price
- Volume discounts and wholesale pricing
- Cash and early payment discounts
- Seasonal pricing
- Bundling
- Price flexibility
- Price discrimination
Place:
Company activities that make the product available to target consumers. Getting the product to the customer as quickly and conveniently as possible is an essential aspect of marketing mix. The place is not where is located your business but where our customers are.
Distribution is about getting the products to the customer. Some examples of distribution decisions include:
- Distribution channels
- Market coverage (inclusive, selective, or exclusive distribution)
- Specific channel members
- Inventory management
- Warehousing
- Distribution centers
- Order processing
- Transportation
- Reverse logistics
Promotion:
Promotion includes all the activities designed to bring a company’s goods or services to the favorable attention of customers. That means the steps or activities that communicate the merits of the products and persuade target customers to buy it.
It represents the various aspects of marketing communication, that is, the communication of information about the product with the goal of generating a positive customer response. Marketing communication decisions include:
- Promotional strategy (push, pull, etc.)
- Advertising
- Personal selling & sales force
- Sales promotions
- Public relations & publicity
- Marketing communications budget
Titanic is a leading RMG in Bangladesh which is running their business with well reputation in world wide. They believe in quality product which can only be the factor to be competitive in global market and can bring the competitive success in RMG market in this globalization world.
Titanic is committed to meet and exceed customer requirements in making garments and obviously meet its own employee satisfaction. They are gradually reducing rejection and re work rate in in-process and final garments in order to ensure product quality and delivery time as per buyer’s requirements and increase profitability. They are ensuring adequate training and suitable work environment to enhance productivity and skills of the employee.
“Customer Satisfaction is quality” is their main strategy. Titanic means it. They have several quality circles to maintain quality. They work based on statistical quality control. Their production process is based on AQL 2.5 and whole production maintains it. They are going through Total Quality Management (TQM). We inspect their fabric in 4 point system. We are running a bundle system to maintain quality and smooth production.
Titanic has a very promising strategy about workers’ welfare and lifestyle development. They are running their company under SA8000 compliance criteria. Most of their buyer’s have Okotex certification.
Worker remuneration & wellbeing policy:
They have recognized the bare minimum wage announced by the Bangladeshi regime. They were subsequent & giving all the payback that were settled by the worker’s side and owner’s side by the last pact established by the Bangladeshi Government, RMG industries and worker leaders. They have also a guiding principle to receive the ISO standard about the worker payback. They are as long as urgent situation loan for our employees. They have transport amenities of worker and officers.
Good planning can bring success whatever the tough issue in business world. Effective marketing planning or strategy is now a crucial issue for achieving business goal efficiently. The Consumer Electronics department looks after the marketing aspect of the C.E. products, assembled and imported by the Transcom Electronics Limited. Transcom Electronics Limited is a strong challenger in the consumer electronics market only because of its strong marketing strategies and implementation. They have different promotional activities as well as strong distribution network through out the country.
“Marketing mix” is a framework which acts as a guideline for marketers to implement a marketing concept. It consists of a set of major decision areas that a company needs to manage in order to at least satisfy consumer needs.
According to Kotler Armstrong, the marketing mix is a set of “controllable tactical marketing tools [product, price, place, promotion] that the firm blends to produce the response it wants in the target market”.
The marketing mix consists of everything the firm can do to influence the demand for its product.
Project part
Geography
Bangladesh has been enclosed by Indian Territory except for a short south-eastern frontier with Burma and borders the Bay of Bengal in the south. Most of the country is formed by the alluvial plain of the Ganges-Brahmaputra river system – the largest delta in the world; water flow is second only to that of the Amazon. To the east of the delta lie the Chittagong Hill Tracts. Bangladesh’s principal natural resource is natural gas.In winter the mean temperature is about 16 degrees centigrade (53F) and in summer 27 degrees centigrade (80F).
Bangladesh Opportunity:
Bangladesh – the country of world famous muslin fabric which exports its apparel products worth nearly 5 billion US$ per year to the USA, EU, Canada and other countries of the world. At present the country is the 6th largest apparel supplier to the USA and EU countries. The major products are Knit and Woven Shirts and Blouses, Trousers, Skirts, Shorts, Jackets, Sweaters, Sportswear and many more casual and fashion apparels.
Investment ambiance of Bangladesh:
The Government of Bangladesh offers great incentives for encouraging the use of local fabrics in the export oriented garment industries. For encouraging textile export, the import of capital machinery is duty-free. Import of cotton is also duty-free. Moreover, the Government has recently implemented several policy reforms to create a more open and competitive climate for foreign investment.
Bangladesh is endowed with abundant and cheap labour force that is easily trainable and convertible into semi-skilled and skilled work force. Price, heavily weighted by the labour cost, is one of the main determinants of comparative advantage in the labour-intensive garment industry. The price of labour in our country is lower compared to some of our neighboring countries as well as some other garment producing countries in South-East Asia and East Europe. Obviously, existence of such cheap but easily trainable labour is one of the advantages that Bangladesh enjoys and will be enjoying over a considerable period in the context of international trade on clothing.
Estimate shows that about 80 percent of garment accessories like cartons, threads, buttons, labels, poly bags, gum tapes, shirt boards, neck boards etc. are now being produced in our country, contributing to the national GDP. But, the textile (Spinning, Weaving, Finishing etc.) industry is just budding.
Presently, the total fabric requirement in our captive market is for about 3 billion yards, of which about 85-90 percent we import from countries like China, India, Hong Kong, Singapore, Thailand, Korea, Indonesia, Taiwan, etc.. Fabric requirement is increasing @ 20 percent per annum. This offers a tremendous opportunity for further industrializations in our country.
Some figures are given below which are about the garments export to abroad:
Table of total export in MN.US$ and MN.DZ of Woven and Knit
| YEAR | TOTAL APPAREL EXPORT IN MN.US$ | TOTAL APPAREL EXPORT IN MN.DZ | ||||
| WOVEN | KNIT | TOTAL | WOVEN | KNIT | TOTAL | |
| 1992-93 | 1240.48 | 204.54 | 1445.02 | 36.05 | 10.66 | 46.71 |
| 1993-94 | 1291.65 | 264.14 | 1555.79 | 34.35 | 10.81 | 45.16 |
| 1994-95 | 1835.09 | 393.26 | 2228.35 | 47.21 | 15.30 | 62.51 |
| 1995-96 | 1948.81 | 598.32 | 2547.13 | 48.82 | 23.18 | 72.00 |
| 1996-97 | 2237.95 | 763.30 | 3001.25 | 53.45 | 27.54 | 80.99 |
| 1997-98 | 2844.43 | 937.51 | 3781.94 | 65.59 | 32.60 | 98.19 |
| 1998-99 | 2984.96 | 1035.02 | 4019.98 | 64.79 | 36.66 | 101.45 |
| 1999-2000 | 3081.19 | 1268.22 | 4349.41 | 66.63 | 45.27 | 111.90 |
| 2000-2001 | 3364.32 | 1495.51 | 4859.83 | 71.48 | 52.54 | 124.02 |
| 2001-2002 | 3124.82 | 1458.93 | 4583.75 | 77.05 | 63.39 | 140.44 |
| 2002-2003 | 3258.27 | 1653.82 | 4912.09 | 82.83 | 69.18 | 152.01 |
| 2003-2004 | 3538.07 | 2148.02 | 5686.09 | 90.48 | 91.60 | 182.08 |
| 2004-2005 | 3598.20 | 2819.47 | 6417.67 | 92.26 | 120.13 | 212.39 |
| 2005-2006 (Jul-Aug) | 701.53 | 662.63 | 1364.16 | 18.46 | 28.81 | 47.27 |
| YEAR | SHIRTS | TROUSERS | JACKETS | T-SHIRT | SWEATER |
| 1993-94 | 805.34 | 80.56 | 126.85 | 225.90 | …. |
| 1994-95 | 791.20 | 101.23 | 146.83 | 232.24 | …. |
| 1995-96 | 807.66 | 112.02 | 171.73 | 366.36 | 70.41 |
| 1996-97 | 759.57 | 230.98 | 309.21 | 391.21 | 196.60 |
| 1997-98 | 961.13 | 333.28 | 467.19 | 388.50 | 296.29 |
| 1998-99 | 1043.11 | 394.85 | 393.44 | 471.88 | 271.70 |
| 1999-2000 | 1021.17 | 484.06 | 439.77 | 563.58 | 325.07 |
| 2000-2001 | 1073.59 | 656.33 | 573.74 | 597.42 | 476.87 |
| 2001-2002 | 871.21 | 636.61 | 412.34 | 546.28 | 517.83 |
| 2002-2003 | 1019.87 | 643.66 | 464.51 | 642.62 | 578.37 |
| 2003-2004 | 1116.57 | 1334.85 | 364.77 | 1062.10 | 616.31 |
| 2004-2005 | 1053.34 | 1667.72 | 430.28 | 1349.71 | 893.12 |
| 2005-2006 (Jul-Aug) | 199.96 | 304.22 | 117.14 | 199.90 | 299.94 |
Export Policy: (Related to the garments industry.) Source: (Business Info Bangladesh)
Strategies:
The following strategies shall be undertaken to attain the objectives of the export policy 1997 – 2001:
- Simplifying export procedures and helping the private sector achieve efficiency. The Govt. desires more and more involvement of the private sector while the govt. will continue to play its facilitating role;
- Ensuring maximum use of local raw materials in the production of export goods and encouraging establishment of backward linkage industries;
- Participation in the international trade fairs, specialized fairs, single country exhibitions abroad and also sending out trade missions, with a view to consolidating our position in the existing market and creating new markets;
- Encouraging export of new category high value added readymade garments and also encouraging the concerned trade associations for establishment of a Fashion Institute;
- Organizing regularly international trade fairs and product-specific fairs with the country;
- Making appropriate development and expansion of infrastructure conducive to export;
- Ensuring maximum utilization of financial and other assistance extended by the World Trade Organization to the Least Developed Countries;
- Taking necessary steps to assist procurement of raw materials by the export oriented industries at world price;
Past Performance Of International RMG
Cost:
Expansions of Garments Sector in Bangladesh have been increasing significantly comparatively to others in South Asia cause of its low labour cost. This issue has become the most powerful competitive advantages for this sector. For low labour cost Bangladesh can able to charge economy cost which help Bangladesh to get the export order and maximize the market share. For quota system of USA. and EU. Bangladesh couldn’t able to export to USA & EU. above a specific range. Bangladesh export garments product on 95 % quota based. In Bangladesh, the share of total export earnings from garments increased from 12 per cent in 1985 to over 73 per cent in 1998.
Technology:
Technology is one of main factor to be competitive in the world market. It helps to reach to economy scale of production at minimum cost. But few garments of Bangladesh used high technology in this sector. So it was very tough to fight with the global market previous. But with increasing the demand, the use of high technology has been increased which make strong the position of garments of Bangladesh.
Government Policy:
As it is the main source of foreign currency earning so government of Bangladesh has been trying to help by taking different policy. The democratic government is highly keen to stimulate the economy within short time. Government has liberalized the industrial and investment policies in recent years by reducing bureaucratic control over private investment and opening up many areas.
Infrastructure:
To achieve high growth rate of garments industry government has developed infrastructure. Government ensure the utilities system and developed export processing zone. First EPZ has been established in Chittagong and second in Savar, Dhaka.
By developing EPZ government can ensure the effective & efficient export processing system. By following table, the investment & recovery on EPZ can be clarified.
Table Government’s investment (million Taka) and recovery (% of investment)
| Year | Investment | Income | Annual recovery | |||
| Land | Factory building | Total | Land | Factory building | ||
| CEPZ | ||||||
| 1974 – 85 | 248.9 | 1.5 | 3.4 | 4.9 | 0.62 | 1.35 |
| 1985 – 93 | 452.6 | 63.3 | 136.3 | 199.6 | 8.18 | 17.64 |
| 1993 – 98 | 360.3 | 228.1 | 211.3 | 439.4 | 25 | 30.47 |
| DEPZ | ||||||
| 1989 – 98 | 724.4 | 78.8 | 248.4 | 327.2 | 10.87 | 32.30 |
Source: BEPZA
Compliance:
- Training programme for managers, Supervisors and workers to raise productivity.
- Country’s overall infrastructure development.
- Development of backward linkages with a view to improving the value added within the manufacturing sector and attaining self-sufficiency for long-term sustainability.
Present Position of International RMG
Sector Highlights:
The fastest growing industry in Bangladesh with RMG accounting for more than 75% of total exports.
Bangladesh is best placed in the region for textiles and garments because of cheap labor and trade status with the EU.
Government incentives for the spinning and weaving industries include a 15% cash subsidy of the fabric cost to exporters sourcing fabrics locally.
There is a huge fabric demand supply gap in the RMG industry which is being me by imports. Thus the potential for backward linkage industry is enormous.
Reasons behind fast growing of garments in Bangladesh:
The phenomenal growth in RMG was experienced in the last decade. With about 2,600 factories and a workforce of 1.4 million, RMG jointly with knitwear accounted for more than 70% of total investments in the manufacturing sector during the first half of the 1990’s.
Cost:
Now Bangladesh is in global competition in where no quota is available for developing country. So as like others Bangladesh has to compete with various factors. Pricing is one of the main factors. In quota based system Bangladesh did not require concern hardly for pricing. But at globalization stage Bangladesh has to compete in the open market. So to export it needs concern deeply about pricing.
Price Increasing Factor:
- Raw-material price.
- Labour cost.
- Utilities, etc.
Technology:
Now we are in the 21st century. So at this globalization age we have to consider the science & technology by which we can achieve our target and reach to our goal effectively & efficiently. To produce the optimum level of production at minimum cost technology is hardly required. By using high technology production can be increased significantly.
Fiscal Policy:
- Tax holiday.
- Accelerated Depreciation
- Allowance instead of tax holiday.
- Concessionary Income tax in lied of Tax holding/Accelerated.
- Concessionary duty/duty free import of capital machinery.
- Avoidance of Double taxation.
Non-Financial Policy:
- 100% foreign equity allowed.
- Unrestricted exit policy.
- Full repatriation facilities of dividend
- Permanent residence permit on investment at certain level.
Infrastructure:
Following an Act of Parliament in 1980, the first EPZ of the country was established in Chittagong in 1983. The second one started operations in 1993 at Savar near Dhaka. Six more are in process of implementation at Gazipur, Mongla, Ishwardi, Comilla Saidpur and Sirajganj. The government has signed an agreement with the Republic of Korea to establish a Korean EPZ in Chittagong. Bangladesh has also two international see port which contribute in exporting.
Compliance:
At present garments industry walks in a critical way and pass critical time. Because of upheaval of garment workers on 22nd May 2006 international buyers and investors feel danger with their investment in garments industry. Workers are arguing about their wages and salary to be standard for living. In another side foreign investors and buyers threat the entrepreneur of garments to solve this problem as soon as possible and take protection for future occurrence. Otherwise they withdraw their investment and order.
As a result ultimately Bangladesh can loss their market share for cost increasing. entrepreneur of garments to solve this problem as soon as possible and take protection for future occurrence. Otherwise they withdraw their investment and order.
As a result ultimately Bangladesh can loss their market share for cost increasing.
Social Program
- Elimination of Child Labor from the Garment Sector of Bangladesh
On 4 July 1995 Bangladesh created history by signing a MoU on elimination of child labor from the garment sector. It was the culmination of long and arduous negotiations with ILO and Unicef and concentrated effort of BGMEA. BGMEA takes pride in declaring the garment sector of Bangladesh child labor free since 1 November 1996.The main objective of such a program of BGMEA with active collaboration of Unicef and ILO is to establish the basic right of the children by rehabilitating and providing elementary schools for the under age workers eliminated from the garment factories.
Internal Competition:
To make fit for the wide competition, internal competition is very important playing role. When hard competitions exist in the whole industry the product quality can be assured at minimum price.
From graph we can see that the total market share and in specific area’s market share. By exporting to this country Bangladesh earn large amount of foreign currency. Its large market is EU and export to this about its 19% export. Second are US which import from Bangladesh about 17%.
Source: South Asia Multi disciplinary Advisory Team (SAAT). International Labour Organization.
This graph represents the market share in garments exporting to EU and US market. India is the first ranking in SAARC region and its market share is high. Bangladesh is in 2nd position and Srilanka is in 4th position and it has no market share to EU market.
Source: South Asia Multi disciplinary Advisory Team (SAAT). International Labour Organization.
When quota system was existed then no country can export above range of export. So competition was not exist vary much among the exporters. At that time Bangladesh got preference to be exporter of them and export around 95%. Srilanka was able to export 62%, Pakistan, Nepal, India could export chronologically 90%, 80% and 73%.
Bangladesh’s Competitive Advantages in the Garment Sector.
Major Comparative Advantage:
- Location advantages.
- Large workforce.
- High quality at a cheaper rate.
Others:
- Literate and skilled labor.
- Young enthusiastic Workforce
- Country wide network
- Strong and competitive infrastructure.
- Competitive pricing
- Market and investor friendly policies of the government.
- Democratic Governance
- Natural Resources (Gas & Coal)
- Attractive incentive packages
- Govt.’s support to develop private sector
Financial statement
A financial institution that is licensed to deal with money and its substitutes by the accepting time and demand deposit, making loans, and investing in security. The Bank or garments generate profits from the different in the interest rate charged and paid. Banks also may offer investment and insurance product which they were once prohibited from selling.
All of the Garments position we can shortly summarize in the financial statement. So, financial statement is very important as a financial institution. An investor invests the money into the Banks or other institution is looking the organization financial statement.
Cash flow statement
A cash flow statement or statement of cash flows is a financial statement that shows how changes in balance sheet and income accounts affect cash and cash equivalents, and breaks the analysis down to operating, investing, and financing activities. As an analytical tool, the statement of cash flows is useful in determining the short-term viability of a company, particularly its ability to pay bills. International Accounting Standard 7 (IAS 7) is the International Accounting Standard that deals with cash flow statements.
(Rs crore)
Mar ‘ 09 Mar ‘ 08 Mar ‘ 07 Mar ‘ 06
Profit before tax 16.05 14.52 15.23 7.39
Net cashflow-operating activity 0.80 16.6 16.22 -4.53
Net cash used in investing activity -15.35 -14.91 -73.26 -17.17
Net cash used in fin. activity 9.18 -9.29 69.62 15.02
Net inc/dec in cash and equivlnt -5.36 -7.60 12.57 -6.68
Cash and equivalnt begin of year 6.16 13.76 1.19 7.87
Cash and equivalnt end of year 0.80 6.16 13.76 1.19
Income Statement
Income statement, also called profit and loss statement (P&L) and Statement of Operations, is a company’s financial statement that indicates how the revenue (money received from the sale of products and services before expenses are taken out, is transformed into the net income (the result after all revenues and expenses have been accounted for). The purpose of the income statement is to show managers and investors whether the company made or lost money during the period being reported.
Profit loss account (Rs crore)
Mar ‘ 09 Mar ‘ 08 Mar ‘ 07 Mar ‘ 06
Income
Operating income 198.91 192.90 162.16 111.20
Expenses
Material consumed 85.45 116.12 105.52 75.59
Manufacturing expenses 33.87 3.79 1.88 1.32
Personnel expenses 38.57 37.37 28.46 18.56
Selling expenses 1.59 2.25 1.51 1.57
Administrative expenses 4.63 4.54 3.39 3.37
Expenses capitalized – – – –
Cost of sales 164.11 164.06 140.76 100.41
Operating profit 34.80 28.84 21.40 10.79
Other recurring income 1.61 0.75 1.04 0.37
Adjusted PBDIT 36.41 29.59 22.45 11.16
Financial expenses 16.25 11.29 5.24 2.35
Depreciation 6.08 4.92 1.94 1.43
Other write offs – – – 0.03
Adjusted PBT 14.08 13.38 15.26 7.36
Tax charges 6.09 5.78 5.59 2.92
Adjusted PAT 7.99 7.60 9.67 4.43
Non recurring items 1.97 1.14 -0.03 0.04
Other non cash adjustments – 0.10 -0.09 -0.04
Reported net profit 9.96 8.84 9.55 4.43
Earnings before appropriation 33.64 25.46 17.93 8.92
Equity dividend 1.19 0.95 0.71 0.48
Preference dividend – – – –
Dividend tax 0.20 0.16 0.12 0.07
Retained earnings 32.25 24.35 17.10 8.38
Balance sheet
Balance sheet or statement of financial position is a summary of a person’s or organization’s balances. Assets, liabilities and ownership equity are listed as of a specific date, such as the end of its financial year. A balance sheet is often described as a snapshot of a company’s financial condition.[1] Of the four basic financial statements, the balance sheet is the only statement which applies to a single point in time.
Balance sheet (Rs crore)
Mar ‘ 09 Mar ‘ 08 Mar ‘ 07 Mar ‘ 06
Sources of funds
Owner’s fun
Equity share capital 4.75 4.75 4.75 4.75
Share application money – – – –
Preference share capital – – – –
Reserves & surplus 33.62 25.05 17.30 8.58
Loan funds
Secured loans 137.88 114.61 113.43 36.79
Unsecured loans – – – –
Total 176.25 144.41 135.48 50.12
Uses of funds
Fixed assets
Gross block 141.34 114.01 99.27 28.14
Less : revaluation reserve – – – –
Less : accumulated depreciation 18.30 12.65 7.75 5.95
Net block 123.03 101.36 91.52 22.19
Capital work-in-progress 0.68 13.34 13.19 8.49
Investments – – – –
Net current assets
Current assets, loans & advances 90.41 68.87 59.89 36.40
Less : current liabilities & provisions 37.88 39.16 29.12 16.97
Total net current assets 52.53 29.71 30.76 19.44
Miscellaneous expenses not written – – – –
Total 176.25 144.41 135.48 50.12
Notes:
Book value of unquoted investments – – – –
Market value of quoted investments 0.06 0.07 0.07 0.07
Contingent liabilities 0.72 – 0.15 3.87
Number of equity shares outstanding (Lacs) 475.00 475.00 475.00 475.00
Dividend
Year Month Dividend (%)
2009 Jul 25
2008 Jul 20
2007 Jul 15
2005 Oct 10
Annual results in brief (Rs core)
Mar ‘ 09 Mar ‘ 08 Mar ‘ 07 Mar ‘ 06
Sales 182.39 176.11 152.96 105.83
Operating profit 18.28 12.05 12.18 5.40
Interest 16.25 11.29 5.24 2.35
Gross profit 22.13 19.44 17.18 8.82
EPS (Rs) 2.10 1.86 2.01 0.93
Annual results in details
Mar ‘ 09 Mar ‘ 08 Mar ‘ 07 Mar ‘ 06
Other income 20.10 18.68 10.24 5.77
Stock adjustment -1.50 -0.47 2.49 -1.57
Raw material 115.26 120.08 104.72 78.46
Power and fuel 5.06 – – –
Employee expenses 38.57 37.37 28.18 18.32
Excise – – –
Admin and selling expenses – – –
Research and development expenses – – –
Expenses capitalised – – –
Other expenses 6.73 7.09 5.39 5.21
Provisions made – – – –
Depreciation 6.08 4.92 1.95 1.43
Taxation 6.10 5.68 5.68 2.96
Net profit / loss 9.96 8.84 9.55 4.43
Extra ordinary item – – – –
Prior year adjustments – – – –
Equity capital 4.75 4.75 4.75 4.75
Equity dividend rate – – – –
Agg.of non-prom. shares (Lacs) 213.14 212.97 212.46 208.23
Agg.of non promotoHolding (%) 44.87 44.84 44.73 43.84
OPM (%) 10.02 6.84 7.96 5.10
Ratio Analysis
Ratio analysis means the relationship between two numbers. We can use ratio analysis to try to tell us whether the business
- is profitable
- has enough money to pay its bills
- could be paying its employees higher wages
- is paying its share of tax
- is using its assets efficiently
- has a gearing problem
- is a candidate for being bought by another company or investor
Recommendation
- Garments industry should be modernized, that means garments sectors have to apply all modern technology.
- Owners have to take security measure for any kind of accident.
- Raw material should be produced locally.
- All stakeholders should aware about their responsibility and help the industry to be responsible for the society.
- Worker should be paid adequate and logical wages.
- Garments worker should be trained about the security system for any accident and what should they do on time.
- Politician and others should take immediate steps to stop civil war. Its impact will be various.
- Government should more careful for infrastructure facilities and its maintenance.
- As the demand of garments will never be decreased so government should be more aware about making the policy especially for garments sector.
- Port administration system should be effective and efficient and technology based.
- Tax policy should be favorable for the garments and other export oriented industry.
- Government should take steps to monitor overall situation all time. Because export oriented business more sensitive.
- All stakeholders should aware about their responsibility and help the industry to be responsible for the society.
- Owners have to take security measure for any kind of accident.
- Port administration system should be effective and efficient and technology based.
- Tax policy should be favorable for the garments and other export oriented industry.
- Government should take steps to monitor overall situation all time. Because export oriented business more sensitive.
- Worker should be paid adequate and logical wages.
- Garments worker should be trained about the security system for any accident and what should they do on time.
- Raw material should be produced locally.
Conclusion
Now in the age of globalization dynamic demand, challenge and competition has been rapidly increased in RMG sector. Any organization now can enter to any world market easily and legally. As results organizations have to prove themselves by enlighten their product quality and services providing structure. With this if government can help or promote directly or indirectly to that industry, it can be able to contribute their achievements with country economy. Garments industry of Bangladesh functioning in the situation significantly they need government diplomatic strategy. Already Bangladesh has been able to prove themselves about their ability in the world RMG market as obtaining the rank at 7th. For globalization facility Bangladesh now have the diplomatic opportunity to go ahead form current point. Bangladesh needs some improvement to hold their position near top in global RMG economy by: producing raw materials from country, up-grading production system, installing up-grade machineries, accumulating skilled work force, arranging enrich capital and other helping hands. Above all, the products produced by garments industry must have high-satisfactory quality thus can attract and uphold customer’s eagerness to purchase / use these products. Titanic is a RMG industry the part of country RMG sector. So, it also should focus on above discussed elements and mainly on the quality of product produced.
Now we can say that to make economy strong than collaboration of private and public can play a good & effective role to the economy.