The residual sum of squares (RSS), also known as the sum of squared residuals (SSR) or the sum of a squared estimate of errors (SSE), is a statistical approach for determining how much variation in a data set is not explained by the regression model. It’s a metric for the difference between the data and an estimating model like linear regression. Linear regression is a statistical method for determining the strength of a connection between a dependent variable and one or more independent or explanatory variables.
A low RSS implies a good match between the model and the data. It’s utilized in parameter and model selection as optimality criteria. Instead, it calculates the error term or variance in the residuals. Total sum of squares = explained sum of squares + residual sum of squares is a general formula. See Partitioning in the General OLS Model for proof in the multivariate ordinary least squares (OLS) case. Investors and portfolio managers employ statistical models to track the price of an investment and forecast future changes.
One of the most essential outcomes in regression analysis is the sum of squares. The objective of regression analysis is to see how well a data series can be fitted to a function that can explain how the data series was created. Financial experts utilize the RSS to test the validity of their econometric models. Because linear regression models are frequently employed in both theoretical and practical finance, understanding the sum of squares is crucial.
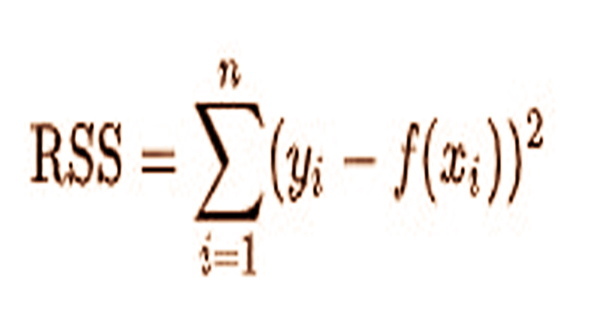
After the model has been run, the residual sum of squares (RSS) reflects the amount of error that remains between the regression function and the data set. RSS is provided by in a model with a single explained variable:
where:
yi = the ith value of the variable to be predicted
f(xi) = predicted value of yi
n = upper limit of summation
The generic regression model has n observations and k explanators, the first of which is a constant unit vector with the regression intercept as the coefficient, is
y = Xβ + e
where y is an n × 1 vector of dependent variable observations, each column of the n × k matrix X is a vector of observations on one of the k explanators, β is a k × 1 vector of true coefficients, and e is an n× 1 vector of the true underlying errors. The difference in standard deviations of actual values against projected values as represented by points in a regression analysis is referred to as the residual standard error (RSE). It’s a goodness-of-fit metric for determining how well a group of data points matches the real model.
A deviation of the values of a dependent variable from the sample mean of the dependent variable is called the total sum of squares. The total sum of squares, in essence, estimates the entire variance in a sample. As financial markets have grown more statistically driven, many investors are turning to advanced statistical approaches to help them make better judgments. The regression sum of squares is a measure of how effectively a regression model fits the data being modeled. A larger regression sum of squares means the model isn’t fitting the data effectively.
The use of statistical characteristics to drive modern investing strategies is further necessitated by big data, machine learning, and artificial intelligence applications. The residual sum of squares is a method of calculating the variance in modeling mistakes. In other words, it shows how the model cannot explain the variance in the dependant variable in a regression model. Investors and portfolio managers employ statistical models to track the price of an investment and forecast future changes.
The research, known as regression analysis, may entail examining the link between price fluctuations of a commodity and the stocks of firms that produce the product. A smaller residual sum of squares suggests that the regression model can better describe the data, whereas a greater residual sum of squares shows that the model can not adequately explain the data. Any model may have discrepancies between anticipated and actual values. The residual sum of squares reflects the variances or errors that are not explained by the regression analysis, even if they are explained by the regression analysis.
Any model may have discrepancies between anticipated and actual values. The RSS indicates the variances or mistakes that are not explained by the regression analysis, even if they are explained by the regression analysis. In most cases, however, a smaller or lower value for the residual sum of squares is preferable in any model since it indicates that the data set is less variable. In other words, the regression model’s ability to describe the data improves as the sum of squared residuals decreases.
Information Sources: