4.1 Budget analysis on financial statement
A Budget is a plan that outlines an organization’s financial and operational goals. So a budget may be thought of as an action plan; planning a budget helps a business allocate resources, evaluate performance, and formulate plans. While planning a budget can occur at any time, for many businesses, planning a budget is an annual task, where the past year’s budget is reviewed and budget projections are made for the next three or even five years. The basic process of planning a budget involves listing the business’s fixed and variable costs on a monthly basis and then deciding on an allocation of funds to reflect the business’s goals. Every financial organization has financial projection or business plan for the fiscal year. The City Bank also formulated a business plan for the year 2008.
Table: 02 Interest Incomes
| Interest Income | 2006 | 2007 | 2008 | Budget 2008 | Bud Grow | Achieved |
| Loans (General)/ Musharaka | 7894629 | 4280786 | 2953119 | -31.014561 | ||
| Loans against Imported/Murabha | 65199468 | 90847158 | 31196453 | –65.660508 | ||
| Loans against trust receipts | 428359970 | 434098326 | 531905006 | 22.5309968 | ||
| Packing credit | 35347191 | 34661086 | 17091792 | -50.688816 | ||
| Interest on EDF | 1158620 | 154465 | ||||
| House building loan | 45004246 | 55921839 | 33694650 | -39.746885 | ||
| Industrial credit | 801612877 | 1194078099 | 1517222761 | 27.0622719 | ||
| Transport loan | 35323309 | 34625773 | 65841013 | 90.1503051 | ||
| Lease finance/Izara | 24349133 | 34354995 | 28942397 | -15.754908 | ||
| Demand loan | 72482084 | 121300149 | 202085213 | 66.5993114 | ||
| Payment against documents | 217825218 | 92550629 | 54347021 | -41.278604 | ||
| cash credit/Bai-Muajjal | 892130104 | 860059080 | 820188537 | -4.6357912 | ||
| Hire purchase shirkatul melk | 1371806 | 35023005 | 47863604 | 36.6633274 | ||
| Fully and partly secured overdraft | 275362698 | 299696442 | 359159125 | 19.8409706 | ||
| Consumer credit Scheme | 6827980 | 7372803 | 5620237 | -23.770688 | ||
| Interest on SME | 36054147 | 84625415 | 83779832 | -0.9992069 | ||
| Staff loan | 24096045 | 33492273 | 46037035 | 37.4556902 | ||
| Documentary bills purchased | 454471022 | 312475397 | 253318311 | -18.931758 | ||
| Interest income from credit card | 40629994 | 38017789 | 84082652 | 121.166602 | ||
| Interest on cash incentive | 13490968 | 15410109 | 4679112 | -69.636088 | ||
| Other loans and advances/Invest. | 3722477 | 7363879 | 73122128 | 892.983834 | ||
| Total interest/profit on loans& ad. | ||||||
| Interest/profit on b/l With other banks | 78670768 | 280840887 | 368624725 | 31.2574992 | ||
| Interest on call loans | 188656571 | 83146162 | 30244151 | -63.625319 | ||
| Interest received from foreign banks | 22027994 | 29028631 | 7217035 | -75.138218 | ||
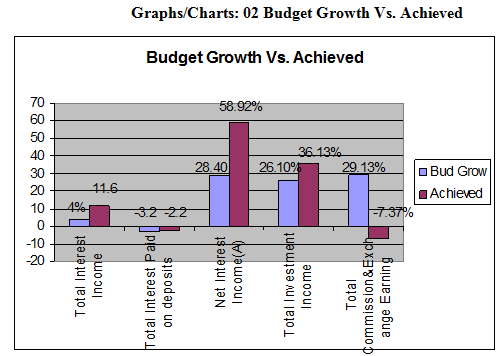
| Total Interest Income | 3772069319 | 4183270712 | 4669370374 | 4350570000 | 3.999 | 11.62 |
The City Bank Ltd. Projected 4% interest earnings on their loans & advances over the actual earnings on 2007. But due to some good management of credit department they achieved 11.62% in the year 2008.
We see here in profit & loss a/c. interest income achieved well over what is projected/expected due to less income growth in Interest received from foreign banks, Loans against Imported/Murabha, Packing credit, House building loan, Lease finance/Izara, Payment against documents, cash credit/Bai-Muajjal, Consumer credit Scheme, Interest on SME, Documentary bills purchased Interest on cash incentive, Interest on call loans, Loans (General)/ Musharaka.
Though the city bank ltd. Have earned more interest on loans & advances than that of their projection, but if they want to increase their growth they have to focus on earnings from, Interest received from foreign banks, Loans against Imported/Murabha, Packing credit, House building loan, Lease finance/Izara, Payment against documents, cash credit/Bai-Muajjal, Consumer credit Scheme, Interest on SME, Documentary bills purchased Interest on cash incentive, Interest on call loans, Loans (General)/ Musharaka.
Table: 03 Interest/profit paid on deposits
| Interest/profit paid on deposits | 2006 | 2007 | 2008 | Budget 2008 | Bud Grow | Achieved |
| Savings bank | 262454676 | 295575493 | 365353584 | 23.607536 | ||
| Mudaraba savings deposits | 22298489 | 34536648 | 5603223 | -83.776008 | ||
| Short term deposits | 88137461 | 99248148 | 220725861 | 122.397965 | ||
| Mudaraba short notice deposits | 3564819 | 5695138 | 2096300 | -63.19141 | ||
| Fixed deposits | 1600798664 | 2166124348 | 1733597747 | -19.967764 | ||
| Mudaraba Term Deposits | 24928695 | 37121430 | 51017214 | 37.4333209 | ||
| Deposits under scheme | 563892875 | 570924660 | 601980070 | 5.43949354 | ||
| Mudaraba monthly benefit scheme | 38950 | 138700 | 182400 | 31.5068493 | ||
| Repurchase agreement | 11838351 | 97462844 | 723.280573 | |||
| Others | 576971 | 2739757 | 1360629 | -50.337603 | ||
| Interest Paid to local Bank | 580185 | 11419982 | 68220220 | 497.375898 | ||
| Interest Paid to Bangladesh Bank | 15285278 | |||||
| Total Interest Paid on deposits | 2567271785 | 3235362655 | 3162885370 | 3133250000 | -3.16 | -2.24 |
On the other hand the expected interest expenses to reduce by 3.16%, but they afford to less by 2.24%. It may cause of heavy inflation during the year 2008. But as we know inflation is a systematic risk for any financial institution. So, to avoid these they have to more professionalism in making their decisions.
As we see the city bank ltd. wanted to reduce their cost on interest/profit paid on deposits by 3.16%. But they are enabled to make it at 2.24%, because of more cost on Savings bank deposits, Short term deposits, Interest Paid to local Bank, Mudaraba monthly benefit scheme, Repurchase agreement, Mudaraba Term Deposits, Deposits under scheme
In fact the city bank ltd. Had more deposit & scheme comparing to the year of 2007. In 2007 total deposit was 40539.63 but in 2008 it increases largely and it was 45034.33. This is the main reason for not achieving the projected rate.
Table: 04 Deposits for the year of 2007 & 2008
Sl. No. | Types of Deposit | 2008 | 2007 | ||
Amount | Share(%) | Amount | Share(%) | ||
1 | Current & Others | 7,167 | 15.91% | 7625.59 | 18.81% |
2 | Savings | 8,770 | 19.47% | 7761.12 | 19.14% |
3 | Short Term | 4300.17 | 9.55% | 3229.63 | 7.97% |
4 | Fixed Deposit | 19152.20 | 42.53% | 16308.43 | 40.23% |
5 | Scheme | 5645.11 | 12.54% | 5614.86 | 13.85% |
Total Deposit | 45034.33 | 100.00% | 40539.63 | 100% | |
Graphs/Charts: 01 various deposits
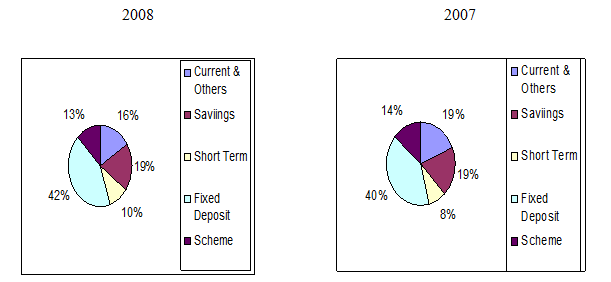
Table: 05 Net Interest Incomes
Here the actual net interest of the bank and budgeted growth have compared,
2006 | 2007 | 2008 | Budget 2008 | Bud Grow | Achieved | |
| Net Interest Income(A) | 1204797534 | 947908057 | 1506485004 | 1217320000 | 28.4 | 58.93 |
So, the net interest earnings of the city bank ltd. settled by increasing 58.93% what was projected at 28.43%, it happened due to large earnings on loans & advances in the year of 2008.
The city bank ltd. achieved above double of net interest income what is projected for the year 2008.This is because they had more income on loans & advances in the year of 2008 comparing to the year 2007. So they are well over what is expected in their budget planning. As they earned a large amount from interest earning their net interest earning also increases. So this position should retain in future.
Table: 06 Investment Incomes
Here the actual Investment of the bank and budgeted growth have compared,
| Investment Income | 2006 | 2007 | 2008 | Budget 2008 | Bud Grow | Achieved |
| Interest on treasury bills | 384614003 | 791255111 | 907922669 | 14.7446198 | ||
| Interest on debentures | 33316000 | 59863055 | 4293586 | -92.827653 | ||
| Dividend on share | 13518402 | 9152956 | 83873488 | 816.354105 | ||
| Gain on Government securities | 129163 | 124766936 | 96496.499 | |||
| Gain on revaluation of HFT securities | 28805365 | |||||
| Gain on sale of shares and debentures | 22005717 | |||||
| Total Investment Income | 431448405 | 860400285 | 1171667761 | 1085000000 | 26.1 | 36.18 |
In the projection for the year of 2008 the city bank ltd. Assumed 26.10% growth over 2007, but they achieved 36.18% on Investment Income.
The city bank ltd. Achieved higher income on their investment. Increased income of Interest on treasury bills, Dividend on share, Gain on Government securities contributed much to achieve this success.
There income from investment is well over their expectation and they have to retain this position.
Table: 07 Commission & Exch. Earning
Here the actual Commission & Exch. Earning of the bank and budgeted growth have compared,
| Commission & Exch. Earning | 2006 | 2007 | 2008 | Budget 2008 | Bud Grow | Achieved |
| Commission on L/Cs | 152536272 | 104106971 | 112253458 | 7.82511192 | ||
| Commission on L/Gs | 35690152 | 26321987 | 41451928 | 57.4802389 | ||
| Commission on export bills | 28018181 | 28625585 | 23771831 | -16.955999 | ||
| Commission on bills purchased | 6542335 | 5701070 | 3218384 | -43.54772 | ||
| Commission on accepted bills | 72920230 | 56918980 | 50327156 | -11.581065 | ||
| Commission on OBC, IBC | 8733732 | 6149637 | 5620698 | -8.6011418 | ||
| Commission on PO,DD,TT,TC | 37341784 | 35881317 | 31215787 | -13.002672 | ||
| Other Commission | 6434801 | 3936410 | 7806177 | 98.3070107 | ||
| Exchange Gain | 408514219 | 264604487 | 217355686 | -17.856387 | ||
| Total Commission Exchange Earning | 756731706 | 532246444 | 493021105 | 687314021 | 29.13 | (7.37) |
In the projection for the year of 2008 the city bank ltd. Assumed 29.13% growth over 2007, but they couldn’t achieve what they expected rather they earn 7.37% less comparing to 2007.Total commission & exchange earning is below their expectation. There assumed that they will be able to earn 29.13% more than the year 2007.
But they earned 7.37% less than the year 2007.They earned 16.96% less on Commission on export bills, 43.55% less on Commission on bills purchased, 11.58% less on Commission on accepted bills, 8.60% less on Commission on OBC, IBC, 13% less on Commission on PO, DD, TT, TC and 17.86% less on Exchange Gain which ultimately largely contributed to this.
They have to focus on to income from Exchange Gain, Commission on export bills, Commission on bills purchased, and Commission on accepted bills, Commission on OBC, IBC, and Commission on PO, DD, TT, and TC.
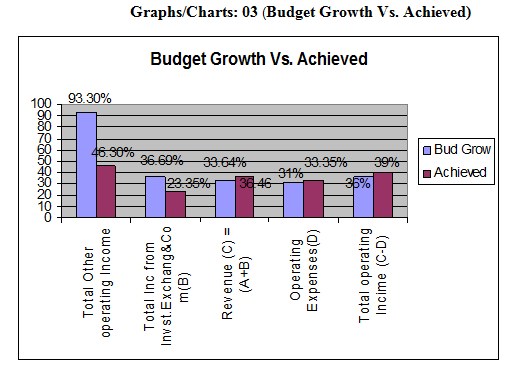
Table: 08 Other Operating Incomes
Here the actual Other Operating Income of the bank and budgeted growth have compared,
| Other Operating Income | 2006 | 2007 | 2008 | Budget 2008 | Bud Grow | Achieved |
| Rental Income | 5604770 | 4315737 | 5712664 | 32.3682143 | ||
| Postage/ Telex/Fax/ SWIFT | 40177056 | 32127062 | 26235088 | -18.339598 | ||
| Incidental charges | 37004368 | 29294060 | 30348758 | 3.60038178 | ||
| Service and other charges | 54888538 | 61762456 | 78676766 | 27.3860709 | ||
| Profit from sale of fixed assets | 2245951 | 1045899 | 2564313 | 145.17788 | ||
| Gain from sale of Treasury | 129163 | |||||
| Legal Charges recoveries | 446828 | 962223 | 2102852 | 118.541024 | ||
| Credit card income | 43484112 | 41457321 | 95046727 | 129.264035 | ||
| Rebate received from foreign banks | 8138736 | 6702798 | 7602445 | 13.421962 | ||
| Underwriting commission | 13400 | 78671 | 413890 | 426.102376 | ||
| Miscellaneous earnings | 65172253 | 53901707 | 90389564 | 67.6933237 | ||
| Total Other operating Income | 257176012 | 231777097 | 339093067 | 448036305 | 93.3 | 46.3 |
Again, in the projection for the year of 2008 the city bank ltd. Assumed 93.30% growth on other Operating Income over 2007, but they achieved only 46.30% which is about half of their expectation.
Total operating income growth was estimated at 93.30% but actually they achieved only 46.30%. Here 2 things are mentionable that in 2007 Gain from sale of Treasury was 129163 but in 2008 it was nil & it was expected that other operating income with Postage/ Telex/Fax/ SWIFT will rise but it even lower than 2007. So these things contributed much on that type of situation.
So they have to focus more on Gain from sale of Treasury and earning from Postage/ Telex/Fax/ SWIFT etc.
Table: 09 Totals Income from Investment Exchange & Commissions
Here the actual revenue, Operating expenses, and total operating income of the bank and budgeted growth have compared,
2006 | 2007 | 2008 | Budget 2008 | Bud Grow | Achieved | |
| Total Inc from Invst.Exchang&Com(B) | 1445356123 | 1624423826 | 2003781933 | 2220350326 | 36.69 | 23.35 |
| Revenue (C) = (A+B) | 2650153657 | 2572331883 | 3510266937 | 3437670326 | 33.64 | 36.46 |
| Operating Expenses(D) | 1155456768 | 1316315576 | 1755346344 | 1724096949 | 30.98 | 33.35 |
| Total operating Income (C-D) | 1494696889 | 1256016307 | 1754920593 | 1713573377 | 36.43 | 39.72 |
Here we see in the projection for the year of 2008 the city bank ltd. Assumed 36.69% growth on Total Inc from Investment, Exchange & Commission earning over 2007, but they achieved only 23.35% which is not up to their expectation.
But they achieved 36.46% growth revenue over 2007, which was expecting to grow by 33.64%. So overall they have success over revenue earning.
On the other hand they expected that their operating expenses will not go over 30.98%, but actually they had to cost 33.35%. Which ultimately effect on the total operating income. Though they have achieved well over their expectation on total operating income. Here the total operating income expected to have 36.43% growth over 2007, but they achieved 39.72%.
They have to focus more on other operating income & Commission & Exch. Earning.
Though they have achieved tk. 379358107 more on Total Inc from Investment Exchange & Commissions comparing to 2007, but they have to focus more on Total Income from Investment Exchange & Commission as they expected more than that growth rate.
In this regard they have to choose right investment decisions and at the same time they should accept those projects to invest which are quite profitable.
Here, we see total budgeted interest income was estimated at 4%, but they achieved 11.60%. That means they achieved more growth than their projected interest income. But they haven’t achieved actually what they expected; because of in 2008 they successfully collected more deposit than the year 2007.
That is why they can’t able to achieve their projection. But it is a good sign in the sense of deposit collection. On the other hand their net interest income and total investment income achieved quite successfully.
But they have negative growth on commission and exchange earning.
Here, we see their other operating income growth was 46.30%, in fact they couldn’t achieve the expected growth to a large extent.
The bank also far behind from their budgeted growth, though they achieved 23.35% growth over 2007. On the other hand they achieved their expected growth over revenue as well as from total operating income.
But they were expecting during the year their operating expenses will no more than 31%, but actually they have to pay 33.35%. The reason behind that they were focusing more on expansion of their banking service. Moreover high inflation rate during the year 2008 may another reason behind that.
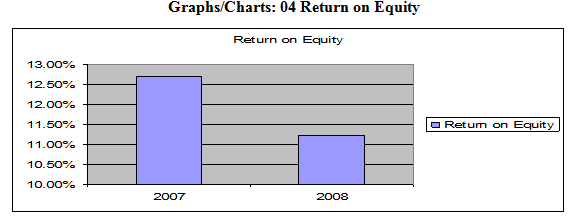
4.2 Operating Performance of the city bank ltd.
Table: 10 Operating Performance Ratio
| Operating Performance Ratio | 2004 | 2005 | 2006 | 2007 | 2008 | Growth over 2007 |
| Return on Equity | 34.34% | 32.05% | 10.69% | 12.71% | 11.23% | -1.48% |
| Return on Assets | 1.52% | 1.75% | 0.58% | 0.71% | 0.75% | 0.04% |
| Yield on Loans and Advances | 13.23% | 12.67% | 13.30% | 13.15% | 13.93% | 0.78% |
Return on equity for the year 2007 was 12.71%, on the other hand in 2008 it was 11.23%. This means Return on Equity (ROE) fall less by 1.48%, because of higher closing balance for the year 2008.
Return on Assets: PAT/Avg. Assets {(Opening + Closing b/s)/2}
(2008) =398110184/ {(48755403018+57114576058)/2}
=0.75%
Return on Assets: PAT/Avg. Assets {(Opening + Closing b/s)/2}
(2007) = 343463026/ {(47445751884+ 48755403018)/2}
=0.71%
Return on Assets (ROA) in 2007 was 0.71% & in 2008 it was0.75%. This means Return on Assets (ROA) increased by 0.04%, Profit after tax in 2007 is lower than 2008.
Yield on Loan & Advances Interest Income from loans/Avg.loans & Adv.
(2008) =4263284463/ {(26788466138+34420944980)/2}
=13.93%
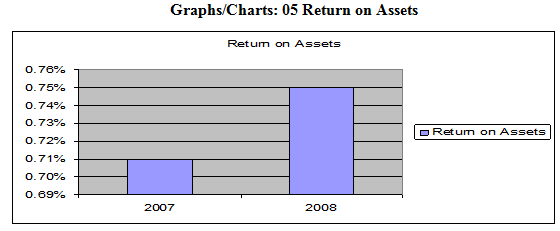
Table: 11 Provision for loans
| RATE OF PROVISION | ||||||||
Particulars | Short Term | Consumer Financing | Small Enterprise | All other | |||||
Other than | HF | LP | |||||||
UC | Standard | 5% | 5% | 2% | 2% | 2% | 1% | ||
SMA | 0% | 5% | 5% | 5% | 5% | 5% | |||
Classified | SS | 5% | 20% | 20% | 20% | 20% | 20% | ||
DF | 5% | 50% | 50% | 50% | 50% | 50% | |||
B/L | 100% | 100% | 100% | 100% | 100% | 100% | |||
5.1 Learning Point:
In the internship period at the city bank Ltd. Head office-Finance division, I have learned lots of things. These are listed below:
Finding revenue expenditure for each division
Writing cash debit voucher.
Writing credit Voucher.
Writing pay-slip
Using the Finacale bank Software
Checking balance in Finacale bank Software.
Showing Statement in a Finacale bank Software.
Writing advice.
Analytical ability improves as did this report
Learn more about the cost center and business center.
Learnt more how to response on a corporate environment.
Banking activities needs more accuracy and professionalism.
Routine work/ Punctuality is must for being successful in this banking industry.
Learnt more about the financial projection and financial analysis of a financial institution like bank.
The organization hierarchy.
Duties and responsibilities of employees of finance division.
Working hour of the organization.
Use of IBC and OBD.
The use of software.
Communication and coordination between different division.
5.2 Findings:
01. We see in the profit & loss a/c. growth on interest income achieved what was projected/expected. But there are less income growth in Interest received from foreign banks, Loans against Imported/Murabha, Packing credit, House building loan, Lease finance/Izara, Payment against documents, cash credit/Bai-Muajjal, Consumer credit Scheme, Interest on SME, Documentary bills purchased Interest on cash incentive, Interest on call loans, Loans (General)/ Musharaka which reduced the more growth.
02. As we see the city bank ltd. wanted to reduce their cost on interest/profit paid on deposits by 3.16%. But they are enabled to make it at 2.24%, because of more cost on Savings bank deposits, Short term deposits, Interest Paid to local Bank, Mudaraba monthly benefit scheme, Repurchase agreement, Mudaraba Term Deposits, Deposits under scheme.
In fact the city bank ltd. collected more deposit & scheme comparing to the year of 2007. In 2007 total deposit was 40539.63 but in 2008 it increases largely and it was 45034.33. This is a reason not for achieving the projected/expected rate.
03. The city bank ltd. achieved above double of net interest income what is projected for the year 2008.This is because, they had more income on loans & advances in the year of 2008 comparing to the year 2007. So they are well over what is expected in their budget planning.
04. In the projection for the year of 2008 the city bank ltd. Assumed 26.10% growth over 2007, but they achieved 36.18% on Investment Income. The city bank ltd. Achieved higher income on their investment. Increased income of Interest on treasury bills, Dividend on share, Gain on Government securities contributed much to achieve this success.
05. In the projection for the year of 2008 the city bank ltd. Assumed 29.13% growth on Total commission & exchange earning over 2007, but they couldn’t achieve what they expected, rather they earn 7.37% less comparing to 2007.Total commission & exchange earning is below their expectation..They earned 16.96% less on Commission on export bills, 43.55% less on Commission on bills purchased, 11.58% less on Commission on accepted bills, 8.60% less on Commission on OBC, IBC, 13% less on Commission on PO, DD, TT, TC and 17.86% less on Exchange Gain which ultimately largely contributed to this.
06. Again, in the projection for the year of 2008 the city bank ltd. Assumed 93.30% growth on other Operating Income over 2007, but they achieved only 46.30% which is about half below of their expectation. Total operating income growth was estimated at 93.30% but actually they achieved only 46.30%. Here 2 things are mentionable that in 2007 Gain from sale of Treasury was 129163 but in 2008 it was nil & it was expected that other operating income with Postage/ Telex/Fax/ SWIFT will rise but it even lower than 2007. So these things contributed much on that type of situation.
07. We see in the projection for the year of 2008 the city bank ltd. Assumed 36.69% growth on Total Inc from Investment, Exchange & Commission earning over 2007, but they achieved only 23.35% which is not up to their expectation.
But they achieved 36.46% growth revenue over 2007, which was expecting to grow by 33.64%. So overall they have success over the expected growth on revenue earning.
On the other hand they expected that their operating expenses will not go over 30.98%, but actually they had to cost 33.35%. Which ultimately effect on the total operating income. Though they achieved well over their expectation on total operating income. Here the total operating income expected to have 36.43% growth over 2007, but they achieved 39.72%.
6.1 Conclusion:
In Bangladesh banking sector has a significant role to our economy. As the city bank is one of the largest participants in this industry, it is contributing to our national economy.
The services encompass wide diversified areas of trade, commerce & industry which tailored to the specific needs of the customers and are distinguished by an exceptional level of prompt and personal attention. Over the years the Bank has expanded the spectrums of Its Services. The extensive and ever growing domestic network provides and carries various products and services to the doorsteps of millions.
Almost all the divisions are working to hold this position an to go ahead, especially finance division is providing more efforts. Some highly qualified and professional are members of the organization who have a vast experience in this industry are performing their duties.
But they have to dedicate more in their working area. During the time of analyzing this report on Budget & Financial Statement Analysis of the city bank ltd. I faced various problems as they didn’t make a proper budget during the year 2007.
Apart from that the city bank ltd. Performance was better than many other banks. But during the year 2008 they earned large amount revenue. The financial performance of CBL is better any other banks in the in this industry. So this position should be retained.
6.2 Recommendations:
01. Though the city bank ltd. Have earned more interest on loans & advances than that of their projection, but if they want to increase their growth they have to focus on earnings Interest received from foreign banks, Loans against Imported/Murabha, Packing credit, House building loan, Lease finance/Izara, Payment against documents, cash credit/Bai-Muajjal, Consumer credit Scheme, Interest on SME, Documentary bills purchased Interest on cash incentive, Interest on call loans, Loans (General)/ Musharaka.
02. They should focus on income from Exchange Gain, Commission on export bills, Commission on bills purchased, and Commission on accepted bills, Commission on OBC, IBC, and Commission on PO, DD, TT, and TC.
03. They should focus more on Gain from sale of Treasury and earning from Postage/ Telex/Fax/ SWIFT etc.
04. They have to focus more on other operating income & Commission & Exch. Earning.
Though they have achieved tk. 379358107 more on Total Inc from Investment Exchange & Commissions comparing to 2007.
05. But they have to focus more on Total Income from Investment Exchange & Commission as they expected more than that growth rate. In this regard they have to choose right investment decisions and at the same time they should accept those projects to invest which are quite profitable.
Some More Parts-
Report on Budget & Financial Statement Analysis of the City Bank Limited (Part-1)
Report on Budget & Financial Statement Analysis of the City Bank Limited (Part-2)