The report aims at identifying the positive aspects as well as the shortcomings of the entire process of credit approval and the credit risk assessment system of Standard Chartered Bank along with a descriptive analysis of the level of satisfaction of the clients of regarding the services and solutions offered to them by the Local Corporate segment of the bank. Incorporating the survey results with the outcome of the thorough analysis of the credit approval and credit risk assessment process of the clients is a major focus.
It has been found that, the credit approval procedure of Standard Chartered Bank is divided into segments and disseminated to particular divisions with expertise in specialized fields to ensure that the whole process is flawless. Before providing the final approval, all the available information regarding clients‟ financials goes through extensive scrutiny. Prospecting and initiation, giving early business alert, obtaining CIB report and indicative offer letter, BCA preparation and approval, renewal, maintenance and monitoring of credit applications, preparation of operational sheet, BFL acceptance, security documentation, limit setup and facility drawdown are the stages of the credit approval process.
In order to conduct the survey, structured questionnaire were mailed to 40 clients. The aim was to identify the level of knowledge regarding the services, views regarding their quality and standard and clients‟ feedback and suggestion to improve the services and solutions. The survey was successfully completed with a very low non-responsive rate. The outcome illustrated the fact that the clients perceived the services as solution to be good and feel that
the products are reliable, accessible and in line with the quality that LC promises.
On the contrary, Clients also felt that the staffs are not prompt, polite and responsive and do not communicate with them on a regular basis. Another negative factor mentioned by the clients was the long waiting time which was referred to as expensive and the reason behind this was found from the subjective analysis. The thorough and elaborate process that helps the bank manage the risks, lengthens the waiting time. Despite all these shortcomings, the comprehensive research portrayed that the efficient process and the evaluation of analysis at different levels by different experts ensures thorough inquiry and flawless decision making.
Objectives of the Study:
The objectives of the report are:
- To bring together information regarding the entire process of credit approval.
- To achieve knowledge regarding the system of credit risk assessment.
- To identify and analyze the necessary information regarding the financial performance of the Group to incorporate it with the study.
- To investigate the level of satisfaction of the client base regarding the products offered to them by the Local Corporate Segment of Standard Chartered Bank, Bangladesh.
- To find out the Strengths, Weaknesses, Opportunities and Threats of the bank as well as the flaws or drawbacks regarding the services and solution offered and relate it will the survey outcome.
- To detect the positive aspects as well as the shortcomings of the credit approval and the credit risk assessment process and relate the survey results with the analysis.
- To identify methods to improve the quality and standard of the products offered to the customers.
Methodology:
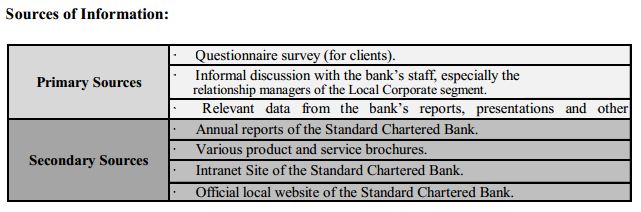
In order to accumulate necessary information and data both primary and secondary sources have been used. The primary sources provided information portraying the real scenario as to what are the factors that are considered while analyzing the information of the clients‟ creditworthiness, what are the aspects that are taken into consideration for conducting the process of credit approval and how the client base feels about the products that are offered to them by this segment. The data collected using secondary sources were also helpful since those provided support while comparing and analyzing the data collected form primary sources.
STANDARD CHARTERED BANK
Overview:
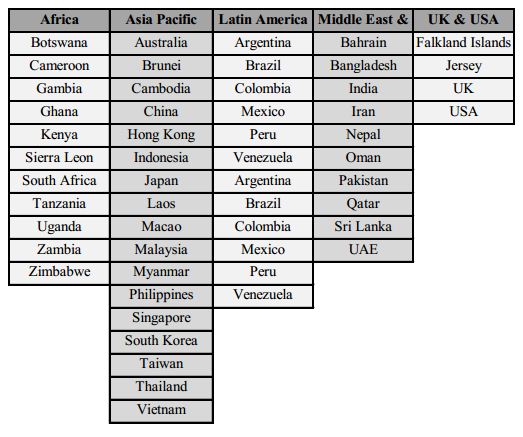
Concentrating on execution of planning with the aim of contributing towards the development of financial system as well as ensuring growth of revenue, Standard Chartered Bank (SCB) PLC has been maintaining its network of 1700 branches in over 70 countries, maintaining successful relationship with over 600 banks in 157 countries globally with 86865 hardworking professionals responsible for the management of an asset base worth over 599 billion. Focusing on Asia, Middle East and Africa, SCB has expertise in wide-ranging array of services and solutions functioning successfully in North Africa, Middle East and South Asian zone. It is Headquartered at Alderman buries Square in London and serves South Asia, South East Asia, Middle East, LTK, Europe and the USA.
The major strategically moves that this bank aspire to make through sticking to its values and vision includes the objective of ensuring growth in business in South Asia, Far East Asia and Middle East, catering to the requirements of clients all over the world through keeping the promises that it makes to them, provide certainty in terms of brand value built through serving relentlessly and successfully for over 150 years and contributing in the economic development via focusing on actions that directly impact the growth.
Today, The Standard Chartered Bank is successfully operating in the following regions of the world:
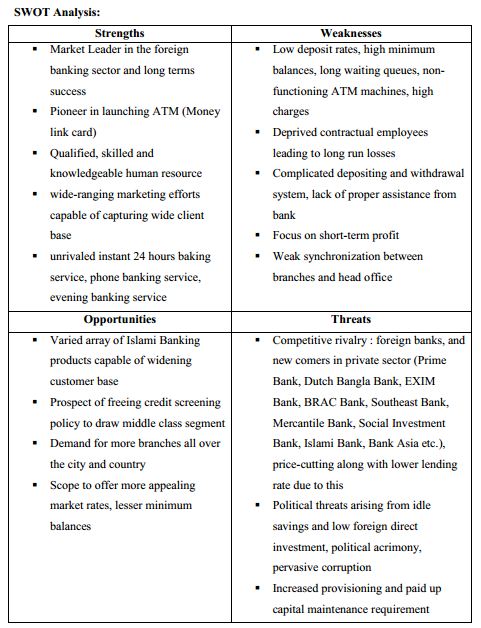
SWOT, FINANCIAL AND CORPORATE PORTFOLIO ANALYSIS
Financial Analysis:
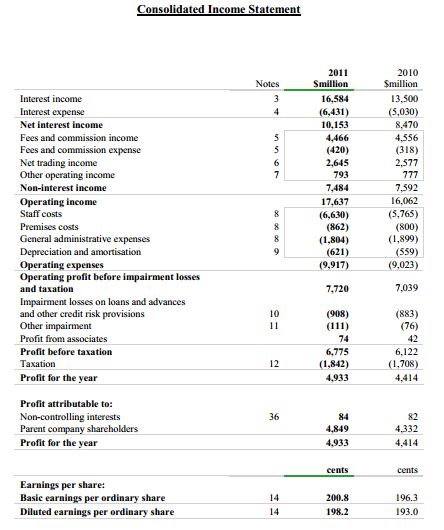
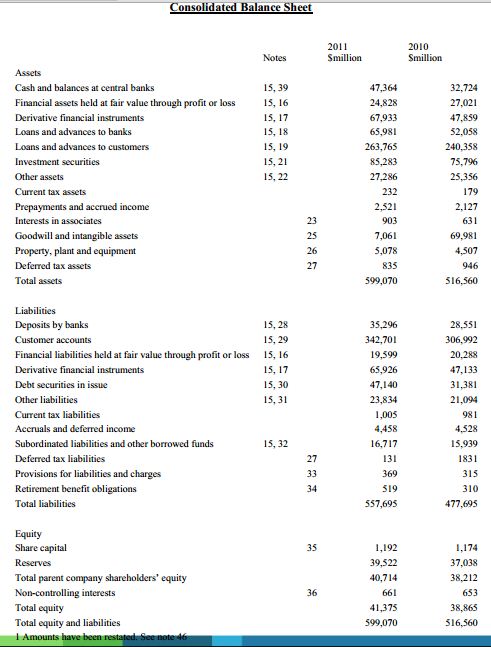
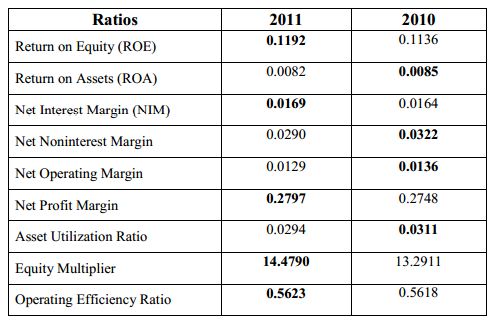
With the aim of evaluating the bank‟s performance, a concise analysis of the financial ratios was carried out. A brief evaluation of the bank‟s financial trends as well as projection of future performance could be comprehended from the data of the year 2010 and 2011 (Ref: Income Statement and Balance Sheet)
Return on Equity (ROE):
ROE = Net Income after Tax / Total Equity Capital
It could be figured out form the above data that the bank‟s ability to generate profit with the money shareholders invested increased in 2011 which is an indication that the board of directors or the managers were able to run the bank more effectively with the equity provided by the shareholders, thus the net benefit the shareholder had received in 2011 from investing their capital in the bank was higher in magnitude compared to that of 2010.
Return on Assets (ROA):
ROA = Net Income after Tax / Total Asset
ROA is a managerial efficiency indicator that shows how successfully the management has been converting the bank‟s assets into net earnings. It is evident that, the total assets of the bank had been utilized quite efficiently, however in the year 2010 the management were more efficient compared to that of 2011 since the trend of ROA has decreased from the year 2010 to the year 2011.
Net Interest Margin (NIM):
Net Interest Margin = (Interest Income – Interest Expense) / Total Asset
As it can be observed from the data set that, the management has been able to maximize the spread between the bank‟s interest revenues and cost by its control over the earning assets and the cheapest source of fund since the Net Interest Margin was relatively higher in the year 2011 compared to that in 2010.
Net Noninterest Margin:
Net Noninterest Margin = (Noninterest Income – Noninterest Expense) / Total Asset
The tables shows that the difference between the noninterest income generated by bank and the amount of interest paid out to the lenders was slightly lower in the year 2011 compared to that of 2010.
Net Operating Margin:
Net Operating Margin = (Total Operating Revenues -Total Operating Expenses) / Total Asset
The data show that the management and the staff had been able to keep the growth of revenue ahead of rising cost pretty well. However, we see that the trend of Net Operating Margin had decreased from the year 2010 to the year 2011. Since this represents a combined picture of the net interest margin and the net non-interest margin, it could be comprehended form the data set that the management had consistently been able to enhance both of their interest and non-interest income over its interest and non-interest expenses.
Net Profit Margin:
Net Profit Margin = Net Income after Tax / Total operating Revenue
The effectiveness of cost control and service pricing policies of Standard Chartered Bank has always been thriving. As per the table, this ratio had increased in the year 2011 which was an indication that the improved management of costs that results in increased percentage of operating revenue converted to net income.
Asset Utilization Ratio:
Asset Utilization Ratio = Total Operating Revenue / Total Assets
If we consider the last two years, it is evident that the portfolio management policies and the yield on assets had been quite close to consistent over the period. Nonetheless, the trend of the degree of asset utilization had been decreasing indicating that yield on the Bank‟s asset had been decreasing.
Equity Multiplier:
Equity Multiplier = Total Assets / Total Equity Capital
The bank had used more of its debts to finance the assets it owned. The total assets per dollar of stockholders’ equity had been increasing over the last two years as per the table. Since a higher equity multiplier indicates higher financial leverage, it is evident that the bank had been relying more on debt to finance its assets. As per the table, the equity multiplier has increased from 13.2911 times to 14.4790 times between the year 2010 and 2011.
Operating Efficiency Ratio:
Operating Efficiency Ratio =Total Operating Expenses / Total Operating Revenues
This ratio to measure expense control illustrates the negative financial performance of Standard Chartered Bank. This increasing trend during the last two year period shows that the operating expenses of the Bank had increased as a percentage of its operating revenue.
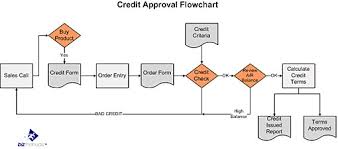
CREDIT APPROVAL PROCEDURE
The credit approval procedure of Standard Chartered Bank concentrates on the assessment criteria in pricing and measuring risk. This tough process is divided into segments and disseminated to particular divisions with expertise in specialized fields for proper scrutiny of the collected client information as per the pre-determined process of providing final approval to the loan applications received. (Ref: Chart 4.1-4.5)
1. Prospecting and Initiation: The corporate market which generates „Asset Customers‟ or the clients applying for credit facilities is generally comprised of Multinational corporate (MNC) or Network, Large local corporate (LLC) and Local corporate or Middle Market segments managed by the RMs involved in both front and back-office activities for marketing, maintaining credit relationship and monitoring accounts. Also, clients can approach to the bank for credit facility. The relationships are supported by CSU (Corporate Support Unit) of the bank.
2. Early Business Alert: A brief memo named „Early Business Alert‟ (including client details like background, financial highlights and needs, potential business and future plans and projections) is raised by the RM upon the detection of a prospective credit relationship which is reviewed by the head of credit and provides feedback.
3. CIB Report and Indicative Offer Letter: Upon successful initial meeting and RMs request, the Credit Operation Department collects report from Credit Information Bureau (CIB) of Bangladesh Bank portraying complete credit situation of the company (record regarding credit facilities taken from other banks, default details
etc.). Offer Letter‟ explaining necessary terms and conditions, facility structure, pricing etc. is sent to the company if the report is clean and if company submits the documents required for further process along with the letter duly signed to the RM.
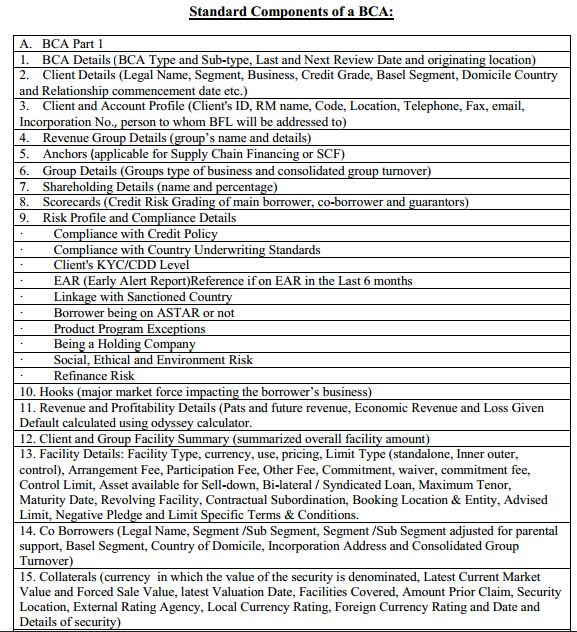
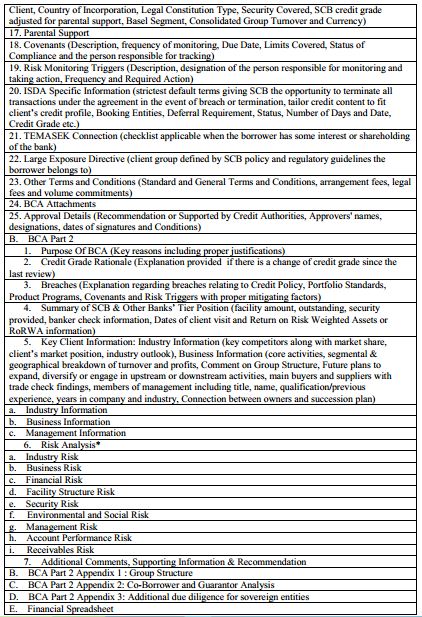
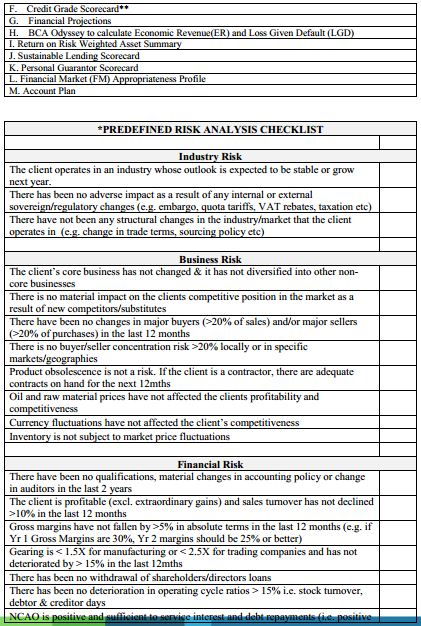
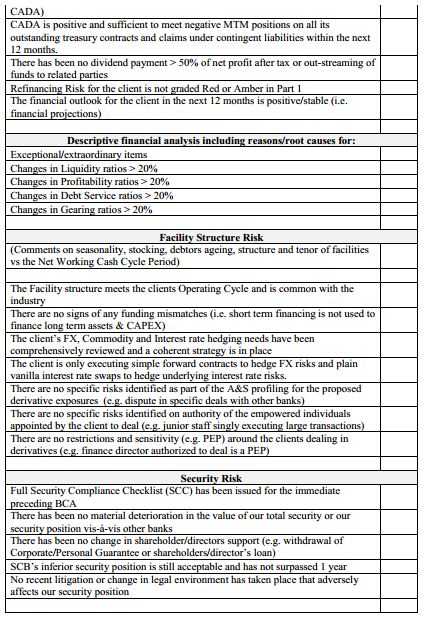
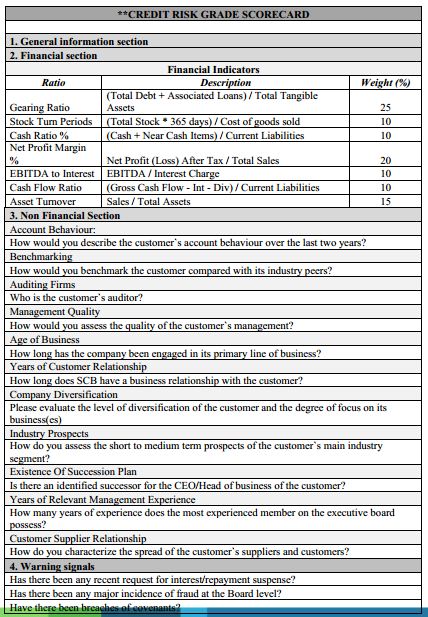
4. BCA Preparation and Approval: The financials and other necessary documents received from the client is forwarded to the credit analyst team who prepares a Business Credit Application (BCA) analyzing the financials and computing ratios required using the official software named „FAMAS‟, prepared and organized in a network based system „CreditMate‟ with the aim of generating necessary information regarding the financial solvency, debt service capacity, debt and capital protection, liability and asset management skills, cash cycle etc. illustrating the risks associated and potential profitability of the relationship. While preparing the BCA features like Proposal, Repayment Sources & Time Frame, Indicative Return, Account Relationship Strategy, Probability of Default, Refinance Feasibility/Other Ways Out, Risk Controls, Loss in Event of Default, Other Remarks and Overall Risk Assessment
are taken into account. Major Standard components of a BCA is discussed below:
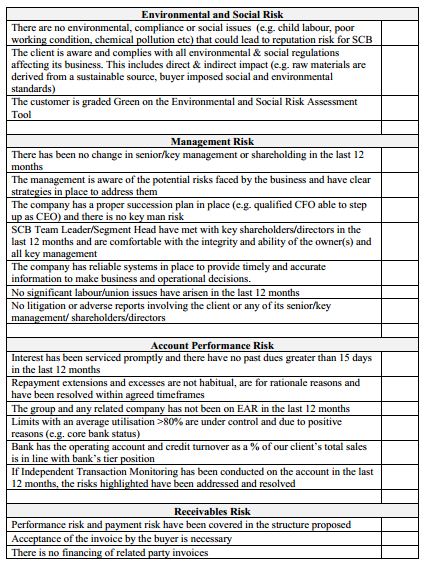
Renewal, Maintenance and Monitoring:
It is compulsory to review the relationship the new credit relationships annually (at least) for which, entire set of BCA is submitted to the credit chain and facilities are provided (reduced or enhanced with changes in conditions by RM) for the next term upon approval and clean CIB report. Earmark limits or temporary excess (subject to credit approval) may be provided to accommodate clients‟ needs in the maintenance stage. Supervision and scrutiny is done by RMs and ARMs on a regular basis along with detection and reporting of risk triggers, covenants, adverse market conditions, breaches to the credit as per the approved BCA are done in the monitoring phase. The software „CreditMate‟ is used for these processes.
5. Preparation of Operational Sheet: An Excel based account-planning tool called„Corporate Deal Analyzer‟ is used to model risk adjusted profitability and value added for the clients and an „Operational Sheet‟ is prepared mentioning detail regarding the credit facilities, limits, amount and type of security. Final evaluation is done by the senior credit analyst and approved by the head or credit (or by regional head of credit in Dubai of credit when the credit amount exceeds BDT 2 million)
6. BFL Acceptance: Banking Facility Letter (BFL) is prepared advising details of the facilities with all the terms and conditions by the Credit Documentation Unit (CDU) after approval of the BCA and provided to the client with related legal papers for acceptance and signoff.
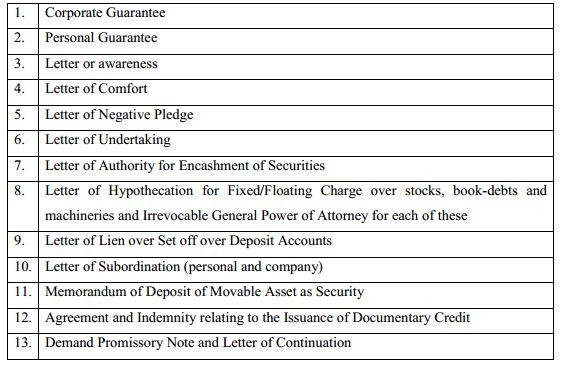
7. Security Documentation: Arrangements are made for the completion of necessary security documentation for completion of pari passu security sharing agreements, charge filling etc. Following is a list of major documents that are prepared:
8. Limit Setup: The credit admin and the Credit Risk Control (CRC) Department make all the limits available in the system upon the completion of all the required documents. Trade Port and eBBS (systems which includes account details supporting the functions of loan processing, trade, credit risk control and credit) use these limits as per the accepted BFL and the client can start facility drawdown.
9. Facility Drawdown: Clients has to open at least one account that is subject to Client Due Diligence (CDD) (Previously known as Know Your Customer or KYC and unrelated to credit approval). Depending on the approved facilities drawdown can happen i.e. overdraft limit can be used issuing cheques, raw materials or capital goods can be imported issuing L/Cs or payments can be made to suppliers availing revolving loans.
ANALYSIS OF DATA AND THEIR INTERPRETATION
A structured questionnaire containing both open-ended and close-ended questions (a combination of multiple choice questions, open-ended questions, rank order questions, statement checklists and rating questions) was prepared with suitable options. With the aim of measuring the satisfaction level of the clients, questions that would assist in identifying the level of knowledge regarding the services, views regarding their quality and standard and
clients‟ feedback and suggestion to improve the services and solutions were included in the questionnaire. In order to get the clients‟ list and get in touch with the clients I took help from my supervisor. The client group was selected using the simple random sampling method. The survey was done among 40 respondents. The questionnaires were mailed to the authorized persons (managers, directors of head of finance department who are about the products they are offered by the segment and are capable enough to judge their level of satisfaction regarding them along with providing feedbacks required) who deal with the bank on behalf of their respective companies. The non-response rate was very low (5.00%) and I was able to collect data from 38 respondents.
Analysis of data and their interpretation:
After the collection of data, those had been analyzed using Microsoft Excel and statistical software SPSS. At first, the qualitative data were separated from the quantitative ones and dependent and independent variables were also pointed out. Variables have been analyzed using statistical tools like: Frequencies, Correlation, Regression, One-sample t-test and independent t-test and have further been illustrated through scatter plots, histograms, charts, tables and graphical representations. Following are the list of variables and the results from the statistical analysis of the data with their explanations and interpretations:
List of Variables:
- Number of respondent
- Longevity of relationship of the clients with the bank
- Type of services
- The most used LC service by the client
- Current awareness status of the client about LC services 46
- Reliability factor of LC service and staff
- Responsiveness factor of LC service and staff
- Accessibility factor of LC service and staff
- Assurance factor of LC service and staff
- Empathy factor of LC staff
- Courteousness of LC staff
- Rates of LC services
- Overall rating of service quality and standard
- Most satisfactory cash management solution
- Most satisfactory trade finance solution
- Most satisfactory securities service solution
- Clients‟ complaints against LC services or staff
- Clients‟ tendency to complain to the RM regarding LC services
- Overall rating of the clients‟ satisfaction level
Interpretation of frequencies tables:
Data were arranged in ascending order of magnitude with their corresponding frequencies (the number of times a particular option has been responded) and were run in SPSS. The output together with its percent and cumulative percent are shown below tables. The first frequency table 6.1 relates to the relationship longevity of the clients with the bank. The frequency of the survey output is followed by histograms to illustrate the results further. 30% clients stated that they have a relationship with this segment for quite a long time, around 43% clients have a banking relationship with LC for more than 5 years and only 10% clients are dealing with the bank for less than a year which shows that the majority of respondents have worked with the segment for more than 5 years and therefore can be
regarded as to have a strong relationship with LC.
From the histogram 6.1 it is evident that, majority of the clients has been dealing with the segment for more than 5 years and therefore can be regarded as to have a strong relationship with LC since the mass of the distribution of data is concentrated on the right side and has relatively few low values.
The next frequency tables (6.2-6.4) relate to the questions about the clients‟ level of knowledge regarding the services:
Majority (around 54%) of the clients have a clear knowledge about services and solutions and accurately named them. Again, cash management is mostly popular among the majority of LC clients (availed by nearly 38%) followed by the trade finance solution of LC services (a close percentage result of 25%). Moreover, LC clients do not have much interest to know more about the services of the segment, other than those that their companies avail as result shows that 46% of the respondents claim that they are aware of the services of LC and they think it is as much as necessary. The histogram results (6.2-6.4) support these outcomes.
The next set of frequency tables (6.5-6.7) relate to the clients‟ views about the quality and standard of services offered by this segment. The reliability factor of LC services and staff has been accounted for by three questions:
The services and staff of LC can be regarded as reliable since majority of the respondents agreed that LC provides promised services (45%), can be depended upon (60%) and strongly agreed that it maintains records accurately (49%) Thus the third histogram (6.7) supports this outcome (data concentrated on the left side), whereas, the histograms for the first two statements (6.5, 6.6) show balanced distribution of data or opinions.
The responsiveness factor of LC services and staff has been accounted for by three questions (table 6.8-6.10):
The services and staff of LC cannot be regarded as satisfactorily responsive. 44% of the respondents have agreed that LC keeps them informed; but 39% respondents disagreed that LC provides prompt services and 41% of the clients took a neutral stand that LC readily responds to requests. The histograms (6.8-6.10) show balanced distribution of opinions.
The accessibility factor of LC services and staff again has been accounted for by three questions (table 6.11-6.13)
The services and staff of LC are accessible, but simultaneously clients also find the waiting time to be expensive since 64% of the respondents have strongly agreed that LC RMs can be easily accessed; 42% agreed that services can be accessed at convenient hours and branches and 35% of the clients disagreed that waiting time is not expensive. The histograms for the statements support the outcome (data concentrated on the left side for graph 6.11, 6.12 and on the right for graph 6.13).
The assurance factor of LC services and staff has been accounted for by two questions (table 6.14, 6.15):
LC staff can guarantee service assurance since 37% of the respondents agreed that LC employees have the knowledge to answer clients’ requests and 59% respondents strongly agreed that LC employees can keep company secrets safe. The histograms results for the two statements (6.14, 6.15) support the outcome (data concentrated on the left side).
The empathy factor of LC services and staff has been accounted for by two questions (6.16, 6.17):
LC staff shows empathy towards clients since 50% of the respondents strongly agreed that LC employees provide them individual attention and 41% respondents agreed that LC employees can understand their company needs. The histogram results (6.16, 6.17) support the outcome (data concentrated on the left side).
The courteousness factor of LC services and staff has been accounted for by only one question (6.18):
LC staff is courteous since 43% of the respondents agreed that LC employees are consistently polite. However, the histogram result (6.18) shows balanced distribution of data or opinion.
The rates of LC services have been accounted for by two questions (6.19, 6.20):
LC rates are somewhat in accordance with, but clients seem to be confused regarding the balance between quality and service charges quality (agreed by 34% of the respondents but disagreed by a close 33%). Majority (43%) of the clients feel that the rates are not reasonable. The histogram result for the first statement (6.19) shows balanced distribution of data and the second one (6.20) supports the outcome as well (data concentrated on the right
side).
The overall response regarding the quality and standard of LC services was accounted by one question (Ref: table 6.21):
52% respondents stated that the overall quality and standard of LC services is generally good. The histogram (6.21) illustrating this result supports the outcome (data concentrated on the right side). The next set of frequency tables (6.22-6.24) relate to the clients‟ satisfaction level regarding the services of LC.
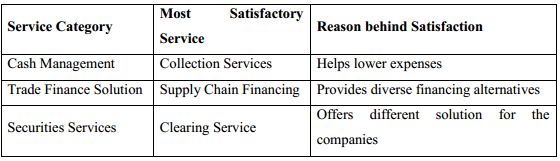
The first three questions under this section were given to find out which solution among the cash management, trade finance and securities services was mostly popular with the clients:
Collection services, trade finance services and clearing services topped their respective category with 37%, 31% and 51% of the votes respectively. The first histogram (6.22) support the outcome (data concentrated on the left side) and the other two (6.23, 6.24) shows balanced distribution of data.
The frequency tables (6.25-6.27) relating to clients‟ complaints and satisfaction level are discussed below:
33% of the respondents find the staff of LC is unsupportive and inefficient and although 37% of the respondents have complaints regarding the services and staff of LC, they do not share it with the respective relationship managers. 48% of the respondents are just moderately satisfied with the services. The first histogram result (6.25) supports the outcome (data concentrated on the left side). The other two (6.26, 6.27) shows balanced distribution of data.
Hypotheses:
Quantitative variables were further categorized into dependent and independent variables that are expected to have a relationship with any other variable. The independent variables have an impact on the dependent variable. With the aim of showing the relationship between each variable, hypotheses were used for conducting the Correlation and
Regression:
- Reliability Factor, Responsiveness Factor, Accessibility Factor, Assurance Factor, Empathy Factor, Courteousness Factor and Rates of LC services (independent variables) have statistically significant relationships with the type of complaints that clients tend to have against the services of LC (dependent variable).
- Reliability Factor, Responsiveness Factor, Accessibility Factor, Assurance Factor, Empathy Factor, Courteousness Factor and Rates of LC services, Overall rating of the quality and standard, and Overall rating of the clients‟ satisfaction level (independent variables) have statistically significant relationships with the relationship longevity of the clients with the segment of LC (dependent variable).
- Rates of LC services and Overall rating of the clients‟ satisfaction level (independent variables) have statistically significant relationships with the overall rating of the quality and standard of LC services (dependent variable).
- Rates of LC services (independent variable) have a statistically significant relationship with the overall rating of the clients‟ satisfaction level (dependent variable
- Overall rating of the clients‟ satisfaction level (independent variable) has a statistically significant relationship with the clients‟ choice of their mostly used LC services (dependent variable).
Analysis of the qualitative responses of the survey:
Clients had freedom to express their complaints against the services and it was found that majority of them were against the staff. Clients felt that the staff do not communicate enough with them, respond less to requests and sometimes ignore them; above all they prefer to provide services according to their own convenience.
When clients were asked whether they wanted to change anything regarding the services and solutions (add or remove), majority of them stated that they neither wanted additional services nor they wanted to remove any, which illustrates the fact that the satisfaction level is high. The gist of the clients‟ explanations was that the facilities offered were all-inclusive, suited the requirements of the clients and were speedy, sufficient, convenient, well-organized and user-friendly. Also they expressed that LC provided quality solutions as they consider different needs and requirements of the clients.
Although majority of the respondents did not provide proper justification, there were few who wanted to see new solutions which covered areas like brokerage and investment services, solution regarding information management, advice regarding portfolio and upgraded trade solutions. Others include services regarding account, expansion of network, management of liquidity, working capital and risk.
On the contrary, there were also few respondents who wanted LC to remove some existing services. Although proper clarifications could not be found, it could be comprehended that services with low use rate could be removed while concentrating more on few admired ones to upgrade them as well as include updated ones.
Clients were also asked to provide feedback and suggestions to improve the services and solutions. Majority of the respondents pointed out the need to publicize the services extensively along with concentration on more frequent communication with clients. They also suggested that less LC rates and reduced waiting time would be preferred. Also, they wanted to see the staff become more responsive committed.
FINDINGS AND RECOMMENDATIONS
Major Findings:
From the descriptive analysis of the entire credit approval process of Standard Chartered Bank along with the overall risk evaluation of the clients, it could be realized that every piece of data affecting the creditworthiness of the clients are scrutinized cautiously with the help of experts in different divisions before final approval. This thorough and elaborate process not only helps the bank manage risk but simplifies the process of assuring client satisfaction. The use of network based systems reduces manual labor and makes the process efficient and the evaluation of analysis at different levels by different experts ensures thorough inquiry and flawless decision making. Despite all these positive aspects of this comprehensive system of credit risk analysis, there are some minor shortcomings that might affect the level of satisfaction of the clients:
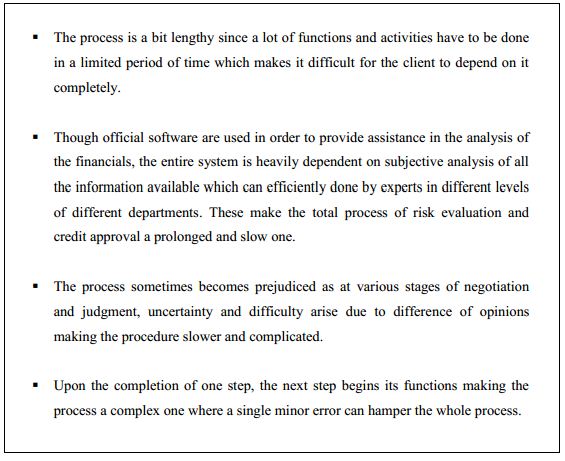
As long as client satisfaction is concerned, this lengthy approval process pose negative impact on the client relationships since it lengthens the waiting time. The survey result shows similar picture and supports the observation.
From the comprehensive analysis of the survey outcome it could be understood that the relationship longevity of majority of the clients with the bank exceeds 5 years which is an indication that they are satisfied enough with the services and solutions that are offered by the Local Corporate Segment. They are not only concerned about the details of the products they use but also responsive enough to identify the services they prefer the most.
The reasons behind the services being satisfactory include the ability of Local Corporate to meet the commitment that it makes to the clients. Majority of the clients felt that the products are reliable, accessible and in line with the quality that they promise. The clients receive adequate assistance from the all-inclusive services and solutions offered since these are designed to serve various features of clients‟ businesses and provide prompt update and
notification as to when and how these would be provided. Majority of the clients also found the services to be standard and did not support the addition of new services or removal of any of the existing solutions.
On the contrary, Clients also felt that the staffs should be prompt, polite and responsive and should communicate with them on a regular basis even though they hardly reveal their objection or criticize the services and solutions offered or the staffs they communicate with. Another negative factor mentioned by the clients was the long waiting time which was referred to as expensive. There were a few clients who thought services regarding foreign exchange could be added to the solutions offered by Local Corporate segment for the improvement of overall quality. All in all the clients were reasonably satisfied with the services offered and stated that the quality of the solutions provided were good which could also be comprehended form the financial analysis where the outcome supported the survey
results.
It was also found from the study, that the factor that affected the clients‟ level of satisfaction regarding the service and solutions offered to them by Local Corporate segment were the rates (which also has significant impact on the overall quality of the services perceived by the clients) and the promises it makes or the guarantee it provides to them. Apart from that, it was also understood that the availability of the Local Corporate staff as well as the services
and solutions, their dependability and consistency do not considerably affect the level of satisfaction of the clients. Another important finding was that, the clients‟ statements regarding the standard of the solutions provided do not significantly affect the perception of the clients regarding their level of satisfaction as well as their decision as to how long they want to keep themselves related to the bank. In addition, the dependability if the services, availability, politeness and responsiveness of the staff as well as their view or opinion concerning their level of satisfaction also do not influence choice of maintaining relationship with Standard Chartered Bank.
Recommendations:
Reduce the turnaround time of the process which could be done through proper synchronization of the various activities and their simultaneous execution. Say for instance, the analyzing the clients‟ financials and getting clearance form CIB could be the two initial steps taken by the Credit Operation Department rather than waiting for the approvals from the clients or the Heads during the period the Relationship Managers keep working on the
relationship with potential companies. In this way, the process could be shortened since the Business Credit Approval File could be processed quickly because the financial analysis would be all set to be included in it and the clients could also be offered the „Offer Letters‟ right away.
An Automated procedure for approval of credit applications could be developed and introduced which would not only speed up the system but attract the clients towards the bank more since the expensive waiting time would be shortened.
An initial approval from the head of the team could be provided to the clients applying for loan facilities rather than relying on multiple approvals at various stages of credit risk evaluation and they could be permitted to use the facility immediately provided that the facility would be secured with highly valued collaterals. Eventually, when the clients start using the facilities, the process of providing approval could be promoted to advanced stages and thorough evaluation of the clients‟ information could be done along with increasing the facility amounts as well as relaxing the security.
With the above modifications, the internal system could be strengthened which would contribute directly to the enhancement of the level of satisfaction of the clients of Local Corporate. Apart from all these, more concentration could be given on services that provide the highest level of satisfaction to the clients i.e. Collection Services, Supply Chain Financing, Clearing Service etc. Proficient use of the cash assets provided by the clients should be ensured along with the certainty to align the utilization with the core strategic goal of Local Corporate.
This segment has always been demonstrating world-class competency not only in terms of service quality and standard but in terms of building global networks and skillful workforce. This segment should allocate extra investments for providing the local clients with flawless solutions and access to global markets with tremendous growth prospects. In addition to promoting the services and solution on a regular basis, Local Corporate should initiate additional services concerning management of liquidity on local scale and short term financing. Also, services related to transaction, overseas payments involving multiple currencies etc. could be introduced in order to retain the relationships.
The process of making adequate improvement to the entire system of credit risk analysis would be a complicated one and would require extensive internal support. Moreover, the survey result illustrates the fact that the level of satisfaction of the clients could be raised if the staff are trained to become more prompt. Assistance from supporting staff could also help reduce the workload and the segment can concentrate more on providing personalized services to the specific needs of the clients. Workforce should be motivated with encouragement with proper incentives with the aim to ensure effective communication with the potential clients. The rates of Local Corporate should be amended if required but only after thorough prior research and survey since this is one of the most important factors affecting the level of satisfaction of the clients of this segment. Also, improvements to the services could be done through providing the clients proper channels to express constructive feedbacks and appropriate initiatives taken by the Relationship Managers.
CONCLUSION
In order to maximize profit as well as sustain in this intensive competition, Standard Chartered Bank must review its strategic plans on a regular basis. The wholesale banking has been showing positive trends in terms of revenue growth along with progress in developingskillful and proficient workforce capable of garnering the existing widespread client base.
From the descriptive analysis of its credit risk assessment procedure and a comprehensive survey of the level of satisfaction of the clients, it is evident that the bank has been able to strategize in a well-organized and resourceful manner that has led to a competent internal management of credit risk analysis along with extending the client base keeping all the significant and key factors affecting the level of satisfaction is mind.
Despite the shortcomings of the procedures that have been developed through systematic planning and direction, the overall system has always been able to ensure global standard not only in terms of the services and solutions that are offered to the clients but also in terms of the promises it makes to the customers. The performance of this bank so far has been tremendously well and the reason behind this is the absolute dedication and careful execution of plans. Clients have higher expectations from an expert bank and with the aim to live up to these expectations, Standard Chartered Bank has always demonstrated relentless concentration of product quality and brand value and as far as reliability is concern.
APPENDIX