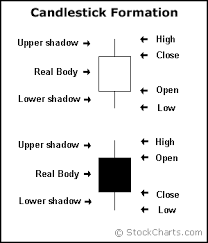
This article focus to Define and Discuss on the Candlestick Chart. Candlestick chart is often a graphic tool looks much like a regular bar chart or graph. However, instead of the traditional bars, the chart works by using marks that resemble candlesticks to plot data. The four primary facts that those sticks will certainly tell its viewers will be the open, high, low, and close values of each price period. The body of a candlestick represents two details. The line that extends upward is ‘high’, and the line that extends downward is the ‘low’. On the consequence, the top and bottom the main body represent the launching and closing price.
Define and Discuss on the Candlestick Chart