Introduction of the Report
The internship program is an integral part of Bachelor of Business Administration (BBA).This program creates a unique opportunity for the student to apply their theoretical knowledge into practice and gain valuable real world business experience. During the program, student can also realize existing business condition apart from having opportunities to solve the problem using various analytical tools.
In the age of modern civilization bank is playing its spending role to keep the economic development wheel moving. The corporation of the bank is needed in every economic activity. In fact there is hardly any aspect of development activity where state inspired or otherwise where bank do not have role to play.
Background of the Report
Rupali Bank Ltd. is one of the largest and oldest government commercial bank in Bangladesh, with years of experience. Adaptation of modern technology both in terms of equipment and banking practice ensures efficient service to clients. 492 branches, Rupali Bank is a bank that serves both clients and country.
This report, “Performance Evaluation of Rupali Bank Limited”, has been prepared to fulfill the partial requirement of BBA program as a mean of Internship Program. While preparing this report, I had a great opportunity to have an in depth knowledge of all the banking activities of Rupali Bank Ltd.
Significance of the Report
Education will be the most effective when theory and practice blends. Theoretical knowledge gets its perfection with practical application. And the internship is designed to bridge the gap between the theoretical knowledge and real application. We all know that there is no alternative of practical knowledge which is more beneficial than theoretical aspects. The prime reason of this study is to become familiar with the practical business world and to attain practical knowledge about the overall Banking and Corporate world, which is so much essential for each and every student to meet the extreme growing challenges in job market.
Scope of the Report
In order to maintain the speed of development now Banks must compete in the market place both with local institution as well as foreign ones. The presentation of the organizational structure and policy of Rupali Bank Ltd. and investigating the strategies apply by it provide the scope of this report. An infrastructure of the organization has been detailed and looks into the future. The scope of this report is limited to the overall description of the bank, its services, its position in the industry, its financial performance analysis the practical progress of its operation. The scope of the study is limited to organizational setup, functions and performances.
- Recent performance of RBL in terms of deposit, investment and foreign exchange.
- To analyze the banks current financial flows performed by RBL.
- To obtain practical experience about general banking activities by involving such type of program.
- To build professional carrier in the banking sectors as well as any credit providing institution.
Objectives
– General Objective
The general objective of the report is to evaluate the financial performance of Rupali Bank Limited.
– Specific Objectives
The following aspects can be listed as the specific objectives for this practical orientation in Rupali Bank Limited:
- Ø To identify and assess the present financial performance of Rupali Bank Limited.
- Ø To calculate the financial ratios and identify the areas of concern.
- Ø To understand the implications in analyzing and interpreting the financial ratios.
- Ø To compare the financial situation of Rupali Bank Limited with the one other government bank- Pubali Bank Limited.
- Ø To evaluate the financial performance of Rupali Bank Limited and compare with the Pubali Bank Limited.
- Ø To identify the findings and raise possible recommendations for improving the performance of Rupali Bank Limited.
Methodology
- Research Design
This report is a descriptive type of research, which briefly reveals the overall activities performed by Rupali Bank Ltd. It has also been administered by collecting secondary data. Annual reports of RBL were the major secondary data sources in this regard. Ratio analysis and trend analysis have also been used as major tools for the financial performance analysis. The study is performed based on the information extracted from different sources collected by using a specific methodology. This report is analytical in nature.
- Primary data:
- Take expert opinion from the officers.
- Direct observation.
- Informal Discussion.
- Secondary data Sources
- Annual Report of RBL.
- Different text book & journals.
- Various reports & articles related to study.
- Some of my course elements as related to this report.
- Web base support from the internet & intranet.
- Data Collection Procedure and Instruments
For the “Financial Performance Evaluation of Rupali Bank Limited” I mainly used Secondary data. Besides this I also collect some information by taking expert opinion from the officers and direct observation while I doing the internship program at the bank.
Instruments Used For Analysis
- Ratio Analysis
- Trend Analysis
- Ratio Analysis:
The quantitative (such as ratio analysis) tools are used to analyze the gathered data and different types of computer software are used for reporting the gathered information from the analysis such as- Microsoft Word, Microsoft Excel etc. Ratio can be classified into four broad groups-
1) Liquidity Ratio.
2) Activity Ratio.
3) Debt Ratio.
4) Profitability Ratio.
- Trend analysis:
It is really important to analysis trends in ratios as well as their absolute levels. This analysis informs us whether a company’s financial condition improving or deteriorating.
Limitations
Observing and analyzing the broad performance of a bank and one of its Branches are not that easy. Moreover due to obvious reasons of scrutiny and confidentiality, the bank personnel usually don’t want to disclose all the statistical information about their organization. Time is another major limitation of the duration of the program was ten weeks only and being a temporary member of the organization, it was not possible on my part to notice or express some of the sensitive issues and other aspects.
However the some of the limitations I have face while preparing this Report are listed as follows:
- Time Limitation: To complete the study, time was limited by two months. It was really very short time to know details about an organization like Rupali Bank Ltd.
- Inadequate Data: Lack of available information about export & import business operations of Rupali Bank Ltd. Because of the unwillingness of the busy key persons, necessary data collection became hard. The employees are extremely busy to perform their duty.
- Lack of Record: Large-scale research was not possible due to constrains and restrictions posed by the organization. Unavailability of sufficient written documents as required making a comprehensive study. In many cases up-to-date information was not available.
- Lack of experiences: Lack of experiences has acted as constraints in the way of meticulous exploration on the topic. Being a member of the organization; it was not possible on my part to express some of the sensitive issues. Lack of adequate knowledge about export & import business of any organization.
Historical background
Rupali Bank Ltd. was constituted with the merger of 3 (three) erstwhile commercial banks i.e. Muslim Commercial Bank Ltd., Australasia Bank Ltd. and Standard Bank Ltd. operated in the then Pakistan on March 26, 1972 under the Bangladesh Banks Order 1972, with all their assets, benefits, rights, powers, authorities, privileges, liabilities, borrowings and obligations. Rupali Bank worked as a nationalized commercial bank till December13, 1986. Rupali Bank Ltd. emerged as the largest Public Limited Banking Company of the country on December 14, 1986.
Company Profile
Rupali Bank Ltd. is a state- owned Commercial Bank. Rupali Bank came into being in 1972 with the integration of Muslim Commercial Bank, Australasia Bank and Standard Bank Ltd. From the very inception of its birth, this Bank, as a prospective bank, has been passing its time through diverse strengths, weaknesses, opportunities and threats.
Present Capital Structure
Authorized Capital : Tk. 7000 million (US$ 120.70 million)
Paid up Capital : Tk. 1250 million (US$ 21.55 million)
Break up of paid up Capital
Government shareholding : 93.11%
Private shareholding : 06.89 %
Present Share Structure
Total Number of share (Each lot 10): 1, 25, 00,000
Share Demated by shareholders as on 31.03.2010: 749306
Number of Branches
Rupali Bank operates through 492 branches. It is linked to its foreign correspondents all over the world.
Number of Zones and Corporate Offices
The Corporate Head Office of the Bank is located at Dhaka with one local office (Main Branch), four corporate branches at Dhaka, one in Chittagong and twenty-five zonal offices all over the country.
Number of Employees
The total number of employees is 4293.
Board of Directors
The Board of Directors is composed of ten members headed by a Chairman and the directors comprised of representatives from both public and private sectors and shareholders.
Chief Executive
The Bank is headed by the Managing Director (Chief executive) who is a reputed professional Banker.
Vision, Mission, Core Values & Strategic Objective
Vision
Our vision is to expand our loyal customer base by being known as the financial partner of choice that constantly exceeds customer expectation.
Mission
– Develop long- term relationships that help our customers achieve financial success.
– Offer rewarding career opportunities and cultivate staff commitments.
– Uphold ethical values and meet its customer’s financial needs in the fastest and most appropriate way and continue innovative works in order to achieve human resource with superior qualities, technological infrastructure and service packages.
Core Values
– Social Responsibility- we care for and contribute to our communities.
– Performance- we measure results and reward achievements.
– Integrity- we uphold trustworthiness and business ethics.
– Respect- we cherish every individual.
– Innovation- we encourage creativity.
– Teamwork- we work together to succeed.
The first letters of the initial words form “SPIRIT” and carry equal importance
Strategic Objectives
- Develop a customer oriented service culture with special emphasis on customer care and convenience.
- Increase our market share by following a disciplined growth strategy.
- Achieve a significant share of deposit and credits from the existing and niche markets.
- Leverage our technology platform and pen scalable systems to achieve cost- effective operations, efficient MIS, improved delivery capability and high service standards.
- Develop innovative products and services that attract our targeted customers and market segments.
- Maintain a high quality assets portfolio to achieve strong and sustainable returns and to continuously build shareholders’ value.
- Explore new avenues for growth and profitability, particularly by diversifying loan portfolio through structured finance and expansion of retail and SME financing.
- Strengthen the bank’s brand recognition.
Products and Services
Export Credit (Pre-shipment & Post-shipment)
Suppliers Credit
Letter of Credit (Import)
Guarantees in Foreign Currency
- Bid Bond
- Performance Guarantee
- Advance Payment Guarantee
Bill purchasing/ discounting
Remittance, Collection, Purchases & Sales of Foreign Currency & Traveler’s Cheques
NRTA (Non-Resident Taka A/C )
NFCD Account (Non-Resident Foreign Currency Deposit)
RFCD Account (Resident Foreign Currency Deposit)
Convertible & Non-convertible Taka Account
Forward contracts
Correspondent Banking Relations etc
New Products and Services:-
– Merchant Banking Services
– ELDORADO EFT System ( will be introduced soon)
- Local Remittance
- Foreign Remittance
Functions of Rupali Bank Ltd.
– General Banking
Rupali Bank Ltd. extends all the Banking facilities and services to customers.
The Bank has a very wide network of activities and services both in urban and rural areas through its 492 branches all over the country.
Deposit schemes
–Savings Deposit
–Current Deposit
–Short Notice Deposit
–Time Deposit
–DPS
–Rupali Deposit Pension Scheme
–Festival Deposit
–Call Deposit
Rate of Interest
| |||||||||||||||||||||||||||||||||
| * The rates of interest are changeable from time to time depending upon market competition. | |||||||||||||||||||||||||||||||||
– Other Banking services
Rupali Bank Ltd. provides prompt and excellent other Banking Services like issuing
| | Demand Draft |
| | Pay Order |
| | Telegraphic Transfer |
| | Mail Transfer |
| | Call Deposit |
| | Transfer of Fund on standing instruction arrangement |
– Computerized Banking Service
To modernize banking operation and ensure prompt services, major branches of the bank have already been computerized. Other important branches are in the process of computerization.
– One Stop service
In order to provide speedy services to the customers, Rupali Bank Ltd. has already introduced One Stop Service in 27 branches. Another Branch is going to render One Stop Service very shortly.
Credit Facilities
| General Credit Line and Programs | |
| Rupali Bank Ltd. extends credit facility to almost every sector of the country’s economic activities. | |
| Main focus of Rupali Bank Credit program is on financing trade and commerce, business and industry having productive purpose. | |
| Credit facilities are also offered to international trade and business, export and import. | |
| Credit Program of the Bank also covers development of rural economic activities like agriculture and livestock, diary and poultry, fishing and hatchery etc. | |
| Loan is provided to thrust sectors declared by the government at a concessional term. | |
| Lending programs are operated as per guideline of Bangladesh Bank (the central bank of the country) through an effective lending policy and procedure of the Bank. | |
| Lending policy of the Bank ensures quick processing, sanctioning and disbursement of loan in all viable sectors | |
– Rural Credit Programs
| Bangladesh is mainly a land of agriculture. A vast majority of our people lives in the rural areas and their main source of income are agriculture and agro-business. To produce agricultural output, promote agro-business, facilitate agro-based services, create and sustain employment opportunities, Rupali Bank Ltd. is disbursing agricultural loan/rural credit through its 401 branches all over the country. |
| Sectors of Financing |
| Rupali Bank Ltd. extends credit to the following rural sectors: |
|
|
|
|
|
|
Human Resources (HR)
In Rupali Bank, strongly believe that our human resources can be the most useful asset to contribute to the bank’s growth and success. The activities of the Rupali Bank ltd. has established a competitive and enabling working environment to help employees to perform at their best. Side by side the human resource division of the bank is prepared and committed to play strategic human resource management roles aiming at maintaining a competitive advantage by formulating and executing competent human resource systems.
In regard to employee development HR Training & Development Center arranged training, workshop, seminar, coaching etc. for the bank officers.
HR Future Plan for 2011
We envisage engaging in the following areas in 2011:
- Implementation of a Revised Human Resources Policy and Procedure Manual.
- Up- gradation of 6 new branches as Corporate-I & of 42 branches as Corporate-II.
- Substantial review of existing policies for providing more benefit to employees with a view to introducing a system of reward and higher job satisfaction.
- Conducting an Employee Satisfaction Survey.
- As a part of retention program, HR Division is going to implement succession plan and review some benefits. Internal talent hunt is already in place offering the opportunity for job rotation to enhance their knowledge and maintain their core competence. And
- Recruitment formalities have already been completed for employing 792 officers in the year 2011.
Foreign Remittance
Foreign remittance plays an important role in the overall foreign exchange business of Rupali bank ltd. The way of inward foreign remittance is FDD, foreign TT and Western union. Among the foreign remittance the major portion are received from the wage earners who are staying different countries of the world. Sometimes foreign remittance are received as agent commission and salary of the Bangladeshi national doing job in foreign country.
Facilities allowed in connection with foreign remittance
| a) | No collection commission is realized for collection of Taka draft from branches of same bank or from branches of other banks. |
| b) | Arrangement has been made for payment of remittance within 3 days. |
| c) | Complaints Cell has been opened in Head office where both remitter & beneficiary may place complain regarding payment of remittance. |
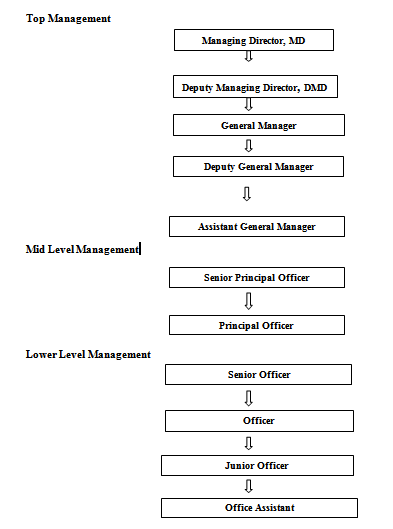
Organogram
There is a figure given below which expresses the employee hierarchy of Rupali Bank Ltd.
Top Management
Financial Performance Analysis
Financial Performance is a subjective measure of how well a firm can use its assets from business and generate revenues. Financial Performance term is also used as a general measure of a firm’s overall financial situation over a given period of time, and can be used to compare with similar firms across the same industry or to compare industries or sectors in aggregation.
Financial performance analysis refers to an assessment of the viability, stability and profitability of a business, sub-business or project. It is performed by professionals who prepare reports using ratios that make use of information taken from financial statements and other reports. These reports are usually presented to top level management as one of their bases in making business decisions.
Balance Sheet
In financial accounting, a balance sheet or statement of financial position is a summary of the financial balances of a sole proprietorship, a business partnership or a company. Assets, liabilities and ownership equity are listed as of a specific date, such as the end of its financial year. A balance sheet is often described as a “snapshot of a company’s financial condition”. Of the four basic financial statements, the balance sheet is the only statement which applies to a single point in time of a business’ calendar year. A standard company balance sheet has three parts: assets, liabilities and ownership equity.
Income Statement
Income statement also referred as profit and loss statement, earnings statement, operating statement or statement of operations is a company’s financial statement that indicates how the revenue is transformed into the net income. It displays the revenues recognized for a specific period, and the cost and expenses charged against these revenues, including write-offs (e.g., depreciation and amortization of various assets) and taxes. The purpose of the income statement is to show managers and investors whether the company made or lost money during the period being reported.
Ratio Analysis
Ratio analysis involves methods of calculating and interpreting financial ratios to assess the bank’s performance and status. The basic inputs to ratio analysis are the bank’s income statement and balance sheet. Various devices are used in the analysis of financial statement data to bring out the comparative and relative significance of the financial information presented includes ratio analysis, comparative analysis, percentage analysis and examination of related data.
Significance of Using Ratios
The significance of a ratio can only truly be appreciated when:
- 1. It is compared with other ratios in the same set of financial statements.
- 2. It is compared with the same ratio in previous financial statements (trend analysis).
- 3. It is compared with a standard of performance (industry average).Such a standard may be either the ratio which represents the typical performance of the trade or industry, or the ratio which represents the target set by management as desirable for the business.
Types of Ratio Comparisons
Ratio analysis is not merely the application of a formula to financial data to calculate a given ratio. More important is the interpretation of the ratio value. To answer such questions as is it too high or too low? Is it good or bad? Two types of ratio comparisons can be made: Cross-sectional & Time-series analysis.
– Time-Series Analysis
Time-series analysis evaluates performance over time. Comparison of current to past performance, using ratios, allows the firm to determine whether it is progressing as planned. Additionally, time-series analysis is often helpful in checking the reasonableness of a firm’s projected financial statements.
– Cross-Sectional Analysis
Cross-Sectional analysis evaluates performance of different firms` financial ratios at the same point in time.
– Combined Analysis
The most informative approach to ratio analysis is one combines cross-sectional and time-series analysis. A combined view permits assessment of the trend in the behavior of ratio in relation to the trend for the industry.
Cautions about Ratio Analysis
Before discussing specific ratios, we should consider the following cautions:
- A single ratio does not generally provide sufficient information from which to judge the overall performance of the firm.
- Be sure that the dates of the financial statements being compared are the same.
- It is preferable to use audited financial statements for ratio analysis.
- Be certain that the data being compared have all been developed in the same way.
Groups of Financial Ratios
Financial ratios can be divided into four basic groups or categories:
- i. Liquidity ratios
- ii. Activity ratios
- iii. Debt ratios &
- iv. Profitability ratios
Liquidity, activity, and debt ratios primarily measure risk, profitability ratios measure return. In the near term, the important categories are liquidity, activity, and profitability, because these provide the information that is critical to the short-run operation of the firm. Debt ratios are useful primarily when the analyst is sure that the firm will successfully weather the short run.
Liquidity Ratio
The liquidity of a business firm is measured by its ability to satisfy its short term obligations as they come due. Liquidity refers to the solvency of the firm’s overall financial position. The three basic measures of liquidity are-
- Net working capital = Current Assets – Current Liability
- Current ratio = Current Assets / Current Liability
- Quick Ratio = Cash + Government Securities + Receivable / Total Current Liabilities
– Net Working Capital:
Current assets, commonly called working capital, represent the portion of investment that circulates from to one form to another in the ordinary conduct of business. And net working capital is commonly defined as the difference between the firm’s current assets and its current liabilities.
Net Working Capital =Total Current Assets –Total Current Liabilities.
– Current Ratio:
One of the most general and frequently used of these liquidity ratios is the current ratio. Organizations use current ratio to measure the firm’s ability to meet short-term obligations. It shows the banks ability to cover its current liabilities with its current assets.
Current Ratio = Current Asset / Current Liabilities
Standard ratio: 1:1
– Quick Ratio:
The quick ratio is a much more exacting measure than current ratio. This ratio shows a firm’s ability to meet current liabilities with its most liquid assets.
Quick Ratio=Cash + Government Securities + Receivable / Total Current Liabilities.
Standard ratio: 1:1
– Operating Cost to Income Ratio:
It measures a particular Bank’s operating efficiency by measuring the percent of the total operating income that the Bank spends to operate its daily activities. It is calculated as follows:
Cost Income Ratio = Total Operating Expenses / Total Operating Income
Activity Ratio
Activity ratios measure the speed with which accounts are converted into sale or cash. With regard to current accounts measures of liquidity are generally inadequate because differences in the composition of a firm’s current accounts can significantly affects its true liquidity.
A number of ratios are available for measuring the activity of the important current accounts which includes inventory, accounts receivable, and account payable. The activity (efficiency of utilization) of total assets can also be assessed.
– Total Asset Turnover:
The total asset turnover indicates the efficiency with which the firm is able to use all its assets to generate sales.
Total Asset Turnover = Net Sales / Total Asset
– Investment to Deposit Ratio:
Investment to Deposit Ratio shows the operating efficiency of a particular Bank in promoting its investment product by measuring the percentage of the total deposit disbursed by the Bank as long & advance or as investment. The ratio is calculated as follows:
Investment to Deposit Ratio = Total Investments /Total Deposits
– Inventory Turnover:
A ratio showing how many times a company’s inventory is sold and replaced over a period.
Inventory Turnover= Cost of Goods Sold/Average Inventory
The days in the period can then be divided by the inventory turnover formula to calculate the days it takes to sell the inventory on hand or “inventory turnover days”. This ratio should be compared against industry averages. A low turnover implies poor sales and, therefore, excess inventory. A high ratio implies either strong sales or ineffective buying.
High inventory levels are unhealthy because they represent an investment with a rate of return of zero. It also opens the company up to trouble should prices begin to fall.
– Average Collection Period:
Average collection period is useful in evaluating credit and collection policies. This ratio also measures the quality of debtors. It is arrived at by diving the average daily sales into the accounts receivable balance:
Average Collection Period=Accounts Receivable / Average Sales per Day (Credit Sales/365)
A short collection period implies prompt payment by debtors. It reduces the chances of bad debts. Similarly, a longer collection period implies too liberal and inefficient credit collection performance. It is difficult to provide a standard collection period of debtors.
– Average Payment Period:
Average payment period ratio gives the average credit period enjoyed from the creditors that means it represents the number of days by the firm to pay its creditors. A high creditor’s turnover ratio or a lower credit period ratio signifies that the creditors are being paid promptly. This situation enhances the credit worthiness of the company. However a very favorable ratio to this effect also shows that the business is not taking the full advantage of credit facilities allowed by the creditors. It can be calculated using the following formula:
Average Payment Period=Accounts Payable/Average Purchase per Day (Credit Purchase/365)
– Fixed Asset Turnover:
A financial ratio of net sales to fixed assets. The fixed-asset turnover ratio measures a company’s ability to generate net sales from fixed-asset investments – specifically property, plant and equipment (PP&E) – net of depreciation. A higher fixed-asset turnover ratio shows that the company has been more effective in using the investment in fixed assets to generate revenues. The fixed-asset turnover ratio is calculated as:
Fixed Asset Turnover=Gross Turnover/ Net Fixed Assets
Debt Ratio
The debt position of that indicates the amount of other people’s money being used in attempting to generate profits. In general, the more debt a firm uses in relation to its total assets, the greater its financial leverage, a term use to describe the magnification of risk and return introduced through the use of fixed-cost financing such as debt and preferred stock.
– Debt Ratio:
Many new ventures will incur debt as a means of financing the start-up. The debt ratio helps the entrepreneur to asses. The firms ability to meet all of its obligations (short and long term). It is also a measure of risk because debt also consists of a fixed commitment in the form of interest and principal repayments.
Debt Ratio = Total Liabilities / Total Assets
– Equity Capital Ratio:
The ratio shows the position of the Bank’s owner’s equity by measuring the portion of total asset financed by the shareholders invested funds and it is calculated as follows:
Equity Capital Ratio = Total Shareholder’s Equity / Total Assets
The ability to service debt:
It refers the ability of a firm to meet the contractual payments required on a scheduled basis over the life of a debt. The firm’s ability to meet certain fixed charges is measured using coverage ratios.
– Time Interest Earned Ratio:
This ratio measures the ability to meet contractual interest payment that means how much the company able to pay interest from their income.
Time Interest Earned Ratio=EBIT/ Interest
– Debt to Equity Ratio
This ratio assesses the firm’s capital structure. It provides a measure of risk to creditors by considering the funds invested by creditors (debt) and investors (equity). The higher percentage of debt is greater the degree of risk to any creditor.
Debt to equity ratio= Total Liabilities/ Shareholders Equity
Profitability Ratio
These measures evaluate the bank’s earnings with respect to a given level of sales, a certain level of assets, the owner’s investment, or share value. Without profits, a firm could not attract outside capital. Moreover, present owners and creditors would become concerned about the company’s future and attempt to recover their funds. Owners, creditors, and management pay close attention to boosting profits due to the great importance placed on earnings in the marketplace.
– Operating Profit Margin:
The Operating Profit Margin measures the percentage of each sales dollar remaining after all cost and expenses other than interest, taxes and preferred stock dividends are deducted; the “pure profits earned on each sales dollar. A high operating profit margin is preferred. The operating profit margin is calculated as follows:
Operating Profit Margin = Operating Profit / Sales
– Net Profit Margin:
The net profit margin measures the percentage of each sales dollar remaining after all expenses, including taxes, have deducted. The higher the net profit margin is better. The net profit margin is calculated as follows:
Net profit Margin = Net Profit after Taxes / Sales
– Return on Asset (ROA):
Return on asset (ROA) measures the overall effectiveness of management in generating profits with its available assets also called the return on investment. The higher ratio is better.
Return on Asset (ROA) = Net Profit after Taxes / Total Assets
– Return on Equity (ROE):
The Return on Equity (ROE) measures the return earned on the owners (both preferred and common stockholders) investment. Generally, the higher this return, the better off the owners.
Return on Equity (ROE) = Net Profit after Taxes / Stockholders Equity
– Earnings Per Share (EPS):
The firm’s Earning per share (EPS) are generally of interest to present or prospective stockholders and management. The Earning per share represent the number of dollars earned on behalf of each outstanding share of common stock.
EPS= Net Income/No. of Share Outstanding
Market Ratio
Relate the firm’s market value, as measured by its current share price, to certain accounting values. These ratios give insight into how well investors in the marketplace feel the firm are doing in term of risk and return.
– Price/ Earnings Ratio (P/E Ratio):
The Price/ Earnings ratio (price-to-earnings ratio) of a stock is a measure of the price paid for a share relative to the income or profit earned by the firm per share. The Price/earnings ratio measures the amount that investors are willing to pay for each taka of a firm’s earnings. The level of this ratio indicates the degree of confidence investors have in the firm’s future performance. The higher the P/E ratio, the greater the investor confidence.
P/E Ratio = Market Price per Share / Earnings per Share
Ratio Analysis
Liquidity Ratio
Liquidity ratio measures of the enterprise’s short- run ability to pay its maturing obligations.
- a. Current Ratio
The current ratio, one of the most commonly cited financial ratios, measures the firm’s ability to meet its short term obligations. The higher the current ratio, the better the liquidity position of the firm. It is expressed as:
Current Ratio=Current Asset / Current Liabilities
Year | 2007 | 2008 | 2009 | 2010 |
Current Ratio (tk.) | 0.89 | 0.89 | 1.17 | 1.11 |
Table: 1 Current Ratio
Source: Annual Report of RBL (2007, 2008, 2009, 2010)
Graphical Presentation:
Figure: 3 Current Ratio
Interpretation:
Generally, the higher the current ratio, the more liquid the firm is considered to be. In 2009, RBL was maintaining 1.17 tk. current assets against 1 tk. current liability but in 2010 its current assets decreased in 1.11 tk. where as normally banking industry maintains 1: 1 current ratio. This graph shows that, RBL current ratio fluctuated from 2008 to 2010.
- b. Net Working Capital
The proportion of investment that is requires to conduct the business is called working capital. It is the blood of the firm. Net working capital is the difference between the firm’s current assets and its current liabilities. Net working capital, although not actually a ratio is a common measure of a firm’s overall liquidity a measure of liquidity ratio calculated by
Net Working capital=Current Asset – Current Liabilities
Year | 2007 | 2008 | 2009 | 2010 |
Net working capital (crore) | -508.24 | -700.35 | 667.99 | 563.69 |
Table: 2 Net Working Capital
Source: Annual Report of RBL (2007, 2008, 2009, 2010)
Interpretation:
Working capital is blood for every firm because without working capital a firm can not run its daily activities perfectly. From above figure it has been that, in 2010 RBL’s net working capital was 563.69 crore that was enough for the bank to meet up the current obligations but this amount was lower than the year of 2009 i.e. 667.99 crore, it is not a good sign. It has also been that in 2008 RBL’s net working capital was very poor.
Activity Ratio
Activity ratio measures of how effectively the enterprise is using the assets employed. In other word, it measures the speed with which various accounts are converted into sales or cash- inflows or outflows.
- a. Total Asset Turnover
The total asset turnover indicates the efficiency with which the firm is able to use all its assets to generate sales.
Total Asset Turnover= Net sales / Total Asset
Year | 2007 | 2008 | 2009 | 2010 |
Total Asset Turnover (times) | 0.072 | 0.071 | 0.083 | 0.066 |
Table: 3 Total Asset Turnover
Source: Annual Report of RBL (2007, 2008, 2009, 2010)
Graphical Presentation:
Figure: 5 Total Asset Turnover
Interpretation:
In 2007 and 2009, RBL’s total asset turnover was higher at 0.072 and 0.083 which means 7.2 to 8.3 times but in 2008 it was decreased silently at 0.071. Generally, the higher a firm’s total asset turnover, the more efficiently its assets have been used and 4 to 6 times is standard position but it also depends on industry. In 2010 it was decreased at 0.066 which is not good sign. So it has seen that RBL’s total asset turnover fluctuated year by year.
Debt Ratio
Debt ratio measures of the degree of protection for long- term creditors and investors.
- a. Debt Ratio
The debt ratio measures the preparation of total assets provided by the firm’s creditors. It also helps to measure the risk because debt consists of a fixed commitment in the form of interest and principal repayments.
Debt Ratio= Total Liabilities / Total Assets
| Year | 2007 | 2008 | 2009 | 2010 |
Debt Ratio (%) | 95.57 | 97.92 | 96.36 | 88.63 |
Table: 4 Debt Ratio
Source: Annual Report of RBL (2007, 2008, 2009, 2010)
Interpretation:
This graph shows that, the debt ratio decreased more in 2010 i.e. 88.63% from preceding three years. The Debt ratio measures the proportion of total assets provides by the firm’s creditors. So lower the ratio, considered less risky. RBL’s debt ratios were decreasing trend from 2008 to 2010 that means bank’s dependency on loan were gradually decreasing.
- b. Debt to Equity Ratio
This ratio assesses the firm’s capital structure. It provides a measure of risk to creditors by considering the funds invested by creditors (debt) and investors (equity). The higher percentage of debt is greater the degree of risk to any creditor.
Debt to Equity Ratio= Total Liabilities / Shareholders Equity
Year | 2007 | 2008 | 2009 | 2010 |
Debt to Equity Ratio | 30.98 | 11.08 | 16.69 | 7.79 |
Table: 5 Debt to Equity Ratio
Source: Annual Report of RBL (2007, 2008, 2009, 2010)
Interpretation:
From above graph it can be realized that, RBL’s debt to equity ratio was decreased year by year except 2009 i.e. 16.69. In 2010 it was vary lower at 7.79 which indicates the lower percentage of debt is lower degree of risk of the bank.
- c. Time Interest Earned Ratio
Times interest earned ratio measures the firm’s ability to make contractual interest to make contractual interest payments; sometimes called the interest coverage ratio.
Time Interest Earned Ratio =Earnings before Interest & Taxes / Interest
Year | 2007 | 2008 | 2009 | 2010 |
Time Interest Earned Ratio | 1.21 | 1.33 | 1.54 | 1.60 |
Table: 6 Time Interest Earned Ratio
Source: Annual Report of RBL (2007, 2008, 2009, 2010)
Interpretation:
This figure shows that, RBL’s time interest earning ratio was increasing year by year that means bank’s interest payment capacity were gradually increasing. It is a good sign for a bank.
Profitability Ratio
Profitability ratio measures of the degree of success or failure of a given enterprise or division for a given period of time.
- a. Net Profit Margin
The net profit margin measures the percentage of each sales dollar remaining after all expenses, including taxes, have deducted. The higher the firm’s net profit margin is better. The net profit margin is a commonly cited measure of the company’s success with respect to earnings on sales.
Net Profit Margin=Net Profit after Tax / Sales
Year | 2007 | 2008 | 2009 | 2010 |
Net Profit Margin (%) | 1.70 | 14.94 | 23.04 | 7.27 |
Table: 8 Net Profit Margin
Source: Annual Report of RBL (2007, 2008, 2009, 2010)
Interpretation:
In this figure it has been that from 2007 to 2009 RBL’s net profit margin increased from 1.70% to 23.94% which indicates that profit margin was increasing day by day and its good situation but in 2010 bank’s net profit margin was decreased at 7.27% which indicates that the bank’s profit was decreasing. It is not a good sign.
- b. Return on Asset (ROA)
Return on asset (ROA), which is often called the firms return on total assets, measures the overall effectiveness of management in generating profits with its available assets. The higher ratio is better.
Return on Asset (ROA) = Net Profit after Taxes / Total Assets
Year | 2007 | 2008 | 2009 | 2010 |
Return on Asset (%) | 0.33 | 0.46 | 1.17 | 1.15 |
Table: 9 Return on Asset (ROA)
Source: Annual Report of RBL (2007, 2008, 2009, 2010)
Interpretation:
In this figure it has been that, from 2007 to 2009 RBL’s return on asset was increasing from 0.33% to 1.17% that means bank earned more profit from the asset. But in 2010, RBL’s return on asset decreased silently than 2009 it is not good for the bank.
- c. Return on Equity(ROE)
The return on equity measures the return earned on the owner’s (both preferred and common stockholders’) investment. Generally the higher the return, the better off the owner’s.
Return on Equity=Net Profit after Tax / Shareholders Equity
Year | 2007 | 2008 | 2009 | 2010 |
Return on Equity (%) | 28.53 | 10.70 | 29.89 | 4.24 |
Table: 10 Return on Equity (ROE)
Source: Annual Report of RBL (2007, 2008, 2009, 2010)
Interpretation:
In 2007 and 2009, the bank’s return on equity was higher accordingly 28.53% and 29.89% but from above figure it has been that, in 2010 the bank’s return on equity was very lower than preceding years which was not desirable. So the management should work hard to increase the return associated with equity.
- d. Investment to Deposit Ratio
Investment to Deposit Ratio=Total Investment / Total Deposit
Year | 2007 | 2008 | 2009 | 2010 |
Investment to Deposit Ratio | 0.178 | 0.178 | 0.196 | 0.175 |
Table: 11 Investment to Deposit Ratio
Source: Annual Report of RBL (2007, 2008, 2009, 2010)
Interpretation:
Investment to deposit ratio shows that which amount of deposit is used to as investment. From this graph it has been that, RBL‘s investment to deposit ratio was increasing between 2008 and 2009 that means RBL depends on deposits than the share capital. But RBL’s investment silently decreased in 2010, it is not good for a bank.
- e. Earnings Per Share (EPS)
The Earning per share represent the number of dollars earned on behalf of each outstanding share of common stock.
EPS= Net Income / No. of Share Outstanding
Year | 2007 | 2008 | 2009 | 2010 |
Earning Per Share (EPS)(tk.) | 7.50 | 69.98 | 133.48 | 48.02 |
Table: 12 Earning Per Share (EPS)
Source: Annual Report of RBL (2007, 2008, 2009, 2010)
Interpretation:
The firm’s earning per share is generally of interest to present or prospective stockholders and management. As we noted earlier, the number of taka earned during the period on behalf of each outstanding share of common stock. The graph shows that, in 2009 earnings per share of RBL’s was higher than 2008 and 2007 i.e. 133.48 tk. and it decreased in 2010 at 48.02 tk. It indicates bad sign for the bank, which can’t attract investor. To attract the investor RBL should to increase its EPS.
- f. Price/Earnings (P/E) Ratio
The price or earning (P/E) ratio is commonly used to assess the owners’ appraisal of share value. The P/E represents the amount investors are willing to pay for each dollar of the firm’s earnings. The higher the P/E ratio, the greater the investor confidence in the firm’s future. The price Earning (P/E) ratio is calculated as follows:
Price /Earnings Ratio=Market Price per Share of Common Stock / Earning Per Share
Year | 2007 | 2008 | 2009 | 2010 |
Price Earning Ratio | 246.66 | 11.98 | 10.71 | 36.15 |
Table: 13 Price/ Earnings (P/E) Ratio
Source: Annual Report of RBL (2007, 2008, 2009, 2010)
Interpretation:
From the graph it has been that in 2007 price earning ratio was higher at 246.66 but this ratio decreased more in next two years accordingly 11.98 and 10.71. In 2010 price earning ratio was 36.15 times while banking industry average of P/E is 10 times. So the banks price earning ratio is higher than the industry average.
Liquidity Ratio:
- a. Current Ratio
Year | RBL | PBL |
2008 | 0.89 | 0.88 |
2009 | 1.17 | 0.98 |
2010 | 1.11 | 1.07 |
Table: 14 Current Ratio
Source: Annual Report of RBL & Pubali Bank Limited (PBL) (2008, 2009, 2010)
Interpretation:
We know that, the current ratio measures a firm’s liquidity by measuring the portion of its current asset relative to its current liabilities and the higher the ratio, the higher the liquidity of the firm. The graph shows that, in 2008, current ratio of RBL and PBL were almost same but RBL current ration was better than PBL in 2009 and 2010 respectively 1.17 and 1.11. In 2010, RBL’s current ratio reduced at 1.11. So it can be said that, lower the current ratio, the lower the ability of the firm to pay its bills.
Activity Ratio
- a. Total Asset Turnover
Year | RBL | PBL |
2008 | 0.071 | 0.053 |
2009 | 0.083 | 0.066 |
2010 | 0.066 | 0.089 |
Table: 15 Total Asset Turnover
Source: Annual Report of RBL & PBL (2008, 2009, 2010)
Interpretation:
We know greater the total asset turnover; it is more efficient and 4 to 6 times is standard position. The graph shows that, the total asset turnover ratio of RBL was more than PBL in 2008 and 2009 but PBL has generated maximum level of turnover in year 2010 comparison with RBL It can be said that PBL was more efficiently use its assets to generate income.
Debt Ratio:
- a. Debt Ratio
Year | RBL | PBL |
2008 | 97.92% | 94.30% |
2009 | 96.36% | 97.72% |
2010 | 88.63% | 89% |
Table: 16 Debt Ratio
Source: Annual Report of RBL & PBL (2008, 2009, 2010)
Interpretation:
Every organization should give more emphasize on equity capital than debt capital. From the graph it has been that the RBL debt ratio was decreasing year by year. In case of PBL, its debt fluctuated over three years but in 2010 two banks’ debt ratio reduced from previous two years that means two banks took more steps on debt capital to reduce its risky.
Profitability Ratio:
- a. Net Profit Margin
Year | RBL | PBL |
2008 | 14.94% | 21% |
2009 | 23.04% | 19.62% |
2010 | 7.27% | 25.20% |
Table: 18 Net Profit Margin
Source: Annual Report of RBL & PBL (2008, 2009, 2010)
Interpretation:
The graph shows that, in 2010 net profit margin of RBL was so lower i.e. 7.27% but on the other hand PBL’s net profit margin was more than RBL i.e. 25.20% and over three years RBL and PBL’s net profit margin fluctuated. The higher the firm’s net profit margin, the better. So RBL should emphasis to increase its net profit margin.
- b. Return on Asset (ROA)
Year | RBL | PBL |
2008 | 0.46% | 1.54% |
2009 | 1.17% | 1.94% |
2010 | 1.15% | 2.44% |
Table: 19 Return on Asset (ROA)
Source: Annual Report of RBL & PBL (2008, 2009, 2010)
Interpretation:
After having a careful view on the graph, PBL had maximum return on asset than RBL over three years that means PBL remains more efficient to generate additional ROA than RBL. In 2009, RBL earned 1.17% on each taka of asset investment where PBL earned 1.94% on each taka. But in 2010 RBL’s return on asset silently decreased i.e. 1.15% than 2009 it is not a good sign for a bank, in this year PBL’s return on asset was 2.44%. So the higher the firm’s return on total assets, the better.
- c. Return on Equity (ROE)
Year | RBL | PBL |
2008 | 10.70% | 18.62% |
2009 | 29.89% | 22% |
2010 | 4.24% | 22.48% |
Table: 20 Return on Equity (ROE)
Source: Annual Report of RBL & PBL (2008, 2009, 2010)
Interpretation:
We know that the ROE means return earned from the owner’s investments. The graph shows that, RBL’s return on equity was fluctuating over three years. In 2009 RBL’s return on equity was in better than PBL at 29.89% but in 2010, RBL’s return was very poor on equity i.e. 4.24% where PBL earned more from the owner’s investments than RBL i.e. 22.48%. Generally, the higher this return, the better off is the owners.
- d. Investment to Deposit Ratio
Year | RBL | PBL |
2008 | 0.178 | 0.222 |
2009 | 0.196 | 0.186 |
2010 | 0.175 | 0.167 |
Table: 21 Investment to Deposit Ratio
Source: Annual Report of RBL & PBL (2008, 2009, 2010)
Interpretation:
As we know that the ratio measures the bank’s efficiency in promoting its investment products the customer and in using its funds collected from the customers to by measuring the percentage of total deposit that the bank has disbursed as loan and advances and the higher the ratio the higher the banks efficiency and vice-versa. The graph shows that, RBL’s investment remained in better position than PBL last two years that means RBL increased its deposit investment. It is a good sign.
- e. Earning Per Share (EPS) (Assume face value 100tk per share)
Year | RBL | PBL |
2008 | 69.93(tk.) | 350(tk.) |
2009 | 133.48 | 42.1 |
2010 | 48.02 | 65.1 |
Table: 22 Earning Per Share (EPS)
Source: Annual Report of RBL & PBL (2008, 2009, 2010)
Interpretation:
As we noted earlier, the number of taka earned during the period on behalf of each outstanding share of common stock. From this graph it has been that, RBL’s earning per share was in better position then PBL in 2009 but in 2010 RBL’s earning per share decreased more than 2009 which is not a good sign where PBL’s earning per share increased. Comparison between two banks it can see that RBL and PBL’s earning per share were fluctuating over three years.
Major Findings
From the analysis it has seen that Rupali Bank Ltd (RBL) Financial performance was not better than other bank such as Pubali Bank Ltd. (PBL) except in some cases.
From the current ratio analysis it has seen that in last two years RBL had enough current assets to pay its short term obligations. But in 2010 the current ratio was decreased silently than 2009.
Form the net working capital analysis it can be seen that in 2009 and 2010 RBL’s had enough working capital to meet up its current obligations but in 2010 its net working capital went down amount than 2009 that is bad sign for RBL.
From the trend analysis it has seen that RBL’s total asset turnover was fluctuating year by year. But in 2010 total asset turnover was lower than previous three years. It indicates Negative operating efficiency of RBL.
Debt Ratio RBL was in satisfactory range because in 2010 it was decreased more than last three years.
From the trend analysis RBL’s operating profit margin was increasing year by year. It is a good sign for the bank.
From the trend analysis it have seen that RBL’s net profit margin was increasing except 2010 because in 2010 bank’s net profit margin was reduced more from previous three years. It indicates negative operating result of RBL.
In 2010 the investment to deposit of the RBL decreased from previous three years. This is not a good sign for the bank.
From the analysis it has been that RBL’s earning per share was not in better than PBL except 2009 which indicates not better earnings for the bank.
The P/E ratio of RBL was more than the industry average because bank’s P/E was 36 times while industry average is approximately 10 times.
RBL’s time interest ratio was not satisfactory because in 2010 bank had only 1.60 tk. earning against 1 taka interest obligation which was not good. But from trend analysis it has seen that RBL’s interest payment ability was increasing year by year.
The RBL’s return on asset (ROA) was increasing from 2007 to 2009 but last year bank’s ROA decreased silently which is not good sign on the other hand PBL was more efficient to generate additional return on asset than RBL.
Return on equity (ROE) was also fluctuating over four years but on an average PBL had better position from RBL.
Recommendation
It is not unexpected to have problems in any organization. There must be problems to operate an organization. But there must be remedies to follow. The following commendations can be suggested to solve the above-mentioned problems:
Although RBL’s current ratio decreasing trend but the bank’s had satisfactory range of currant assets in order to satisfy the short term obligation. So RBL should maintain it.
As it has been that net working capital of RBL is satisfactory range so first it is recommended that, RBL should maintain this trend for smoothly operate its business.
Although RBL’s operating profit margin was increasing trend so bank should try to more for increasing its operating efficiency.
Form financial analysis it has seen that RBL’s net profit margin was increasing trend but in last year its net profit margin decreased more. For this reason bank should try to more for increasing its operating result.
From the trend analysis it has observed, RBL’s ROA was increasing but in 2010 it decreased silently so bank should try to improve this and should also take necessary steps to increase ROA.
From the trend analysis it has seen ROE of RBL was fluctuating. So bank should try improving this and should take necessary steps to increase ROE.
As RBL’s time interest ratio is not satisfactory so it is recommended first bank should increase its earning before interest & tax (EBIT) or reduces the debt capital in order to smoothly satisfy the interest obligations.
RBL should increase more its total asset turnover for increasing bank’s operating efficiency.
In our country, the average P/E ratio of banking industry is 10 times but RBL’s P/E ratio was 36.15 times in last year which indicates very good sign. The bank should try to maintain this and also try to improve its earning per share (EPS).
From the trend analysis it has seen investment to deposit of RBL was fluctuating. So the bank should try to improve this and should take necessary steps to increase investment to deposit.
Conclusion
Economy of Bangladesh is in the group of world’s most underdeveloped economies. One of the reasons may be its underdeveloped banking system. Government as well as different international organizations have also identified that underdeveloped banking system causes some obstacles to the process of economic development. So they have highly recommended for reforming financial sector. Since 1990, Bangladesh Government has taken a lot of financial sector reform measurements for making financial sector as well as banking sector more transparent, and formulation and implementations of these reform activities.
After analysis the financial performance of Rupali Bank Ltd. (RBL) and comparing with other bank such as Pubali Bank Ltd. (PBL) it can be realized that RBL’s banking system has some problem. RBL has enough current asset and working capital to meet up the short term obligation but the bank’s assets attention of sale is not good. Nowadays RBL take many steps to reduce debt it is a good side of the bank but its investment to deposit is not increasing and bank’s interest payment ability is not good. It can easily be find out from the analysis; the bank’s operation profit margin is increasing year by year but last year its net profit margin was decreased for lone default adjustment, diminution in value of investment and various uncertain activities. RBL’s earning per share was reducing in last that badly affects the investors’ attention.
At last it can say that, RBL’s should improve its overall banking system to influence customers and investors. Customer relation should be increased to give appropriate service to them and treat them as an asset of the company.
- Donald E. Kieso, Jerry j. Weygandt, Terry d. Warfield, Intermediate Accounting 11th Edition.
- Lawrence j. Gitman, Principle of Managerial Finance, 12th Edition
- Annual Report 2009 of Pubali Bank Limited.
- Annual Report 2010 of Pubali Bank Limited.
- Annual Report 2007 of Rupali Bank Limited.
- Annual Report 2008 of Pubali Bank Limited.
- Annual Report 2009 of Pubali Bank Limited.
- Annual Report 2010 of Pubali Bank Limited.
- 9. Websites:
http://www. Rbl.bd.com
http://www. Pbl.bd.com
http://www.wikipedia.com