VALUATION OF COMPANY:
Share valuation means what investors think of the Company’s post performance and future prospects. If the liquidity, asset management, debt management and profitability ratio all look good, then the market value ratios will be high and the stock price will probably be as high as can be expected.
RELATIVE VALUATION TECHNIQUE
Price/Earning (P/E Ratio: The Price/Earning (P/E) Ratio is commonly used to asses the owner’s appraisal of share value. The P/E ratio measure the amount the investors are wiling to pay each dollar of a firm’s earning.
Formula:
Price/Earning (P/E) Ration:
Particular | 2009 | 2008 | 2007 |
| Earning per Share | 2.05 | 2.14 | 1.86 |
| Market Price per share of common stock | 119.78 | 115.11 | 106.12 |
| Total | 5.84 | 5.37 | 5.71 |
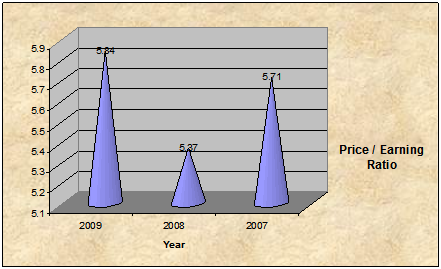
Interpretation:
P/e ratio indicats the degree of confidence that investor have in the firm’s future performance. Shinepukur Ceramics Ltd. Price Earning Ratio of 2007, 2008 and 2009 are respectively 5.84, 5.37, 5.71. Here we can see that the investor have high level of confidence on this company comparing to the other’s. So we can say that the company has a consistent performance.
Market/Book (M/B) Ratio: The Market / Book (M/B) ratio provides an assessment of how investors view the firm’s performance. It rules the market value of the firm’s shares to their book-strict accounting value.
Formula:
Market/Book (M/B) Ratio:
Particular | 2009 | 2008 | 2007 |
| Market Price per share of common stock | 119.78 | 115.11 | 106.12 |
| Book value per share of common stock | 33.90 | 29.47 | 68.85 |
| Total | 3.53 | 3.91 | 1.54 |
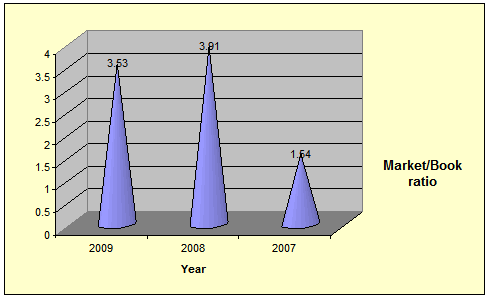
Interpretation:
Market Book ration indicates that how much would the investor are willing to pay for the each Tk. 1.00 of book value of the company’s stock. Here we can see that in 2009 the company’s position is good because it has Market Book Ration of 3.53.
Estimating Company Earning Per Share
Earning Per Share (EPS): Represents the dollar amount earned on behalf of each share-not the amount of earning actually distributed to shareholders.
Formula:
EPS:
Particular | 2009 | 2008 | 2007 |
| Earning available for common stockholders or net income | 172371934 | 179915587 | 138/6130532 |
| No. of shares of common stock outstanding | 84083870 | 84072704 | 745231468 |
| Total | 2.05 | 2.14 | 1.86 |
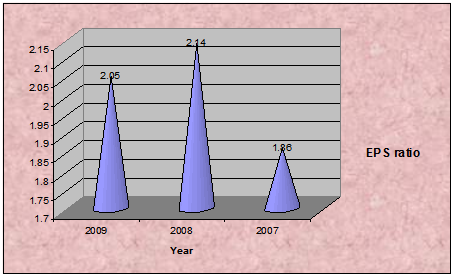
Interpretation:
In 2009 Earning per share (EPS) of was 2.05 taka which is lower than the industry average. But this is comparison is not meaningful because of certain reason, so we have to use intercompany trend comarison and here we can see that Earning per share (EPS) of this company is growing to a good level.
CAPITAL ASSETS PRICING MODEL (CAPM)
CAPM was developed to explain the behaviour of securities prices & provide a mechanism where by investors could assess the impact of a proposed security investment portfolio’s overall risk & return.
Formula:
Ri = Rf + (Rm-Rf), i
Here, Ri = Required rate of return
Rm = Market required rate of return
Rf = Risk free rate
i = Beta coefficient
Assume Risk free rate is 16%
Year | Rf | Rm | Ri | |
2009 | 0.16 | 0.15 | (0.001) | 15.999% |
2008 | 0.196 | 0.12 | (0.001) | 15.999% |
2007 | 0.16 | 0.10 | (0.0001) | 15.999% |
ANALYSIS OF GROWTH POTENTIAL
A measure of sustainable growth calculated by multiplying the firm’s return on common equity (ROE) by its retention ratio. It’s denoted by “g”.
Formula:
Sustainable growth (g) = ROE * RR
Retention Rate (RR) = (1-)
ROE =
Year | Dividend | Net Income | Retention Rate | ROE |
2009 | 126.04 | 172371934 | 0.27 | 0.069 |
2008 | 210.06 | 179915587 | 0.88 | 0.076 |
2007 | 138.73 | 130231324 | 0.89 | 0.126 |
Year | 2009 | 2008 | 2007 |
RR | 0.27 | 172371934 | 0.27 |
ROE | 0.069 | 0.076 | 0.126 |
Sustainable Growth (g) | 1.863% | 6.688% | 11.214% |
Interpretation:
Sustainable growth shows the company’s annual growth. We can see that the sustainable growth of Shinepukur Ceramics are 1.863% in 2009, 6.688% in 2008, 11.214% in 2007 which is decrease so company’s sustainable growth is not satisfactory.
FINANCIAL ANALYSIS
RATIO ANALYSIS:
The information contained in the four basic financial statement is of major significance to various interested parties who regularly need to have relative measures of the company’s operating efficiency. Relative is the key word here, because the analysis of financial statements is based on the use of ratios or relative values. Ratio analysis involves methods of calculating and interpreting financial ratios to analyze and monitor the firm’s performance. The basic inputs to ratio analysis are the firm’s income statement and balance sheet.
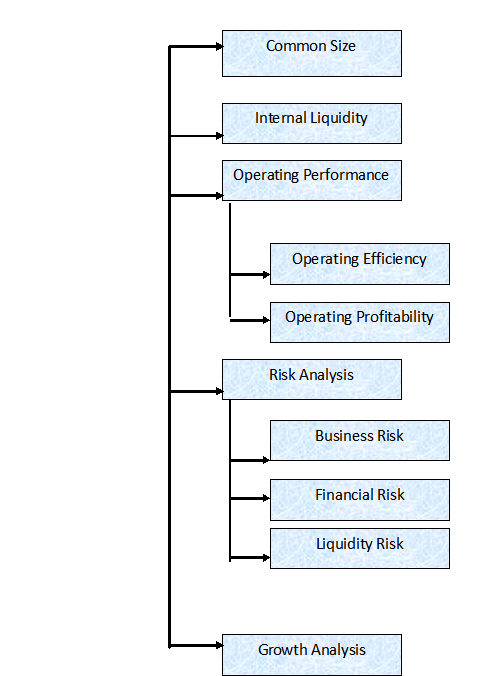
Categories of Financial ratios:
Financial ratios can be divided for covariance into five basic categories, such as:-
- Common Size Statement
- Internal Liquidity (solvency)
- Operating Performance
- Operating Efficiency
- Operating Profitability
- Risk Analysis
- Growth Analysis
1. COMMON SIZE STATEMENT:
“Normalize” balance sheet and income statement items to allow easier comparison of different-size firms. A common-size balance sheet expresses all balance sheet accounts as a percentage of total assets. A common-size income statement expresses all income statement items as a percentage of sales.
Shinepukur Ceramics Ltd Common Size Analysis (Balance Sheet) & (Income Statement) As at 31, December 2009 | |||
Particulars | 2009 | 2008 | 2007 |
| Net Assets: |
|
|
|
| Property plant and equipment | 91.97 | 96.29 | 93.53 |
| Investment in shares | 8.35 | 8.04 | 1.30 |
| Capital work in Progress | 5.50 | 0 | 0 |
| Long term loan | 0 | 8.36 | 0 |
| Current Assets: | |||
| Inventories | 5.50 | 27.51 | 44.14 |
| Trade Debtor | 11.50 | 7.97 | 15.35 |
| Advances & Deposits | 2.62 | 2.67 | 6.10 |
| Cash & Cash equivalents | 0.59 | 0.22 | 0.32 |
| Current Liabilities & Provisions | |||
| Short term loan from Banks | 29.21 | 27.86 | 36.25 |
| Long term loan current maturing | 12.32 | 10.14 | 10.80 |
| Creditors, Accruals & other payables | 3.24 | 3.14 | 4.02 |
| Income tax payable | 3.09 | 1.963 | 3.33 |
| Net current assets | (5.82 | (4.74) | 6.33 |
Total | 100 | 100 | 100 |
Particulars | 2009 | 2008 | 2007 |
% | % | % | |
| Financed By: |
|
|
|
| Shareholder’s equity | 78.91 | 76.44 | 53.98 |
| Share capital | 26.75 | 22.52 | 34.46 |
| Fixed asset revaluation surplus | 43.11 | 43.56 | 10.04 |
| Retained earnings as per statement of changes is equity | 9.05 | 10.35 | 9.47 |
| Non current liabilities: | |||
| Long term loan secured | 15.19 | 23.21 | 45.75 |
| Long term loan | 5.50 | 0 | 0 |
| Differed tax liability | 0.40 | 0.35 | 0.26 |
Total | 100 | 100 | 100 |
Common Size Analysis of profit loss account For the year ended 31, December 2009 | |||
Particulars | 2009 | 2008 | 2007 |
% | % | % | |
| Revenue (turnover) from net sales | 100 | 100 | 100 |
| Cost of Good sold | 67.00 | 67.30 | 67.12 |
| Gross profit | 32.98 | 32.64 | 32.87 |
| Operating Expenses | 5.19 | 5.92 | 5.77 |
| Administrative Expense | 2.26 | 2.58 | 2.07 |
| Selling & Distribution Expense | 2.92 | 3.34 | 3.70 |
| Operating profit | 5.18 | 3.34 | 2.70 |
| Financial Expenses | 12.36 | 12.30 | 14.66 |
| Other Income | 0.0052 | 0.0308 | 0.0301 |
| Net profit before cont. to WPWF | 15.43 | 14.44 | 12.47 |
| Contribution to worker’s participation | 0.73 | 0.68 | – |
| Net profit before tax | 14.59 | 13.75 | 12.47 |
| Income tax expenses | 4.53 | 1.99 | 3.08 |
| Net profit after tax | 10.16 | 11.76 | 9.39 |
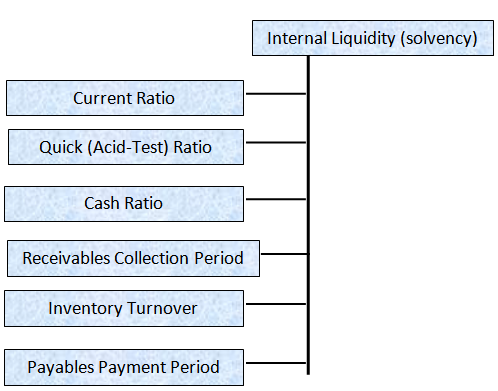
2. Internet Liquidity (solvency):
Liquidity refers to the ability of a firm to meet its short-term financial obligations when and as they fall due. The main concern of the internal liquidity (solvency) ratios indicates the ability of the firm to meet future short-term financial obligations.
Liquidity ratios are divided into following types, such as:-
- Current Ratios
- Quick (Acid-Test) ratio
- Cash Ratio
- Receivables Collection Ratio
- Inventory Turnover
- Payables Payment Period
a. Current Ratio:
A measure of liquidity calculated by dividing the firm’s current assets by its current assents by its current liabilities. Current assets normally include cash, marketable securities, accounts receivable and inventories. Current liabilities consist of account payable, short term notes payable short-term loans, current maturities of long term debt, accrued income taxes and other accrued expenses (wages).
Formula:
Current Ratio:
Particular | 2009 | 2008 | 2007 |
| Current Assets | 1320809490 | 1193107130 | 1263361276 |
| Current Liabilities | 1503775825 | 1340348231 | 1142008842 |
| Total | 0.878328716 | 0.890147129 | 0.111870475 |
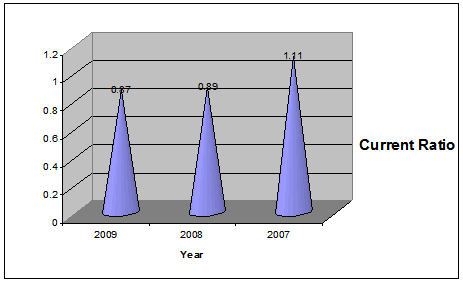
Interpretation:
The standard value for current ratios is 2.1 i.e. for paying tk. 1 current liabilities we have tk. 2 current assets. In case of Shinepukur Ceramic Ltd. We have current ratio for 2007, 2008, 2009 are respectively 0.87, 0.89, 1.11 over the year, it is noticed that the current ratio is decreasing, but still we are in a position of paying our current liabilities by using our current assets i.e. it is acceptable.
b. Quick (Acid-Test) Ratio:
A measure of liquidity calculated by dividing the firm’s current assets minus inventory by its current liabilities. This ratio realizes that some of current assets are not easily convertible to cash e.g. inventories.
The quick ratio, also referred to as acid test ratio, examines the ability of the business to cover its short-term obligations from its “quick” assets only (i.e. it ignores stock).
Formula:
Quick (Acid-Test) Ratio:
Particular | 2009 | 2008 | 2007 |
| Current Assets | 18411470 | 6851977 | 6204407 |
| Inventory | 361541096 | 247899640 | 294189238 |
| Current Liabilities | 1503775825 | 1340348231 | 1142008842 |
| Total | 0.2526656964 | 0.1900637544 | 0.26303968406 |
Interpretation:
The standard value for current ratios is 2.1 i.e. for paying tk. 1 current liabilities we have tk. 2 current assets. In case of our company. We have current ratio for 2007, 2008, 2009 are respectively 0.25, 0.19, 0.26 over the year, it is noticed that the quick ratios of each year are less than standard 1:1 i.e. we are unable to pay out current liabilities by using our current assets. So it is unacceptable.
c. Cash Ratio:
The most conservative liquidity ratio is the cash ratio, which related the firm’s cash and short-term marketable securities to its current liabilities.
Formula:
Cash Ratio:
Particular | 2009 | 2008 | 2007 |
| Cash | 18411470 | 6851977 | 6204407 |
| Current Liabilities | 1320809490 | 1193107130 | 1263361276 |
| Total | 0.013 | 0.0057 | 0.0049 |
Interpretation:
For the year 2007, 2008, 2009 the cash ratio of Shinepukur Ceramics Ltd. are respectively 0.014, 0.006, 0.050. So, it can be said that the company has not enough cash to meet up their current liabilities which is unsatisfactory.
d. Receivables collection period: The average amount of time needed to collect accounts receivable.
The average receivable collection period measures the quality of debtors since it indicates the speed of their collection.
The shorter the average collection period, the better the quality of debtors, as a short collection period implies the prompt payment by debtors.
The average collection period should be compared against the firm’s credit terms and policy to judge its credit and collection efficiency.
An excessively long collection period implies a very liberal and inefficient credit and collection performance.
The delay in collection of cash impairs the firm’s liquidity. On the other hand, too low a collection period is not necessarily favorable, rather it may indicate a very restrictive credit and collection policy which may curtail sales and hence adversely affect profit.
Formula:
Average collection period:
Particular | 2009 | 2008 | 2007 |
| 360 | – | – | – |
| Account receivable turnover | 5.56 | 5.64 | 4.70 |
| Total | 64.69 | 63.77 | 76.44 |
Interpretation:
In the year 2009, 2008, 2007 the average collection period of Shinepukur Ceramics Ltd. are respectively 64.69, 63.77 & 76.44 bill collecting time of them is not in time.
e. Inventory Turnover: This ratio measures the stock in relation to turnover in order to determine how often the stock turns over in the business. It indicates the efficiency of the firm in selling its product. It is calculated by dividing he cost of goods sold by the average inventory.
Formula:
Inventory turnover:
Particular | 2009 | 2008 | 2007 |
| Cost of Goods Sold | 1136510173 | 1030525596 | 930468259 |
| Inventory | 856891425 | 850594114 | 840595049 |
| Total | 1.32 | 1.21 | 1.10 |
Interpretation:
In the year 2009, 2008, 2007 the inventory turnover ratio are respectively 1.32, 1.21, 1.106. So the company is maintaining the liquidity of its inventory in an efficient way.
f. Payables Turnover: The average amount of time needed to pay accounts payable.
Formula:
Payable Turnover:
Particular | 2009 | 2008 | 2007 |
| Cost of Good Sold | 1136510173 | 1030525596 | 1030525596 |
| Average Trade payable | 101895079 | 97671671 | 77127125 |
| Total | 32.73 | 34.59 | 27.32 |
Interpretation:
In the year 2009, 2008, 2007 the payable turnover ratio of Shinepukur Ceramics Ltd. are respectively 32.73,34.59,27.32 that means we are paying our liabilities in time.
3. Operating Performance:
The ratios that indicate how well the management is operating the business can be divided into two subcategories:
a. Operating Efficiency Ratios: Efficiency ratios examine how the management uses its assets and capital, measured in terms of the dollar of sales generated by various asset or capital categories.
This ratio can be divided into three categories. Such as:
i. Total Assets Turnover: Indicates the efficiency with which the firm uses its assets to generate sales. Assets turnover is the relationship between sales and assets.
- The firm should manage its assets efficiently to maximize sales.
- To total assets turnover indicates the efficiency with which the firm uses all its assets to generate sales.
- It is calculated by dividing the firm’s sales by its total assets.
- Generally, the higher the firm’s total asset turnover, the more efficiently its assets have been utilized.
Formula:
Total Assets turnover:
Particular | 2009 | 2008 | 2007 |
| Sales | 1695710571 | 1529918239 | 1386130532 |
| Total Assets | 9117221248 | 8638636962 | 4517370926 |
| Total | 18.59 | 17.71 | 30.68 |
Interpretation:
In the year 2009, 2008, 2007 the total assets turnover ratio respectively 0.19,0.18,0.312 which are lower than the industry average i.e. 0.77. That means the company is not generating sufficient level of business.
ii. Fixed Assets Turnover: The net fixed assets turnover ratio reflects the firm’s utilizations of fixed assets.
Formula:
Fixed Assets turnover:
Particular | 2009 | 2008 | 2007 |
| Sales | 1695710571 | 1529918239 | 1386130532 |
| Total Assets | 2889104937 | 2993818409 | 16792824187 |
| Total | 68.03 | 51.10 | 77.31 |
Interpretation:
In the year 2009, 2008, 2007 the fixed assets turnover ratio respectively 68.03,21.10,77.31 which are lower than the industry average i.e. 1.70. That means our company position on fixed assets is not satisfactory.
b. Operating Profitability Ratios: Profitability ratios analyze the profits-
1. as a percentage of sales and
2. as a percentage of assets and capital employed.
It can be divided into eight categories. Such as: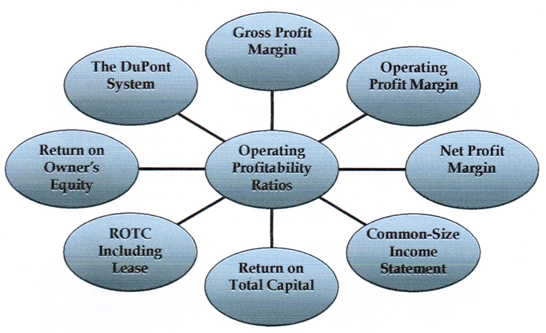
Figure: Types of operating profitability ratios
i. Gross profit margin: Measures the percentage of each sales dollar remaining after the firm has paid for its goods. Normally the gross profit has to rise proportionately with sales. It can also be useful to compare the gross profit margin across similar businesses although there will often be good reasons for any disparity.
Formula:
Gross profit margin:
Particular | 2009 | 2008 | 2007 |
| Gross Profit | 559200398 | 4992392643 | 455662273 |
| Sales | 1695710571 | 1529918239 | 1386130532 |
| Total | 0.329773493 | 0.3264178635 | 0.328729699 |
Interpretation:
In the year 2007, 2008, 2009 the gross profit margin of Shinepukur Ceramics Ltd. are respectively 0.328, 0.326, 0.329 which are higher than the industry average i.e. 0.329. As the gross profit margin by generating mare sales and managing the cost of goods sold.
ii. Operating profit margin: Measure the percentage of each sales dollar remaining after all costs and expenses other than interest, taxes and preferred stock dividends are deducted, the “Pure Profits” earned on each sales dollar.
Formula:
Operating Profit margin:
Particular | 2009 | 2008 | 2007 |
| Operating Profit | 471229138 | 408754864 | 375608183 |
| Sales | 1695710571 | 1529918239 | 1386130532 |
| Total | 0.27789479 | 0.26717431924 | 0.2709760548 |
Interpretation:
In the year 2007, 2008, 2009 the gross profit margin of Shinepukur Ceramics Ltd. are respectively 0.27, 0.267, 0.277 which are higher than the industry average i.e. So, the profitability of the company is satisfactory.
iii. Net profit margin: Measures the percentage of each sales dollar remaining after all costs and expenses, including interest, taxes and preferred stock dividends, have been deducted.
This is a widely used measure of performance and is comparable across companies in similar industries. The fact that a business works on a very low margin need not cause alarm because there are some sectors in the industry that work on a basis of high turnover and low margins, for examples supermarkets and motorcar dealers.
What is more important in any trend is the margin and whether it compares well
Formula:
Net Profit margin:
Particular | 2009 | 2008 | 2007 |
| Earning available for common stockholders | 172371934 | 17991587 | 130231324 |
| Sales | 1695710571 | 1529918239 | 1386130532 |
| Total | 0.1016517423 | 0.1175981712 | 0.093953146 |
Interpretation:
In the year 2009, 2008 & 2007 the net profit margin of Shinepukur Ceramic Ltd. are respectively 0.101, 0.147, 0.093 which are higher than the industry average i.e. – 10.16%. This means that company is successful to generate sufficient amount of profit.
INDUSTRY ANALYSIS:
Shinepukur Ceramics Ltd.
Industry Analysis (2009)
| Ratio | Formula | Shinepukur Ceramics | Industry Average | Evaluation |
Internal Liquidity: | ||||
| Current Ratio | Total current assets/ Total current liabilities | 0.878 | 0.85 | Better |
| Quick Ratio | (Cash+Cash equivalent+Account)/Total current assets | 0.252 | 0.35 | Ok |
| Cash Ratio | Cash+cash equivalent/ Total current assets | 0.014 | 0.06 | Better |
Receivable turnover | Net sales on credit / average account receivable | 5.56 | 13.42 | Worse |
Average receivable collection period | 360/Account receivable turnover | 64.69 | 45.45 | Worse |
Inventory turnover | Cost of goods sold / inventory | 1.33 | 1.26 times | Better |
Payable turnover | Cost of good sold / average trade payable | 11.15 | 11.94 | Ok |
Operating Performance: | ||||
Total assets turnover | Net sales / total assets | 0.19 | 0.77 | Worse |
Net fixed assets turnover | Net sales / Average fixed assets | 0.68 | 1.7 | Worse |
Gross profit margin | Gross profit/nets sales | 32.97% | 55.75% | Ok |
Operating profit margin | Operating income/net sales | 27.78% | 11.02% | Better |
Net profit margin | Net income/Net sales | 10.165% | 8.30% | Better |
SENSITIVITY ANALYSIS
An approach for assassin risk that uses several possible return estimates to obtain a sense of the variability among outcomes.
Here we are analyzing the sensitivity of desiccation to be change in one or many condition. Suppose sales, cost of good sols & financial expenses are increased & decrease 20%.
Sensitivity Analysis of the company by increasing & decreasing the
company’s net sales
Particular | 2009 | 20% increase in sale | 20% decrease in sale |
| Revenue from net sales | 1695710571 | 2034852685 | 1356568456 |
| Cost of Good Sold | 1136510173 | 1136510175 | 1136510173 |
| Gross Profit | 559200398 | 898342512 | 220058283 |
| Operating Expenses: | 87971260 | 87971260 | 87971260 |
| Administration Expense | 38302865 | 38302865 | 38302865 |
| Selling & distribution expense | 49668395 | 49668395 | 49668395 |
| Operating Profit: | 471229138 | 810371252 | 132087023 |
| Financial expense | (209672116) | (209672116) | (209672116) |
| Other Income | 88960 | 88960 | 88960 |
| Net Profit Before Contribution to WPWT | 261645982 | 600788096 | (77496133) |
| Contribution to workers participation | 12459333 | 12459333 | 12459333 |
| Net profit before tax: | 249186649 | 588328763 | (89955466) |
| Income tax expenses | 76814715 | 1764987628 | (26986639) |
| Net Profit After tax transferred to statement of change in equity: | 172371934 | 411830135 | 62968827 |
| EPS: | 2.05 | 2.33 | 2.20 |
Shinepukur Ceramics Ltd.
Profit & Loss Account
as a 31 December 2009 (Cost of Good sold)
Particular | 2009 | 20% increase in sale | 20% decrease in sale |
| Revenue from net sales | 1695710571 | 1695710571 | 1695710571 |
| Cost of Good Sold | 1136510173 | 1363812207 | 909208139 |
| Gross Profit | 559200398 | 331898364 | 786502432 |
| Operating Expenses: | 87971260 | 87971260 | 78471260 |
| Administration Expense | 38302865 | 38302865 | 38302865 |
| Selling & distribution expense | 49668395 | 49668395 | 49668395 |
| Operating Profit: | 471229138 | 243927104 | 698531172 |
| Financial expense | (209672116) | (209672116) | (209672116) |
| Other Income | 88960 | 88960 | 88960 |
| Net Profit Before Contribution to WPWT | 261645982 | 34343948 | 488948016 |
| Contribution to workers participation | 12459333 | 12459333 | 12459333 |
| Net profit before tax: | 249186649 | 33098015 | 476488683 |
| Income tax expenses | 76814715 | 99294045 | 142946604 |
| Net Profit After tax transferred to statement of change in equity: | 172371934 | (66196030) | 3335432078 |
| EPS: | 2.05 | 0.67% | 2.33 |
Shinepukur Ceramics Ltd.
Profit & Loss Account
as at 31 December 2009 Financial Expenses
Particular | 2009 | 20% increase in sale | 20% decrease in sale |
| Revenue from net sales | 1695710571 | 1695710571 | 1695710571 |
| Cost of Good Sold | 1136510173 | 1136510173 | 1136510173 |
| Gross Profit | 559200398 | 559200398 | 559200398 |
| Operating Expenses: | 87971260 | 87971260 | 87971260 |
| Administration Expense | 38302865 | 38302865 | 38302865 |
| Selling & distribution expense | 49668395 | 49668395 | 49668395 |
| Operating Profit: | 471229138 | 471229138 | 471229138 |
| Financial expense | (209672116) | (251606539) | (167737692) |
| Other Income | 88960 | 88960 | 88960 |
| Net Profit Before Contribution to WPWT | 261645982 | 219711559 | 303580406 |
| Contribution to workers participation | 12459333 | 12454333 | 12459333 |
| Net profit before tax: | 249186649 | 207252226 | 291121073 |
| Income tax expenses | 76814715 | 62175667 | 873363321 |
| Net Profit After tax transferred to statement of change in equity: | 172371934 | 1450765458 | 203784751 |
| EPS: | 2.05 | 2.33 | 2.37 |
CROSS SECTIONAL ANALYSIS:
Ratio | formula | shinepukur ceramics ltd |
|
| Monno ceramics |
|
| Cross Section analysis | ||
| Liquidity ratio: | 2009 | 2008 | 2007 | 2009 | 2008 | 2007 | Ok | Ok | Better | |
| Current ratio | Total current asset/Total current liability | 0.87 | 0.89 | 1.11 | 0.93 | 0.94 | 0.93 | Worse | Worse | Worse |
| quick ratio | (Cash+Cash equvalent+Account receivable)/Total current liablities | 0.25 | 0.19 | 0.26 | 1.80 | 1.79 | 1.99 | Worse | Worse | Worse |
| Cash ratio | (Cash+Cash euqvalent)/Total current asset | 0.014 | 0.000006 | .050 | 0.35 | 0.34 | 0.37 | Worse | Better | Better |
| Receivable turnover ratio | Net sale on cradit/Average account receivable | 5.57 | 5.65 | 4.71 | 9.66 | 12.14 | 11.74 | Worse | Better | Better |
| Average receivable collection period | 360/Account receivable turnover | 64.69 | 63.77 | 76.44 | 37.25 | 29.64 | 30.66 | Better | Better | Better |
| Inventory turn over | Cost of goods sold/(Begning inventory+Ending inventory) | 1.326 | 1.211 | 1.106 | 0.25 | 0.30 | 0.26 | Better | Better | Worse |
| Payable turnover | Cost of goods sold/Average trade payable | 11.15 | 10.55 | 13.36 | 10.70 | 9.59 | 20.66 | Better | Better | Worse |
| Total asset turnover | Net sales/Total asset | 0.185 | 0.177 | 0.306 | 0.84 | 1.00 | 0.79 | Worse | Worse | Better |
| Operating performance ratio: | ||||||||||
| Net Fixed asset turnover | Net sales/Average fixed asset | 0.680 | 0.511 | 0.773 | 0.55 | 0.42 | 0.59 | Better | Better | Better |
| Profitability indicator ratio: | ||||||||||
| Gross margin | Gross profit/Net sales | 32.97% | 32.64% | 32.87% | 20.77% | 18.23% | 21.23% | Better | Better | Better |
| Operating profit margin | Operating income/Net sales | 27.78% | 26.71% | 27.09% | 13.30% | 12.11% | 14.10% | Better | Better | Better |
| profit margin | Net income/Net sales | 10.165% | 11.75% | 09.39% | 13.20% | 57.37% | (40.13%) | OK | Worse | Better |
TIME SERIES ANALYSIS:
Ratio | Formula | Year | ||||
Liquidity ratio: | 2009 | 2008 | 2007 | 2006 | 2005 | |
| Current ratio | Total current asset/Total current liability | 0.87 | 0.89 | 1.11 | 0.111 | 1.21 |
| quick ratio | (Cash+Cash equvalent+Account receivable)/Total current liablities | 0.25 | 0.19 | 0.26 | 0.28 | 0.28 |
| Cash ratio | (Cash+Cash euqvalent)/Total current asset | 0.0139 | 0.0057 | 0.0502 | 0.0106 | 0.0149 |
| Receivable turnover ratio | Net sale on cradit/Average account receivable | 5.56481 | 5.6445 | 4.7095 | 4.9736 | 5.6395 |
| Average receivable collection period | 360/Account receivable turnover | 64.69 | 63.77 | 76.44 | 72.34 | 63.83 |
| Inventory turn over | Cost of goods sold/(Begning inventory+Ending inventory) | 1.326 | 1.2116 | 1.1069 | 1.1417 | 1.1796 |
| Payable turnover | Cost of goods sold/Average trade payable | 11.1537 | 10.5509 | 13.3613 | 12.5670 | 14.406 |
| Total asset turnover | Net sales/Total asset | 0.1859 | 0.1771 | 0.3068 | 0.2239 | 0.2180 |
| Operating performance ratio: | ||||||
| Net Fixed asset turnover | Net sales/Average fixed asset | 0.6803 | 0.511 | 0.3773 | 0.756 | 0.7054 |
| Profitability indicator ratio: | ||||||
| Gross margin | Gross profit/Net sales | 32.97% | 32.64% | 32.87% | 32.86% | 32.74% |
| Operating profit margin | Operating income/Net sales | 27.78% | 26.71% | 27.09% | 26.54% | 26.48% |
| profit margin | Net income/Net sales | 10.165% | 11.75% | 09.39% | 08.53% | 10.1786% |
RISK ANALYSIS OF SHINEPUKUR CERAMICS LTD:
Risk analysis examines the uncertainty of income for the firm and for an investor.
Total firm risks can be decomposed into two basic source:
- Business risk: The uncertainty in a firm’s operating income, highly influenced by industry factors.
- Financial risk: The added uncertainty in a firm’s net income resulting from a firm’s financing decisions (primarily through employing leverage).
- Liquidity Risk: It considers another aspect of risk from an investor’s
Business Risk:
Variability of the firm’s operating income over time. It can be measured by calculating the standard deviation of operating income over time or the coefficient of variation. In addition to measuring business risk, we want to explain its determining factors. Two primary determinants of business risk.
Sales variability
- The main determinant of earnings variability
Cost variability and operating leverage
- Production has fixed and variables costs
- Greater fixed production costs cause greater profit volatility with changes in sales.
- Fixed costs represent operating leverage
Greater operating leverage is good when sales are high and increasing, but bad when sales fall.
Business risks =
| 14.26% |
Operating Leverage
| 1.44 |
Financial Risk
Interest payments are deducted before we get to net income, these are fixed obligations. Similar to fixed production costs, these lead to large earning during good times, and lower earnings during a business decline, fixed financing costs are called financial leverage. The use of debt financing increasing financial risk and possibility of default while increasing profitability when sales are high. Two sets of financial ratios help measures financial risk
- Balance sheet ratios
- Earnings or cash flow available to pay fixed financial charges.
Acceptable levels of financial risk depend on business risk. A firm with considerable business risk should likely avoid lots of debt financing.
Proportion of debt (balance sheet) ratios:
Long-term debt can be related to equity (l-t D/Equity) how much debt does the firm employee in relation to its use of equity? And total capital [L-t D/(L-t D+ Equity)] How much debt does the firm employ in relation to all long-term sources of funds.
Debt to Equity Ratio=
2007 | 2008 | 2009 |
7.19 | 8.07 | 7.88 |
Total Long term capital ratio:
Debt to Equity Ratio=
2007 | 2008 | 2009 |
0.30 | 0.33 | 0.26 |
Total Debt Ratio=
2007 | 2008 | 2009 |
0.50 | 0.51 | 0.60 |
Comments:
In the year 2009 company’s debt ratio is 0.60 this value indicates that the company his financed more than half of its assets with debt. The higher this ratio greater the firms degree of indebtedness and the more finance leverage it has. In 2008 this ratio his increased to a level of 61% because the company has increase its capacity by buying some fixed assets which is from long term liability, not by issuing new share.
Earning Flows Ratio:
It is Relate operating income (EBIT) to fixed payments required from debt obligations, higher ratio means lower risk.
Interest Coverage or Times interest Earned Ratio Measures the number of times interest payments are “covered” by EBIT interest coverage = EBIT / Interest Expenses. May also want to calculated coverage ratios that reflect other fixed charges lease obligations (fixed charge coverage).
Interest Coverage =
2007 | 2008 | 2009 |
1.44 | 2.23 | 1.91 |
Comments:
A ratio of 2 is appropriate for the company, so we can see that the company is good at 2008, but not good enough in 2007 and 2009.
Cash flow ratios:
Fixed financing costs such as interest payment musts be paid in cash, so these ratios use cash flow rather than EBIT to assess the ability to meet these obligations, relate the flow of cash available from operations to:
Interest expense
Total fixed expenses
The face value of outstanding debt
Cash flow coverage of fixed financial
Cost =
2007 | 2008 | 2009 |
3.97% | 10.45% | 17.16% |
Comments:
Cash flow is used determine whether a borrower is going to be able to service interest payment on a loan. Generally lender prefers a cash flow ratio more than 1. Here we can see that the cash flow ratio of Shenpukur Ceramics Ltd. in 2007 was 3.97 and it increase 10.45 in 2008. and decrease in 2009 17.16%.
Liquidity Risk
Market liquidity is the ability to buy or sell an asset quickly with little price change from a prior transaction assuming no new information. External market liquidity is a source of risk to investors. The most important factor of external market liquidity is the dollar value of share traded. This can be estimated from the total market value of outstanding securities. It will be affected by the number of security owners. Numerous buyers and sellers provide liquidity.
DUPONT SYSTEM:
The DuPont system of analysis is used to dissect the firm’s financial statements and to assess its financial condition. It merges the income statement and balance sheet into two summery measures of profitability: return on total assets (ROA) and return on common equity (ROE).
The importance of ROE as an indicator of performance makes it desirable to divide the ratio into several components that provide insights into the causes of a firm’s ROE or any changes in it. This breakdown of ROE into component ratios is generally referred to as DuPont System.
To begin, the return on equity (ROE) ratio can be broken down into two ratios that we have discussed- net profit margin and equity turnover.
Net Income Net Income Net Sales
ROE= = x
Common Equity Net Sales Common Equity
This breakdown is an identity because have both multiplied and divided by net sales. To maintain the identity, the common equity value used is the year-end figure rather than the average of the beginning and ending value. This identity reveals that ROE equals the net profit margin times the equity more efficiency (increasing its equity turnover) or by becoming more profitable (increasing its net profit margin).
As noted previously, a firm’s equity turnover is affected by its capital structure. Specifically, a firm can increase its equity turnover by employing a higher proportion of debt capital. We can see this effect by considering the following relationship:
Net Sales Net Sales Total Assets
= x
Equity Total Assets Equity
Similar to the prior breakdown, this is an identity because we have both multiplied and divided the equity turnover ratio by total assets. This equation indicates that the equity turnover ratio equals the firm’s total asset turnover (a measure of efficiency) times the ratio of total assets to equity, a measure of financial leverage. Specifically, this latter ratio of total assets to equity indicates the proportion of total assets financed with debt. All assets have to be financed by either equity or some from of debt (either current liabilities or long-term debt).
Therefore, the higher the ratio of assets to equity, the higher the proportion of debt to equity.
Combining these two breakdowns, we see that a firm’s ROE is composed of three ratios as follows:
Net Income Net Income Net Sales Total Assets
= x x
Common Equity Net Sales Total Assets Common Equity
| Year | Sales/Total Assets (Times) | Net profit/Sales | Returnon Total Assets | TotalAssets/Equity | Return OnEquity |
| 2007 | 0.3068 | 9.39% | 4.26 | 2.96 | 1.26 |
| 2008 | 0.1771 | 11.59% | 4.04 | 1.88 | 7.57 |
| 2009 | 0.1859 | 10.16% | 3.71 | 1.87 | 6.95 |
CONCLUDING PART
FINDINGS:
In this part we are going to discuss the findings of Shinepukur Ceramics ltd. I observed the total financial operations very carefully and my findings are as follows:
- 1. Shareholders equity: Shinepukur Ceramics Ltd. is a satisfactory capital based ceramics company in Bangladesh wit authorized capital position of Tk.5000000000 and paid up capital 660600000.
- 2. Liquidity management: For analyzing the liquidity management of the company it can be used current ratio, quick ratio, cash ratio those are respectively 0.88, 0.252, 0.012 which is above the industry average. The current liability of Shinepukur Ceramics is rising tin the current asset. So we can say that the company is not only in a risky position but also facing financial distress and will unable to met its short turn obligation in near future.
- 3. Inventory Mgt.: By calculating inventory turnover ratio we can measure inventory management system of Shinepukur Ceramic Ltd. It is very productive and maintain liquidity of its inventory in a efficient way that has directly affected the company’s profit. The industry average of the inventory turnover ratio is 1.26 times where as company’s inventory turnover ratio is 1.33.
- 4. Collection Efficiency: For calculating average receivable collection period it can be said that after making sales company have to wait more than 65 days that means the customer are not paying their bill in time and have not good control on its collection period. Because industry average of account receivable collection period is 46 days.
- 5. Payment Efficiency: Payment efficiency can be measured by payable turnover ratio which is 11.15. Comparing with industry average it can be said that company takes average time or paying the accounts payable.
- 6. Asset structure: For measuring the assets structure of company need to analysis total assets turnover ratio, net fixed assets turnover ratio. Which are bellow the industry average Shinepukur Ceramics Ltd. does not have sufficient assets to support the financial operations.
- 7. Financing Strategy: Company is different on its financing strategy. Shinepukur Ceramics Ltd. uses more debt than the other firm. For analyzing company’s financial strategy I used total debt ratio, debt to equity ratio.
- 8. Company’s Earning: Company has good profit margin. For calculating company’s earning I use gross profit margin ratio, operating profit margin ratio, net profit margin ratio which are 32.97%, 27.78%, 10.165% which are above industry average.
- 9. Cost of Production: Cost of production increased due to increases in the price of raw materials chemicals and packing materials in the international market.
RECOMMENDATION:
By observing the whole operation of Shinepukur Ceramic Ltd. I can say that shinepukuer ceramics ltd is quite good. I can recommend the following functions that can improve their position.
They must increase their proportion of asset than the liabilities. Because the current ratio of the company are decreasing day by day which I get from time series analysis.
Company had to increase their sales for development though sales are increasing day by day but net profit margin and operating profit margin ratio is not satisfactory.
Company can introduce new product line of improve quality product.
Company should reduce their production cost to increase their profit because there gross profit margin ratio is not satisfactory.
Company has satisfactory average collection period so it need to keep it up.
CONCLUSION:
It is quite obvious that to achieve the desired goals of being fully compliant with the requirements for the regulated countries, the Bangladesh Government, or more specifically the ceramics Directorates would have to subscribe to some of these change. They have an obligation to ensure high quality tableware product are produced for the domestic market but also products that are exported meet the international standards certainly a great deal of harmonization is need amongst the teaching institution, the trade associations and the government regulatory agencies, such as ceramics directorate to bring about this change. For Bangladeshi ceramics firms to be successful in the US they would need to differentiate themselves to the relation by consistency of product and supply, distribution and logistics, capabilities and the pipe line of the future products. Probably the quickest and most economic way for the Bangladeshi companies to enter the regulated market is to develop alliance or partnership with US companies that are trying to maximize their development effort in a timely manner.

Some are parts:
Financial Performance of Shinepukur Ceramics Ltd (Part 1)
Financial Performance of Shinepukur Ceramics Ltd (Part 2)