Square Pharmaceuticals Ltd. was incorporated on 1964 as a Pharmaceuticals company. In present Square Pharmaceuticals Ltd. (SPL) is one of the most successful Pharmaceuticals companies among all the private Pharmaceuticals Companies in Bangladesh.
This report is prepared as a requirement of the internship program focused on specially “Analysis of Financial Soundness” of Square Pharmaceuticals Ltd. (SPL). I have divided this report in six major parts. First part is Introduction, where prologues, Objectives of the study, Research methodology of the study and Limitations of the study have been presented. Second part is Overview of Square Pharmaceuticals Limited consisits of Annual Report 2010 of Square Pharmaceuticals Limited, Corporate History, Vision, Mission, Objectives, Corporate Focus, Management Apparatus, Strive, Ten Principles, Corporate Oprational Results. Third part is Financial Soundness Analysis, where Definition of Financial Soundness Analysis, Definition of Ratio Analysis, Time-Series Techniques, Cross Sectional Techniques, Liquidity Ratio, Activity Ratio, and Debt Management Ratio & Profitability Ratio have been discussed. Fourth part is Results of Financial Ratios of SPL & their Interpretation, where Financial Soundness of SPL has been discussed with the help of ratio analysis and graph. Fifth part is Findings, where Short Term Financial Strength, Long Term Financial Strength & Efficiency of Profitability have been presented. And the last and Sixth part consists of Recommendation, Conclusion and References.
Financial soundness measure is an effective used tool in measuring a company’s strength and weakness. Various types of tools are generally used in this regards. This study has taken an effort in order to assess the financial soundness of Square Pharmaceuticals Ltd. to pinpoint its probable strength and weakness.
Objectives of the Study:
The main purpose of this report is to analysis the financial position of the Square Pharmaceuticals Ltd.
To fulfill the main objectives the subsequent objectives are-
- To identify the financial soundness of the Square Pharmaceuticals Ltd.
- To focus the financial strengths and weaknesses of the Square Pharmaceuticals Ltd.
- To identify the net sales Square Pharmaceuticals Ltd.
- To know the total debt of the Square Pharmaceuticals Ltd.
- To know the liquidity of the Square Pharmaceuticals Ltd.
Research Methodology of the Study:
The study was designed from descriptive point of view. The report is prepared by using secondary data. Different books, articles, annual reports and websites were used as sources for secondary data collection.
Limitations of the Study:
There are some limitations in my study. I have faced some problems during the study of internship report, which are as follows-
- Time insufficient to know all activities about the Square Pharmaceuticals Ltd.
- Scarcity of information about the Square Pharmaceuticals Ltd.
- Inexpertness to write a report.
I have tried my level best to make this report a true, bias-free and informative one. I hope that it will provide an original picture of Square Pharmaceuticals Ltd.
Square Pharmaceuticals Limited, Annual Report 2010:
Annual Report of Square Pharmaceuticals Limited is a very useful report for analysis of its financial performance. This report explained about financial strength. Customer service, risk management, corporate social responsibility, and good governance. Director’s Report section explained the global economy and Bangladesh economy. This report tried to accumulate all the relevant data and topics regarding financial performance. This report would be very helpful and handy for potential investors and policy makers.
This report also explained different accounting policies and depth analysis of financial position. In addition to that, it discuss about the industry performance. It also tells us about the trend of financial performance. In addition to that, emphasis is given on that information that creates positive impression about the company and the information in their own way.
Vision
We view business as a means to the material and social wellbeing of the investors, employees and the society at large, leading to accretion of wealth through financial and moral gains as apart of the process of the human civilization.
Mission
Our Mission is to produce and provide quality & innovative healthcare relief for people, maintain stringently ethical standard in business operation also ensuring benefit to the shareholders, stakeholders and the society at large
Objectives:
Our objectives are to conduct transparent business operation based on market mechanism within the legal & social frame work with aims to attain the mission reflected by our vision.
Corporate Focus:
Our vision, our mission and our objectives are to emphasize on the quality of product, process and services leading to growth of the company imbibed with good governance practices
MANAGEMENT APPARATUS:
BOARD OF DIRECTORS
Mr. Samson H. Chowdhury Chairman
Mr. Samuel S. Chowdhury Vice Chairman
Mr. Tapan Chowdhury Managing Director
Dr. Kazi Harunar Rashid Director
Mr. M. Sekander Ali Independent Director
Ms. Ratna Patra Director
Mr. Anjan Chowdhury Director
Mr. Kazi Iqbal Harun Director
Mr. K. M Saiful Islam Director
AUDIT COMMITTEE
Mr. M. Sekander Ali Chairman
Mr. Samuel S. Chowdhury Member
Mr. Kazi Iqbal Harun Member
MANAGEMENT COMMITTEE
Mr. Tapan Chowdhury Chairman
Mr. K M Saiful Islam Member
Mr. Parvez Hashim Member
Mr. M. Ashiqul Hoque Chawdhury Member
Mr.Md. Kabir Reza, FCMA Member
WE STRIVE FOR:
We in SQUARE, strive, above all, for top quality health care products at the least cost reaching the lowest rungs of the economic class of people in the country. We value our social obligations.
We owe our shareholders and strive for protection of their capital as well as ensure highest return and growth of their assets.
We strive for best compensation to all the employees who constitute the back-bone of the management and operational strength of the company through a pay-package composing salary/wages, allowances, bonuses, profit participation, leave salary and superannuation & retirement benefits.
We strive for the best co-operation of the creditors & debtors the banks & financial Institutions who provide financial support when we need them, the suppliers of raw materials & suppliers who offer them at the best prices at the opportune moments, the providers of utilities-power, gas & water etc. and the customers who buy our products & services by redeeming their claim in time by making prompt payment and by distributing proper product on due dates to our customers.
We strive for fulfillment of our responsibility to the government through payment of entire range of due taxes, duties and claims by various public agencies like municipalities etc.
We strive, as responsible citizen, for a social order devoid of malpractices, anti-environmental behaviours, unethical and immoral activities and corruptive dealings.
We strive for practicing good-governance in every sphere of activities covering inter alia not being limited to, disclosure & reporting to shareholders, holdin
AGM in time, distribution of dividends and other benefits to shareholders, reporting/dissemination of price sensitive information, acquisition of shares by insiders, recruitment & promotion of staff, procurement & supplies, sale of assets etc. all that directly and indirectly affect the interest of concerned groups – the shareholders, the creditors, suppliers, employees, government and the public in general.
We strive for equality between sexs, races, religions and regions in all spheres of our operation without any discriminatory treatment.
Ten Principles of Global Compact (UN) adopted by Square Pharmaceuticals Limited:
The ten principles of Global Compact initiated by the UN Secretary General as have been adopted by Square Pharmaceuticals Ltd. are as follows :
Human Rights:
Businesses should support and respect the protection of internationally proclaimed human rights within their sphere of influence; and
Make sure that they are not complicit in human rights abuses.
Labor Standards:
Businesses should uphold the freedom of association and the effective recognition of the right to collective bargaining;
The elimination of all forms of forced and compulsory labor;
The effective abolition of child labor and
Eliminate discrimination in respect of employment and occupation
Environment:
Business should support a precautionary approach to environmental challenges:
Undertake initiatives to promote greater environmental responsibility; and
Encourage the development and diffusion of environmentally friendly technologies.
Ethical Standards:
Business should work against corruption in all its forms, including extortion and bribery.
CORPORATE OPERATIONAL RESULTS (Figure in thousand)
| 2009-10 | 2008-09 | 2007-08 | 2006-07 | 2005-06 | |
| Turnover (Gross) | 13279142 | 11366598 | 9565716 | 8711035 | 7085553 |
| Turnover (Net) | 11462578 | 9820797 | 8257844 | 7500811 | 6089905 |
| Gross Profit | 4901290 | 4148231 | 3401782 | 3232364 | 2564503 |
| Net Profit before Tax | 2825069 | 2511259 | 1868634 | 1722906 | 1533043 |
| Net Profit after Tax | 2087872 | 1890053 | 1381863 | 1303243 | 1165865 |
| Net Assets Value | 11554380 | 9949398 | 8417041 | 7333258 | 6402015 |
| Total Assets | 15029500 | 13251243 | 12703127 | 10486940 | 9298987 |
| Total Bank Borrowing | 2231167 | 2279694 | 3569280 | 2536524 | 2334925 |
| Total Current Assets | 4774311 | 3843513 | 4411836 | 3682511 | 4031685 |
| Total Current Liabilities | 2216744 | 2640869 | 3500845 | 2555566 | 2260755 |
| Current Ratio | 2.15 | 1.46 | 1.26 | 1.44 | 1.78 |
| No. of Share Outstanding | 15090300 | 12072240 | 8942400 | 5961600 | 4968000 |
| Dividend per Share (Cash) | 35 | 40 | 40 | 50 | 75 |
| Dividend per Share (Stock) | 30% | 25% | 35% | 50% | 20% |
| Net Assets Value per Share (NAV) | 766 | 659 | 558 | 486 | 424 |
| Net Operating Cash flow per Share | 176.51 | 164.87 | 86.20 | 96.08 | 78.80 |
| Earnings per Share (SPL) | 138.36 | 125.25 | 91.57 | 86.36 | 77.26 |
| Earnings per Share (SPL) | 165.48 | 136.40 | 101.10 | 96.63 | 89.76 |
| EPS at Original Capital at IPO | 1043.94 | 945.03 | 690.93 | 651.62 | 582.93 |
| Quoted Price per Share – DSE | 3581 | 2935 | 4110 | 2447 | 2276 |
| Quoted Price per Share -CSE | 3597 | 2923 | 4107 | 2462 | 2289 |
| Price Earning Ratio- DSE (Time) | 25.88 | 23.43 | 44.88 | 28.33 | 29.46 |
| Number of Shares | 40797 | 47258 | 31688 | 13009 | 13206 |
Human Resources
Executives 19091786152512421143Staff125910841110913796Workers1029941929846764
Definition of Financial Soundness Analysis:
Financial Soundness Analysis includes the study of relationships within a set of financial statement at a point in time and with trends in these relationships over time.
Definition of Ratio Analysis:
Ratio analysis expresses the relationship among selected items of financial statement data. A ratio expresses the mathematical relationship between one quantity and another.
Techniques to measures Financial Soundness Analysis
Times-Series Techniques:
Trend Statements:
Constructing trend statements involves choosing one year as a base & then expressing the statement items of subsequent years relative to the value in the base year.
Cross Sectional Techniques:
Two techniques used to measure financial soundness-
- Common-size Statement
- Financial Ratio Analysis
Common-size Statement:
One impetus to the development of the common-size statement came from the problems in comparing the financial statements of firms that differ in size.
Financial Ratio Analysis:
The most widely discussed the financial technique is a comparison of ratio across firms. Numerous individual ratios have been proposed in the literature.
The Four Categories of Financial Ratio Analysis are as follows-
- Liquidity Ratios
- Activity Ratios
- Debt management Ratios
- Profitability Ratios
Liquidity Ratios:
The ratios that show the relationship of the firm’s current assets to its current liabilities are known as liquidity ratios. It measures the firm’s ability to satisfy its short term obligation as they come due.
Some representatives of Liquidity Ratios are as follows-
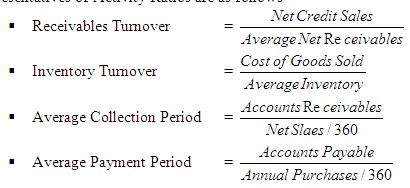
Activity Ratios:
The ratios that measure how effectively a firm is managing its assets are called activity ratios.
Some representatives of Activity Ratios are as follows-
Debt Management Ratio/Financial Leverage:
The ratios that measure the ability of the firm’s long term financial solvency are called debt management ratios. Long term creditors and stockholders are particularly interested in a company’s ability to pay interest as it comes due and to repay the face value of debt at maturity.
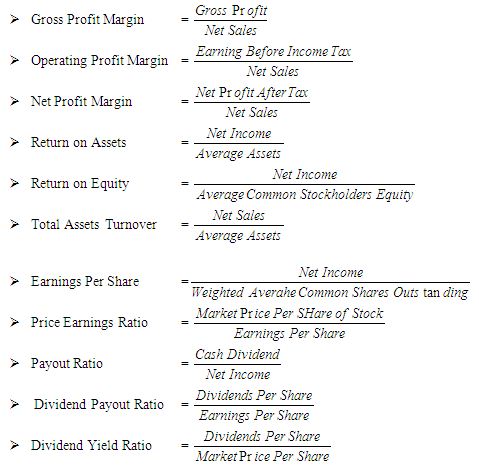
Profitability Ratios:
A group of ratios showing the effect of liquidity, assets, management and debt management on firm’s operation are called profitability ratios.
Some representatives of Profitability Ratios are as follows-
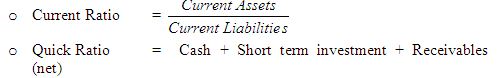
Current Ratio:
The current ratio is widely used measure for evaluating a company’s liquidity and short term debt paying ability. Current Ratio indicates the extent to which current liabilities are converted by current assets. The ratio is computed by dividing current assets by current liabilities.
Current Ratio
CR in 2008 = 4,411,836,436/3,500,845,103 = 1.2602
CR in 2009 = 3,843,512,855/2,640,868,554 = 1.4554
CR in 2010 = 4,774,311,194/2,216,744,401 = 2.1537
Quick Ratio/Acid Test:
Quick ratio or Acid test measures the company’s immediate short term liquidity. The acid test is designed to measure how well a company can meet its obligation without having to liquidate or depend too heavily on its inventory. It is computed by dividing the sum of cash, short term investment and net receivables by current liabilities.
Quick Ratio/Acid Test = Cash + Short term investment + Receivables (net)
QR in 2008 = (205,295,694+20,250,000+360,245,646)/3,500,845,103 = .16733
QR in 2009 = (293,457,740+20,250,000+477,562,002)/2,640,868,554 = .29962
QR in 2010 = (258,727,695+221,269,226+508,249,174)/2,216,744,401 = .44580
Receivables Turnover:
The Receivables Turnover is a rough measure of how many times a company’s accounts receivable have been turned into cash during the year. The ratio is used to assess the liquidity of the receivables. It is computed by dividing net credit sales by average net receivables.
Receivables Turnover
RT in 2008 = = 24.177 times or 14 days (360/24.177)
RT in 2009 = = 23.444 times or 15 days (360/23.444)
RT in 2010 = = 23.255 times or 15 days (360/23.255)
Inventory Turnover:
Inventory Turnover ratio measures how many times a company’s inventory has been sold and replaced during the year. Its purpose is to measure the liquidity of the inventory. It is computed by dividing cost of goods sold by the average inventory.
Inventory Turnover =
IT in 2008 = = 2.710 times or 133 days (360/2.710)
IT in 2009 = = 2.750 times or 131 days (360/2.750)
IT in 2010 = = 3.048 times or 118 days (360/3.048)
Average Collection Period:
Average Collection Period measures average amount of time needed to collect accounts receivable.
Average Collection Period
ACP in 2008 = = 16 days
ACP in 2009 = = 17 days
ACP in 2010 = 16 days
Average Payment Period:
Average Payment Period measures the average amount of time needed to pay accounts payable.
Average Payment Period
APP in 2008 = = 8 days
APP in 2009 = = 9 days
APP in 2010 = = 27 days
Debt Ratio:
Debt ratio measures the proportion of total assets financed by firm’s creditors. This ratio indicates the company’s degree of leverage. It also provides some indication of the company’s ability to withstand losses without impairing the interest of creditors. It is computed by dividing total debts by total assets.
Debt Ratio
DT in 2008 = = .33740 or 33.740%
DT in 2009 = = .24917 or 24.917%
DT in 2010 = = .23121 or 23.121%
Gross Profit Margin:
Gross Profit Margin measures gross income per TK. of sales. It is computed by dividing gross profit by net sales.
Gross Profit Margin
GPM in 2008 = = .41194 or 41.194%
GPM in 2009 = = .42239 or 42.239%
GPM in 2010 = = .42759 or 42.759%
Operating Profit Margin:
Operating Profit Margin measures operating income per TK. of sales. It is computed by dividing earning before income tax by net sales.
Operating Profit Margin
OPM in 2008 = = .22629 or 22.629%
OPM in 2009 = = .25570 or 25.570%
OPM in 2010 = = .24646 or 24.646%
Net Profit Margin:
Net Profit Margin measures the net income per TK. of sales. It is computed by dividing net profit after tax by net sales.
Net Profit Margin =
NPM in 2008 = = .16733 or 16.733%
NPM in 2009 = = .19245 or 19.245%
NPM in 2010 = = .18215 or 18.215%
Return on Assets (ROA):
Return on Assets (ROA) provides as idea of the overall return on investment earned by the firm. This ratio is computed by dividing net income by average assets.
Return on Assets
ROA in 2008 = = .11918 or 11.918%
ROA in 2009 = = .14564 or 14.564%
ROA in 2010 = = .14765 or 14.765%
Return on Equity (ROE):
Return on Equity (ROE) measures the rate of return on common stockholders investment. It measures profitability from the common stockholders viewpoint. This ratio shows how many tk. of net income were earned for each tk. invested by the owner. It is computed by dividing net income by average common stockholders equity.
Return on Equity
ROE in 2008 = = .17547 or 17.547%
ROE in 2009 = = .20582 or 20.582%
ROE in 2010 = = .19419 or 19.419%
Total Assets Turnover:
Total Assets Turnover indicates the efficiency with which the firm uses its assets to generate sales. It is determined by dividing net sales by average assets.
Total Assets Turnover
TAT in 2008 = = .71218 or 71.218%
TAT in 2009 = = .75677 or 75.677%
TAT in 2010 = = .81062 or 81.062%
Earnings per Share (EPS):
An Earnings per Share (EPS) is a measure of net income earned on each share of common stock. It is computed by dividing net income by the number of weighted average common shares outstanding.
Earnings per Share
EPS in 2008 = = 154.53
EPS in 2009 = = 179.87
EPS in 2010 = = 153.73
Short Term Financial Strength:
Company’s liquidity position has been increased in 2010 than previous two years. Current Ratio & Quick Ratio have been increased. Inventory Turnover has been increased in 2010 than previous two years. Average Collection Period has been decreased than previous years. But Receivables Turnover has been decreased than previous two years. It means the Receivables Turnover is not good but current capital management has been developed. So the company should give more emphasize to improve the receivables turnover.
Long Term Financial Strength:
The financial performance of Square Pharmaceuticals Ltd. is good in 2010 than previous two years. The Debt Ratio of SPL has been declined in 2010 than previous years. So the company’s long term debt payment power has been increased.
Efficiency of Profitability:
The Profitability Ratio of Square Pharmaceuticals Ltd. is in a stable position. Although some of them has been decreased. Gross Profit Margin, Return on Assets, Asset Turnover & Payout Ratio have been increased in 2010. On the other hand, Operating Profit Margin, Net Profit Margin, Return on Equity, Earnings per Share, Dividend Yield Ratio and Dividend Payout Ratio have been reduced in 2010. It means the company is not utilizing its assets in a proper way. So the company should give more attention to increase their profit for the next year.
Recommendation:
To strength the financial soundness in those areas where the Square Pharmaceuticals Ltd. needs to improve, the following suggestive measures are recommended-
- The company should give more attention to improve efficiency in utilizing the capital.
- The company should give more attention on how to effectively manage its cost and revenue mixes.
- The company should give more emphasizes in making the investment decision in a much better way.
Conclusion:
The financial soundness picture of Square Pharmaceuticals Ltd. shows that it has performed better in different specific aspects like short term and long term debt payment. However it has yet some financial and operating areas like profitability where those need much attention to be given. It can consider same actions recommended to improve its financial performance in the years to come.