Introduction
Berger Paints Bangladesh Limited (BPBL) is a renowned paint company in Bangladesh. The Company was introduced on 6 June 1973 as a private co. limited by shares registered under the Company Act. In December 2005, the company issued 5% shares to the public and listed with Dhaka Stock Exchange (DSE) and Chittagong Stock Exchange (CSE). BPBL previously was known by Jenson & Nicholson (J & N). The name of the company was changed from J& N (Bangladesh) Limited to Berger Paints Bangladesh Limited on January 1, 1980. Currently BPBL’s number of shares is 23,188,940. Its Authorized capital is Taka 400 million and its paid up capital is Taka 232 million.
Historical Overview
Berger, the market leader in the Bangladesh paint market is one of the oldest names in the paint Industry and the country’s major specialty paints business with products and ingredients dating back more than 249 years to 1760. Louis Berger, a Germen national founded dye and pigment making business in England. Louis Berger and sons grew rapidly with a strong reputation for innovation and entrepreneurship culminating in perfecting the process of making Prussian blue, a deep blue dye- a colour widely used for the uniforms of many European Armies. Production of dyes and pigments evolved into production of paints and coating, which till today, remains the core business of Berger. The company grew rapidly by establishing branches all over the world and through mergers and acquisitions with all other leading paint and coating manufacturing companies.
Berger has been involved in the paint business in this part of the world since 1950, when paints were first imported from Berger UK and subsequently from Berger Pakistan. In 1970, Berger paints Bangladesh limited (BPBL), erstwhile Jenson and Nicholson, had set up its paint factory in Chittagong at an estimated investment of TK 4 million. The share holders were Jenson & Nicholson (J & N), Duncan McNeil & Co. Limited and Dada Group. Duncan McNeil subsequently sold their shares to the majority shareholder J&N group. The Dada group share was ultimately vested with the government of the Peoples’ Republic of Bangladesh after the independence of the country in 1971. The name of the company was changed from J& N (Bangladesh) Limited to Berger Paints Bangladesh Limited on January 1, 1980.In August 2000, J& N Investment (Asia) Limited purchased Government shareholding. In December 2005, the company issued 5% shares to the public and listed with Dhaka Stock Exchange (DSE) and Chittagong Stock Exchange (CSE).
With the entry of Berger paints into Bangladesh market, the country has been able to benefit from more than 249 years of global paint industry experience. Over the decades, Berger has evolved to become the leading paint solutions provider in this country and has diversified into every sphere of the industry-from Decorative Paints to Industrial, Marine and Powder Coatings.
Berger is one of the leading companies in the global paint industry. They offer all kind of painting solution in decorative, industrial or marine segment for both decorative and protective purpose. Berger paint started its sailing into the sea of Bangladesh from pre liberation era, to be precise in 1950.the main business flourished in the post liberation phase. In Bangladesh the major milestone of Berger paints are given below:
- 1950 – Started operation in Bangladesh by Importing paint from Berger UK
- 1970 – Establishment of Chittagong Factory
- 1980 – Named as Berger paints (BD) Ltd from Jenson & Nicholson (J&N)
- 1991 – BMRE in Chittagong Factory
- 1995 – Establishment of Double Tight Can Manufacturing Plant
- 1999 – Establishment of Most modern State-of-the-art Paint Production Plant in Dhaka
- 2002 – Construction of own building for Corporate office in Dhaka
- 2004 – Establishment of Powder Coating Plant
Business Overview
Berger has invested more in technology and Research & Development (R &D) than any other manufacturer in this market. It sources raw materials from some of the best known names in the world: MITSUI, MOBIL, DUPONT, HOECHST and BASF, to name a few. The superior quality of Berger’s products has been possible because of its advance plants and strictly quality controls equal to the best international standards. Investment in technology and plant capacity is even more evident from the establishment of Powder Coating and Emulsion plants at the Dhaka factory is an addition to Berger’s capacity, making it the paint giant in Bangladesh.
With the strong distribution network, Berger has reached almost every corner of Bangladesh. The nationwide dealer network , supported by seven (8) sales depots strategically located at Dhaka , Chittagong, Rajshahi, Khulna, Bogra, Sylhet, Comilla and Mymensingh has enabled them to strategically cater to all the parts of the country.
The product range includes specialized outdoor paints to protect against adverse weather condition. Color Bank, superior Marine paints, roofing compounds, Epoxies and Powder Coatings. In each of these product categories, Berger has been the pioneer. Berger also provides customer support connecting consumers to technology through specialized Home Décor service giving free technical advice on surface preparation , colour consultancy , special colour scheme etc. To bolster customer satisfaction, Berger launched Illusion-the first designer paint solution. The company also launched Innova wood Coating and PowerBond adhesive to cater the needs of customers.
Due to Berger’s superior product quality and production efficiency with skillful management team and employee Berger has been operating its business productively in Bangladesh. As Berger spends a lot for Research and Development sector, they could be innovative and easily could attract the customer group that they targeted. By understanding the customer need Berger innovated a wide range of its product and expanded the product line according to diverse need. Thus Berger has been remaining in the paint industry in a sustainable manner holding a great market share over their rivals. Berger is also having a significant sales thought out the business span and due to its low cost structure and distinctive competency in quality products along with well recognized brand image; Berger has successfully achieved 27.54% growth in 2008.
Berger knows their customers better than their competitors. Therefore they have some unique strategies regarding the advertisement. By broadcasting their effective and well focused advertisements; Berger is also outperforming in the paint industry. Beside these to reach their customers properly Berger has set up Sales offices at different place of this country to make their product available and to ensure a proper distribution channel. More over operating with two large factories equipped with state-of-art technology residing in Dhaka and Chittagong; Berger has got a well coverage off their network though out the country.
Vision and Mission of the company
The vision and mission of Berger paints Bangladesh Limited (BPBL) is very transparent and tangible. Berger emphasizes highly on the ethical commitment to produce benchmark quality product. The vision and mission statement of the company is:
Vision:
We shall remain the benchmark in the paint industry by:
Being an innovative and technology driven Company consistently delivering world-class products ensuring best consumer satisfaction through continuous value added services provided by highly professional and committed team.
Mission:
We will remain the number one/two in all the categories in which we operate.
Corporate Objective:
Berger’s corporate objective is to add value to life, to outperform the peers in terms of longevity, customer service, revenue growth, earnings and cash generation.
Berger will be the employer of choice for all existing and future employees.
Strategy:
Berger’s strategy is to build long-term partnerships with the customers/consumers. With their support, Berger aim to maximize the potential of their business-through a combination of enhanced quality of product, service, creative marketing, competitive pricing and cost efficiency.
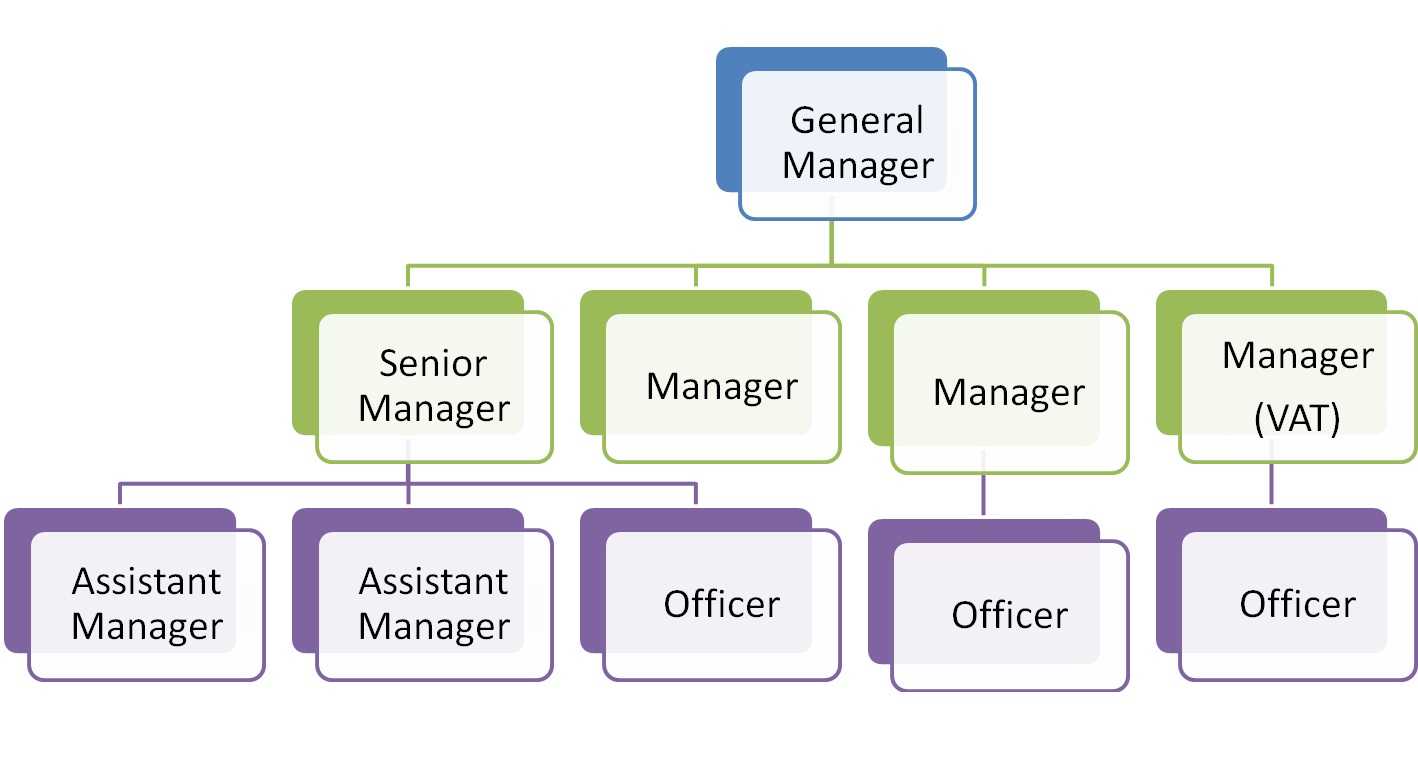
The Organogram of Berger Paints Bangladesh Limited
Berger Paints Bangladesh Limited(BPBL) is a Multinational Paint Company. Mr. Gerald K Adams is the Chairman of the company. Ms Rupali Chowdhury is the Managing Director of the Company. She is also is the head of the executive management team. Under her there are six General Manager in BPBL. There are basically six departments in BPBL: Treasury & finance, Budget & Cost control, Marketing, Human Resource & Administration, Supply Chain and IT & systems. In each departments there are different levels of executive, managers, officers are working.
The positional hierarchy of the company is as follows:
- Managing Director
- Director
- General Manager
- Senior Manager
- Manager
- Assistant Manager
- Officer ( i, ii, iii, iv) / Management Trainee
The organogram of BPBL in short form is given in the next page.
Board of Director:
1) Mr. Gerald Adams – Chairman
2) Ms. Rupali Chowdhury – Managing Director
3) Mr. K.R. Das – Director
4) Mr. Masih Ul Karim – Advisor & Board Member
5) Mr. Anil Bhalla – Director
6) Mr. Subir Bose – Director
7) Mr. Jean-Claude Loutreuil – Director
8) Mr. Abdul Khalek – Director
Executive Management Team:
1) Ms. Rupali Chowdhury – Managing Director
2) Mr. Abdul Khalek – Director Finance
3) Mr. Iqbal Karim – GM-Dhaka Factory & Projects
4) Mr. Nazmuddin Helali – GM-Chittagong Factory and J&N Bangladesh LTD
5) Mr.Md. Mohsin Habib Chowdhury – GM-Marketing & Sales
6) Mr. Mohammad Ahsun Ullah- GM-Treasury & Financial Accounting
7) Ms. Humaira Fatema Hamim – GM-Human Resource & Administration
8) Mr. H.M. Rakib Ullah Bashar – GM-Budget & Cost control
9) Mr Sabbir Ahmed – Internal Auditor
10) Mr. Syed Abu Abed Saher – General Sales Manager- Decorative
11) Mr. Anupam Paul – Plant Manager, Dhaka Factory
12) Mr. Syed Mizanur Rahman – Regional Sales Manager-Dhaka (South)
13) Mr. A.K.M Sadeque Nawaj – Marketing Manager
14) Mr. Md. Kawsar Hasan – Production Manager, Chittagong Factory
15) Mr. A.S.M Obaidullah Mahmud – Development Manager
Berger pains operate in three major segments of the paint industry.
Decorative Paints
- The objective is to beautify the surfaces with protection from corrosion and erosion
- This business category mainly targets household segment
- Products are being offered to the consumers through dealer network
- Product fulfills the aesthetic value of the consumer
- Major revenue earning area of BPBL
Industrial
- Tailor made products to cater to the specific needs of customers
- Products give protection to the surfaces in extreme situation like severe Hazardous environment, high temperature, movement of heavy materials and machinery etc.
- Direct marketing approach is being used to promote the industrial coating
- Main customer groups are Garment Factories, Chemical Plants, Fertilizer Manufacturing Plants, and Consumer Durable Manufacturing Plants etc.
Marine
- Products are being offered mainly through direct marketing approach
- Dock Yards, Bangladesh Navy, Passenger ships are the main use groups
- Market is mostly concentrated in Dhaka and Chittagong
Other segments of product of BPBL are:
Innova
Berger Paints recently introduced complete wood coating solution under the brand name Innova in collaboration with Becker Acroma Italia SpA, leading wood coating solution provider in Europe. A launching program was held in Hotel Sheraton on May 27, 2008. With this strategic alliance, the furniture industry will get the opportunity to enjoy the European wood coating finish in Bangladesh.
This brand will offer the complete range of PU based lacquer coatings for wood and MDF board. Berger Innova products have all the characteristics of a high performance finish which includes superb film transparency, matt to high gloss finish, excellent protection against household chemicals (water, tea, coffee, etc.), high resistance to scratches and abrasion from daily use. They are suitable for use on a range of manufactured articles including: furnishings, chairs, kitchens, tables, doors, office furniture, etc.
Power Bond
Berger Paints Bangladesh Ltd. has introduced PowerBond, Synthetic Resin Adhesive-SH. PowerBond is a premier quality water based adhesive that gives the highest bonding strength suitable for furniture industries. This product is lacquer proof and resistant to heat and water, having high coverage which will add value to the related industries.
Wall Putty
Wall Putty is a water based putty formulated with special binder, which makes the surface stronger. It covers the cracks and unevenness of surfaces and makes the surface smooth and well prepared for top coat applications.
Thermoline
Quality road marks is one of the very important criteria to meet benchmarking excellence in road safety and smooth movement of traffic. THERMOLINE Road Marking Paint from Berger promises to ensure this quality in the countrywide network.
Thermoline, the Hot Melt Road marking Paint from Berger, is another feather in Berger R&D’s long track record of developing high tech industrial coatings. In this venture, R&D often works in collaboration with the world’s leading manufacturers and know-how vendors.
Vehicle Refinish:
BPBL recently added another segment in its wide range of product line. It is vehicle refinish. In this segment BPBL manufacture colors for automobiles.
The Company Profile:
Origin: United Kingdom
Registered Office:
43/3, Chatteswari Road
Chittagong – 4000, Bangladesh
Email: bergerbd@spnetctg.com
Website: http://www.bergerbd.com
Corporate Headquarter:
Berger House
Plot-8, Road no: 2, Sector no: 3
Uttara model Town, Dhaka – 1230
Phone: 02-8953665 (Hunting)
Email: info@bergerbd.com
FACTORY:
1) Dhaka factory
Nabinagar, Savar
Phone: 02-7708450, 02-7708091
Email: info@bergerbd.com
2) Chittagong factory:
27-D, FIDC Road, Kalurghat, Chittagong-4212
Phone: 031-670472
Email: info@bergerbd.com
Plant:
1) Powder Coating Plant: Mouja-Taksur, Nabinagar, Savar
2) Emulsion plant: Mouja-Taksur, Nabinagar, Savar
Home Décor:
1) Banani: House # 24, Road#11, Block –F, Banani, Dhaka-1213.
Phone: 02-9872428, E-mail: decor@bergerbd.com
2) Dhanmondi: House#39/B (New), Road#16(New), Dhanmondi, Dhaka – 1207
Phone: 02-8126669, Email: decor_dra@bergerbd.com.
3) Uttara: House#1, Road#5, Sector#1, Uttara, Dhaka-1230
Phone: 02-8918250, Email: decor_uttara@bergerbd.com.
4) Chittagong: Phone: 031-6618807
5) Khulna: Phone: 041-722262
6) Sylhet: Phone: 0821-2831237
7) Comilla: Phone: 081-63403
Sales Office:
1) Dhaka: 272 Tejgaon Industrial Area, Dhaka -1208
Phone: 9897717, 9892708. Email: dhksales@bergerbd.com
2) Chittagong: 43/3, Chatteswari Road, P.O. Box-353, Chittagong-4000
Phone: 031-615893-4, 031-622782. Email: chittagongsales@bergerbd.com
3) Sylhet: Antarango, 70, Shahi Eidgah(supply road), Kazitulla, Sylhet
Phone: 0821-2831237. Email: sylhetdepot@bergerbd.com
4) Bogra: 31, Piari Sankar Street, Katnar Para, Bogra-5800
Phone: 051-62567. Email: bogradepot@bergerbd.com
5) Comilla: 214 Ashrafpur, EPZ Road, Comilla-3500
Phone: 081-63403, 72940. Email: comilladepot@bergerbd.com
6) Rajshahi: 482, Ramchandrapur, P.O. Ghoramara, Thana: Boalia
Phone: 0721-773512. Email: rajshahidepot@bergerbd.com
7) Khulna: Shabuj Baag, 2 K.D.A. Approach Road, Sonadanga, Khulna-9000
Phone: 041-722262. Email: khulnadepot@bergerbd.com
8) Mymensingh: 304 Mashkanda, Myemensingh
Phone: 091-51754, 01714030698
Subsidiary Company:
Jenson & Nicholson ( Bangladesh) Limited
70, East Nasirabad I/A
Baizid Bostami Road,
Chittagong-4000,
Phone: 031-682462
Date of Incorporation: 6th July, 1973
Commercial Production: 1973
Business Line: Manufacturing and Marketing of high quality paints.
Nature of Business Activities:
The principal activity of the company is to continue manufacturing and marketing of liquid and non-liquid paints & varnishes and coating throughout the year.
Status: Public Limited Company
(Enlisted both in Dhaka and Chittagong Stock Exchange)
Position in the Industry: 1st
Special Attachment: ISO9001:2000
Focus of Berger Paints Bangladesh Limited
Berger Paints Bangladesh Limited focuses on the following things:
- Commitment to achieve total customer satisfaction
- Commitment to project the company as an ethical and socially responsible one
- Commitment to continue as the market leader through consistent sales growth, increasing productivity and developing new products benefiting the customer needs
- Ensuring continuous improvement in operation through utilization of highly professional and dedicated team, proper process, management and participation of the stakeholders
- Setting measurable targets at appropriate stages and continuously monitoring them.
Budget and Cost Control Department (BNCC)
Budget and cost control department is one of the core departments of Berger Paints Bangladesh Limited. Every department has a link with this department, as BNCC perform the overall budget for every department, monitor operations and try to find out the way to minimize overall cost of BPBL.
Departmental Goal
BNCC’s goal is to execute a excellent budget which will satisfy the financial need of every department and to minimize the cost of the whole company.
Functions
1) Prepare the annual budget of BPBL
2) Continuous monitoring on various operations
3) Find out ways of reducing cost on different operations
4) Execute report on Physical stock taking
5) Inventory analysis
6) Inventory movement monitoring
7) Managing the working capital
8) Accomplish different sort of financial requirement on the request of other departments
Organogram
Analysis of the Department:
As a department BNCC is very active. It continuously fulfills the requested requirement of all departments. The work pressure here is very high. All the members of the department are very supportive to each other; they always try to help the other members if possible. Besides, superior member and subordinates have very good co-ordination.
The main problem of the department is that although it is a core department, its member is very few. Therefore, everyone in this department has to face a tremendous pressure of work. Besides, there is less division within the department. For this one person here is responsible for multiple types of works, which sometimes may create job dissatisfaction.
To improve the current condition of the department it should increase its human resource. Also they should split different works and create more division, which will help everyone to focus on the specific activity more effectively.
Financial Analysis
Ratio Analysis
Ratio analysis is a good process to measure a company’s overall financial condition. By comparing several years ratio it can be found whether a company is performing good or bad in a specific side or not. Here the ratio analysis of BPBL from year 2005-2008 is given.
Liquidity/Solvency Ratio | ||||||
| Unit | 2008 | 2007 | 2006 | 2005 | |
|
|
|
|
|
| |
1 | Current Ratio | Times | 1.45 | 1.53 | 1.91 | 1.83 |
2 | Net Working Capital | TK | 338,604,000.00 | 366,965,000.00 | 389,075,000.00 | 436,346,000.00 |
3 | Quick Ratio | Times | 0.53 | 0.65 | 0.91 | 1.16 |
|
|
|
|
| ||
4 | Cash Ratio | Times | 0.06 | 0.03 | 0.12 | 0.59 |
|
|
|
|
| ||
5 | Cash Flow to Total Debt | Times | 1.34 | 1.10 | 1.58 | 0.73 |
|
|
|
|
| ||
6 | Cash Flow From Operation | TK | 342,938,000.00 | 375,250,000.00 | 363,100,000.00 | 58,178,000.00 |
|
|
|
|
| ||
7 | Net Liquid Balance | Tk | 41,372,000.00 | (131,366,000.00) | 4,462,000.00 | 313,735,000.00 |
|
|
|
|
| ||
8 | Working Capital Requirement (WCR) | TK | 297,232,000.00 | 498,331,000.00 | 384,613,000.00 | 122,611,000.00 |
|
|
|
|
| ||
9 | WCR to Sales Ratio | % | 6.61% | 14.13% | 13.39% | 5.78% |
|
|
|
|
| ||
10 | Cash Cycle/Cash Conversion Cycle (CCC) | Days | 25.23 | 27.81 | 27.56 | 36.46 |
11 | Cash Turnover | Times | 14.47 | 13.12 | 13.24 | 10.01 |
|
|
|
|
| ||
| Daily Operating Expenses | TK | 10,604,046.58 | 8,162,967.12 | 6,535,673.97 | 4,820,673.97 | |
|
|
|
|
| ||
12 | Reserve Cash/NWC to Asset | Times | 0.20 | 0.22 | 0.30 | 0.33 |
|
|
|
|
| ||
13 | Interval Measure | Days | 5.09 | 3.24 | 8.72 | 66.78 |
|
|
|
|
| ||
14 | Defensive Interval/ Days to ruin | Days | 3.90 | 2.28 | 7.57 | 65.08 |
|
|
|
|
| ||
15 | Current Liquidity Index | Times | 2.41 | 9.44 | infinite |
|
|
|
|
|
| ||
Overall Liquidity condition of 2008 and 2007 was more or less same. Among these four years in 2007 company’s liquidity position was the best. Current ratio, quick ratio, NWC, cash flow to debt, Cash ratio and reserve cash has decreased from 2006. However, in terms of cash conversion cycle and cash turnover BPBL is doing well in 2008 than Last three years. In terms of net liquid balance it shows that in 2007 BPBL has negative NLB, this maybe caused because they have Tk 150,000,000 notes payable that year and the remaining 3 years BPBL has 0 notes payable except the year 2006 where it has notes payable of Tk 45,000,000. The threat here for BPBL is that its defensive interval decreases to a great extend, also, its current liquidity index is also decreased in 2008, which shows that the company can face liquidity problem in future if it does not take proper measures.
Efficiency Measures | ||||||
Unit | 2008 | 2007 | 2006 | 2005 | ||
|
|
|
|
| ||
1 | Cash Conversion Efficiency (CCE) | % | 7.62% | 10.64% | 12.64% | 2.74% |
|
|
|
|
| ||
2 | Inventory Turnover Ratio (ITOR) | Times | 4.84 | 4.60 | 4.94 | 3.94 |
3 | Days Inventory Held (DIH) | Days | 75.46 | 79.33 | 73.87 | 92.56 |
|
|
|
|
| ||
4 | Receivables Turnover Ratio (RTOR) | Times | 439.85 | 459.43 | 365.64 | 258.42 |
5 | Days Sales Outstanding (DSO) | Days | 0.83 | 0.79 | 1.00 | 1.41 |
6 | Days Payable Outstanding (DPO) | Days | 51.06 | 52.31 | 47.30 | 57.52 |
|
|
|
|
| ||
7 | Days Sales in inventory | Days | 80.11 | 93.33 | 80.93 | 92.56 |
8 | Cash Cycle/Cash Conversion Cycle (CCC) | Days | 25.23 | 27.81 | 27.56 | 36.46 |
In terms of efficiency BPBL’s overall efficiency is slightly decreased in 2008 than the previous year 2007. However, its Cash conversion efficiency was the highest in 2006. Also, in terms of inventory turnover, Days inventory held they were performing well in 2006. Which means inventory condition was good in 2006. On the other hand in terms of Receivable turn over, days sales outstanding, days payable outstanding, days sales in inventory BPBL’s performance is best in 2007. In terms of cash conversion cycle they perform better in 2008. In 2008 they have the lowest cash conversion cycle, which is a good sign for the company’s liquidity condition.
Debt Management Ratio | ||||||
Unit | 2008 | 2007 | 2006 | 2005 | ||
|
|
|
|
| ||
1 | Times Interest Earned | Times | 30.11 | 26.40 | 37.56 | 16.64 |
2 | Long Term Liability to Equity | % | 8% | 8% | 10% | 12% |
|
|
|
|
| ||
3 | Current Liability to total liability Ratio | % | 91% | 91% | 85% | 86% |
|
|
|
|
| ||
4 | Long Term Liability to total liability Ratio | % | 9% | 9% | 15% | 14% |
5 | Total Liabilities To Total Asset | % | 48% | 46% | 39% | 46% |
|
|
|
|
| ||
6 | Debt Equity Ratio | % | 91% | 86% | 63% | 86% |
|
|
|
|
| ||
7 | Cash Coverage Ratio | Times | 33.90 | 29.44 | 41.31 | 18.86 |
|
|
|
| |||
BPBL’s Debt management condition was the best in the year 2006. In 2007 and 2008 it is more or less same, but the situation become slight better in year 2008. BPBL’s long term liability to equity ratio is lower in all the four years, it’s because BPBL usually do not take long term bank loan for financing. Their main long term liabilities are employee’s retirement gratuity and tax equalization reserve. In terms of current liability to total liability ratio it shows very high percentage, because BPBL’s main liabilities are short term and they sometime take short term bank loan for financing their working capital. BPBL’s Debt to equity ratio in 2008 is very high compare to other years; it is a big threat for the company. However its cash coverage ratio increases in 2008 than the previous year, though it is the highest in 2006.
Asset Management Ratio | ||||||
Unit | 2008 | 2007 | 2006 | 2005 | ||
|
|
|
|
| ||
1 | Fixed Asset Turnover Ratio (FATOR ) | Times | 7.31 | 6.61 | 6.78 | 5.83 |
|
|
|
|
| ||
2 | Fixed Asset Turnover Period (FATOP) | Days | 86.91 | 96.86 | 113.16 | 165.84 |
|
|
|
|
| ||
3 | Total Asset Turnover Ratio (TATOR) | Times | 2.67 | 2.40 | 2.19 | 1.60 |
|
|
|
|
| ||
4 | Total Asset Turnover Period (TATOP) | Days | 136.84 | 152.13 | 167.04 | 228.49 |
|
|
|
|
| ||
5 | Current Asset Turnover Ratio (CATOR) | Times | 4.20 | 3.77 | 3.23 | 2.20 |
|
|
|
|
| ||
6 | Current Asset Turnover Period (CATOP) | Days | 86.91 | 96.86 | 113.16 | 165.84 |
|
|
|
|
| ||
7 | NWC Turnover | Times | 13.29 | 9.61 | 7.38 | 4.86 |
|
|
|
|
| ||
8 | Reserve Cash/NWC to Asset | Times | 0.20 | 0.22 | 0.30 | 0.33 |
|
|
|
|
| ||
In terms of Asset management BPBL has done a great job in 2008. Its overall asset management performance was better in 2008 than the previous three years. In terms of Fixed asset turnover, Fixed asset turnover period, total asset turnover, total asset turnover period, current asset turnover, current asset turn over period, NWC turnover BPBL’s performance has increased in every year than its previous year. However reserve cash shows an decreasing trends.
Profitability Ratio | ||||||
Unit | 2008 | 2007 | 2006 | 2005 | ||
|
|
|
| |||
1 | Profit Margin | % | 8.91% | 9.62% | 10.93% | 11.77% |
|
|
|
|
| ||
2 | Operating Profit Margin | % | 11.41% | 12.41% | 14.32% | 13.59% |
3 | Basic Earning Power (BEP) | % | 29.60% | 26.72% | 31.60% | 21.71% |
| ||||||
4 | Return on Equity (ROE) | % | 44.01% | 38.53% | 40.72% | 31.79% |
5 | Return on Assets (ROA) | % | 23.10% | 20.70% | 24.12% | 18.80% |
|
|
|
|
| ||
6 | Pay Out Ratio (POR) | % | 92.60% | 75.17% | 81.27% | 92.88% |
|
|
|
|
| ||
7 | Plough Back Ratio (PBR) | % | 7.40% | 24.83% | 18.73% | 7.12% |
|
|
|
|
| ||
In terms of overall profitability again year 2006 is the best among four years. Profit margin, operating profits margin, Basic earning power decreases after the year 2006. However return on equity is the highest in 2008 and ROA was decreased in 2007 from 2006 but it again increased in 2008. BPBL has a huge payout ratio in 2008 and 2005. They pay almost 93% of their net income as dividend. On the year 2007 they pay the least dividend of 75% among these four years, therefore in this year they have the highest Plough back ratio of 25%. On the other hand in the year 2008 and 2005 BPBL retain very few percentages from its net income for next year’s operation.
Market Value Analysis | ||||||
Unit | 2008 | 2007 | 2006 | 2005 | ||
|
|
|
|
| ||
1 | Earning Per Share (EPS) | TK | 17.28 | 14.63 | 13.54 | 10.77 |
|
|
|
|
| ||
2 | Book Value | TK | 910,304,000.00 | 880,667,000.00 | 796,393,000.00 | 714,407,000.00 |
|
|
|
|
| ||
3 | Book Value Per Share | Tk | 39.26 | 37.98 | 34.34 | 30.81 |
|
|
|
|
| ||
4 | Market Value | Tk | 6,547,397,209.00 | 6,344,053,394.14 | 3,692,374,916.20 | 2,602,262,846.80 |
|
|
|
|
| ||
5 | Market Value Per Share | Tk | 282.35 | 273.58 | 159.23 | 112.22 |
|
|
|
|
| ||
6 | Price Earnings Ratio (P/E) | Times | 16.34 | 18.69 | 11.76 | 10.42 |
|
|
|
|
| ||
7 | Market to Book Value Ratio | Times | 7.19 | 7.20 | 4.64 | 3.64 |
|
|
|
|
| ||
8 | Dividend Yield | % | 6% | 4% | 7% | 9% |
|
|
|
|
| ||
BPBL’s market value is in an increasing trend. It first listed as a public ltd company in 2005. From 2005 to 2008 its EPS, Book Value, Book Value per share, Market value, Market value per share, Market to book value ratio is in an increasing trend. However, BPBL,s price earnings ratio was increasing from the year 2005-2007, but it dropped slightly on 2008. Overall it can be said BPBL is performing well in the market since they came and their market reputation is increasing every year.
Growth Calculation | |||||||
Unit | 2009 | 2008 | 2007 | 2006 | 2005 | ||
|
|
|
|
|
| ||
1 | Sustainable Growth | % | 78.62% | 63% | 76% | 35% |
|
|
|
|
|
|
| ||
2 | Sales Growth/Actual Growth | % |
| 27.54% | 22.81% | 35.42% |
|
|
|
|
|
|
| ||
BPBL’s sustainable growth increases from 2006-2008. Its actual growth decreases from 2006 to 2007 and in 2008 it again increases. We know that sustainable growth is the maximum amount of growth a company can grow without changing its capital structure. If a company grows more than its sustainable growth it can face financial problem. In this context BPBL is in a favorable position. Their sales growth is lower than sustainable growth except in 2006, where it is slightly higher than its sustainable growth. It means while increasing its sales BPBL also increases its assets to keep pace with sustainable growth.
SWOT Analysis:
Strengths
1) Strong brand name.
2) Good reputation among customers.
3) Cost advantages from other competitors as they are in the industry for a long period of time and are expert of forecasting the future needs and manufacturing paints effectively.
4) Exclusive access to high grade natural resources.
5) Favorable access to distribution networks.
6) Introduction of new brands, such as vehicle re-finish.
7) Introduction of home décor to meet the queries of customer and give them solution regarding paints.
Weaknesses
1) High cost structure in some products.
2) High cost for importing raw materials.
Opportunities
1) Many people in Bangladesh are now becoming conscious about the internal and external view of their homes. Therefore, they just not only paint their home, they also decorate their home with paints. It is a great opportunity for Berger paints to fulfill this need of customers and introducing more new products.
2) Arrival of new technologies.
3) Internet based marketing and sales. Through this they can also increase promotional activity and sales.
4) Opening new sales depot. Currently BPBL has 8 sales depots. They can open more sales depot to meet the demand of customers and improve the distribution channel.
Threats
1) Competitors are also doing well; they are doing more and more promotional activities to capture the customer from BPBL.
2) Price wars with competitors. If competitors are offering lower price, BPBL will also have to reduce its price to remain competitive.
3) Current crisis of electricity can be a huge threat to BPBL. If everyday production remains stopped for few hours because of electricity problem they can face losses.
Inventory Control & Working Capital Management
Before discussing the main project part I want to discuss about what inventory control is. Inventory is an essential in a manufacturing company. Manufacturing companies usually have three basic types of inventory: raw material, work in process and finished goods. A company’s profitability and liquidity depend to a great extend on inventory. Controlling inventory is an important part of working capital management. Inventory control depends on different variable, such as future demand of a product, supply of raw materials, production schedules etc. A company usually hold inventory for three purposes:
1) To operate day to day production.
2) To meet the unexpected future demand and
3) To meet the forecasted demand
To control inventory a company should have a proper plan and constant monitoring of inventory movement. Inventory control relates with working capital management. If a company hold excess inventory, it would have more holding cost which would increase the day to day operational cost. On the other hand if a company hold too little inventory it would run out of raw material in production or it may not have enough stock of finished goods to meet the demand of customers. Therefore making a proper inventory holding and controlling plan refers to a good working capital management.
Objective
Broad Objective:
My general objective is to asses and find out the inventory control system of Berger Paints Bangladesh Limited and to analyze how it helps to manage the working capital.
Specific Objective:
My specific objective is to assess whether the current inventory control system is working properly to manage the working capital effectively and to recommend the appropriate steps about how it can be improved in future.
Significance
Inventory is an important element in each manufacturing company. If it is not manage properly it can cause a poor working capital management. Berger paints is a renowned multinational paint company and it has to maintain a good amount of inventory of raw material, semi finished goods, packaging material and finished goods. Proper inventory control will help them to have a good working capital management. This study will help the management level to view the current position of inventory and working capital management, whether the current system is working effectively and it will also provide the suggestion of improving the inventory control system, which will help the company financially as well as the stakeholders of the company.
Hypothesis:
As Berger Paints Bangladesh Limited is doing the business in this segment for a long period of time and is a profitable company, my assumption is it has maintained its inventory very effectively. However, little flaws may be found in the inventory control system which can be solved easily.
Methodology:
For smooth and accurate study everyone have to follow some rules and regulation. Therefore some specific methodology should be maintained to conduct the study properly. For data collecting purpose, I used two sources:
Primary source:
• Practical desk work
• Conversation with the officers
• Direct observation
Secondary Source:
• Annual report of BPBL
• Various publications of BPBL
• Website
Inventory Control of Berger Paints Bangladesh Limited
Berger Paints Bangladesh Limited (BPBL) holds four kinds of inventory
- Raw Material
- Packaging Material
- Semi Finished Goods
- Finished Goods
In their two factories they hold all of the four kind of inventory. In their sales depots they hold only one type of inventory: finished goods. To analysis their inventory control system and current position I first study the system of their inventory control and analyse some ratios.
BPBL follow the minimum order quantity while buying raw material so that, they would not have excess inventory. Also they follow some process to control and monitor inventory. I focused on their main three process and distribution channel. Their main three process of inventory control are:
- Physical Stock Taking
- Stock Monitoring
- Inventory Analysis
Physical Stock Taking
Physical Stock Taking is an inventory control process. Berger Paints Bangladesh Limited (BPBL) uses this process to control its inventory. They take it four times in a year. In BPBL there are mainly four types of inventory: Raw Material, Packaging Material, Semi Finished Goods and Finished Goods. There are some steps in Physical Stock Taking Process. It works step by steps.
Determine the Ending Inventory
To determine the ending inventory BPBL use the software SAP. In SAP previous balance of inventory, receipt and issuance of inventory are reserved. With these information SAP generate what should be the ending book balance of each segments of inventory.
Physically Count the inventory
After determining the ending inventory balance BPBL physically count the entire inventory in 2 factories and 8 sales depots. In the counting they also mentioned which inventory stocks are good (sound stock), which stocks are fully damaged and which are used for repackage.
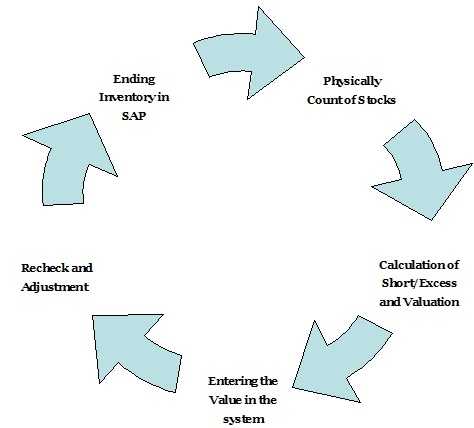
Calculation of Short/Excess and Valuation
1) Raw Material, Semi Finished Goods and Packaging Material:
First, BPBL find out the closing balance of each item of raw material, semi finished goods and packaging material from SAP. Then they match them with physically founded stock and find out the Short/excess of stocks of inventory (Raw Material, Semi Finished Goods & Packaging Material). After that they calculate the value of physical balance, book balance and short/excess of inventory. For example, a raw material is Calcium Acetate. Let assume its ending book balance of inventory is 300 kg and in physically counting it is found 280 kg is available as inventory. Therefore, there is a short of 20 kg. Now if the value of 1 kg of Calcium Acetate is Tk 400 then the value of ending book balance of inventory is Tk120,000, Physical balance is Tk 112,000. Therefore, there is a short of Tk 8000. Similarly, they calculate the value of book balance, physical balance and short/excess for each items and find out the total value of book balance, physical balance and short/excess for raw material, semi finished goods and packaging material. BPBL write off the damaged stock and adjust the value of physical balance and short/excess of stock by excluding the damaged stocks.
2) Finished goods:
BPBL find out the closing balance of each item of finished goods from each sales depot and factories from SAP. Then they match the physically founded sound stock, damaged goods and repackable products with each item. After that they add sound stock, damaged goods and repackable products of each item to generate the physical balance of each item. After that they calculate the short/excess inventory for each depot. Then they calculate the closing value of stocks of each depot. Next they calculate the value of physical balance, book balance, damage stocks, repackable stocks and short/excess. BPBL write off all the damaged stocks of the inventory finished goods. After written off the damaged stocks they calculate the value of physical balance and short/excess again by excluding the damaged stocks. Thus they find out the actual value of current inventory and how much short/excess it is comparing to the book balance.
Entering the Value in the system
After calculation of Short/ Excess of inventory balance BPBL enter the current physical balance in SAP. Also, they adjust the short/excess of Stocks in SAP. Then the system shows the current inventory balance.
Recheck and Adjustment
After entering the value in SAP, they match it with the previously calculated quantity of physical balance and short/excess stocks. If there is any mismatch in any item they checked it again and enter the correct balance in SAP again.
Stock Monitoring
Stock monitoring is an important part of inventory control process. By stock monitoring one company can assess whether current plan on inventory controlling process is working properly or it need to be modified or changed. Stock monitoring help the company to take necessary decision immediately, if there is any major change happened in inventory. BPBL usually use two methods to monitor its stocks. They are
1) Monthly usage report of inventory
2) Movement analysis
Monthly Usage Report of Inventory
BPBL check a monthly/quarterly usage report of inventory at the end of every month for each factories and sales depot. This report is generated in SAP, as issuance and usage of each item of raw materials; packaging materials, finished goods and semi finished goods are recorded in SAP. At the beginning of a new month they check the previous month’s usage record of inventory. In this usage report there is information about the quantity and value of inventory is issued during the month and the usage of it. If some item shows no usage for three months or more, they are consider as slow moving and those are highlighted in front of management The management tries to find out why those items are moving slow, is there any problem in inventory planning an d the solution of reducing the slow moving inventory items.
Besides, in this report stocks of high coverage days are also shown. (Coverage days = Stock value/value of average total usage per day). These stocks are also come to the concern of management, as BPBL tries to maintain to minimum inventory balance.
Separate reports are prepared for the inventory of raw materials, packaging materials, finished goods and semi finished goods. In each report there are some parts. For example, if a usage report is produced for finished goods first there would be a full report which includes both factories and eight sales depots, then it can be segmented by individual report of each factories and sales depots, by material groups, by division of products etc. By segmenting the report it become easier to find out the problem area of high coverage inventory item. For example, let assume in a full report of the month March, stock A shows high coverage days of 45 days. Then BPBL segment the report by factory and depot wise and find out that in Khulna sales depot the coverage days of stock A is 40 days and in all other depots and factories it is less than 4 days. By segmenting here BPBL can find out the problem zone which helps management to concentrate easily on the problem zone.
Movement Analysis
Another process of stock monitoring is inventory movement analysis. Through this process BPBL knows in which process inventory is in. There are many steps in inventory movement in BPBL. The main processes are described below:
1) First step of inventory movement is goods received from supplier. After goods are received from supplier those are entered in SAP as inventory.
2) If BPBL receive wrong quantity, or wrong material or received goods are not up to the standard those are returned to the supplier. This is called reversal of goods receive from supplier.
3) After goods are received some of the items are issued for production.
4) If issued items are unused in production they are reversed and listed as inventory.
5) Some received goods are received for the usage of other purpose except production, for example for cleaning of machines Soya bean oils is used. That inventory movement stage is called goods received for cost centre.
6) Sometimes inventories are transferred inter factory or inter depots to meet the higher demand or to reduce the excess inventory items in one factory or depots.
7) There is also a quality control stage in inventory movement. After goods are received the stocks remained blocked. Then quality checks of those stocks are held. After being ensured that the stocks pass the required quality test those are labeled as unrestricted and are ready to use.
Each stages of inventory movement has an unique code in SAP. A report is generated for each factories and depots every month/quarter to review the inventory movement of BPBL. In this report it is shown that which batch of stocks are in which movement stage. It helps BPBL in monitoring its inventory.
Inventory Analysis
BPBL use inventory analysis process to control its inventory. Inventory analysis is a process which helps to find out the difference between budgeted and actual stock coverage days and take measures if necessary.
BPBL perform inventory analysis in two ways:
1) Historical Basis &
2) Forward Basis.
In both historical & forward basis they first calculate per day usage and by using this per day’s usage they calculate actual stock days/coverage days.
a) Per day usage = ( Usage/ No of days)
b) Stock days/ Coverage= ( Stock/ Per day usage)
Historical Basis
In historical basis last three months’ actual consumption of stocks are used to calculate per day usage. Then current available stocks are divided by this per day usage to find out the actual coverage days. After that actual coverage days are compared with budgeted coverage days to find out the difference.
Forward Basis
In forward basis the forecasted next three months’ consumption of stocks from current month are used to calculate per day usage. Then current available stocks are divided by this per day usage to find out the actual coverage days. After that actual coverage days are compared with budgeted coverage days to find out the difference. If the actual coverage days are less than the budgeted coverage, then BPBL can purchase more stocks to meet the forecasted demand. On the other hand if the actual coverage days are more than the budgeted coverage days, then BPBL can reforecast about the needs of stock and reduce purchasing stocks on following months, as there is already much raw material available to manufacture forecasted amount of goods.
Two examples are given below to describe the inventory analysis system of BPBL
Example 1:
| Quantity in KG | ||||||||
| Month | NOV | DEC | JAN | FEB | MAR | APR | MAY | JUN |
| Days | 30 | 31 | 31 | 28 | 31 | 30 | 31 | 30 |
| Consumption | 1,700,000 | 1,980,000 | 1,985,000 | 1,964,000 | 1,980,000 | 1,960,000 | 1,755,000 | 1,660,000 |
| Current Stock in hand | 500,000 | |||||||
| ||||||||
| last 3 month consumption | 5,929,000 | |||||||
| days | 90 | |||||||
| per day consumption | 65,878 | |||||||
| Stock | 500,000 | |||||||
| Stock days-actual | 8 | |||||||
| Stock days-budget | 10 | |||||||
| (Excess)/ Short holding | 2 | |||||||
| ||||||||
| next 3 month cons | 5,695,000 | |||||||
| days | 92 | |||||||
| per day consumption | 61,902 | |||||||
| Stock | 500,000 | |||||||
| Stock days-actual | 8 | |||||||
| Stock days-budget | 10 | |||||||
| (Excess)/ Short holding | 2 | |||||||
| Note: | ||||||||
| short holding=less stock hold compare to budget | ||||||||
| Quantity in value (Taka) | ||||||||
| Rate | 250 | per kg(considering same rate) | ||||||
| Month | NOV | DEC | JAN | FEB | MAR | APR | MAY | JUN |
| Days | 30 | 31 | 31 | 28 | 31 | 30 | 31 | 30 |
| Consumption | 425,000,000 | 495,000,000 | 496,250,000 | 491,000,000 | 495,000,000 | 490,000,000 | 438,750,000 | 415,000,000 |
| Current Stock in hand | 125,000,000 | |||||||
| A. Historical basis-last 3 month consumption | ||||||||
| last 3 month consumption | 1,482,250,000 | |||||||
| days | 90 | |||||||
| per day consumption | 16,469,444 | |||||||
| Stock | 125,000,000 | |||||||
| Stock days-actual | 8 | |||||||
| Stock days-budget | 10 | |||||||
| (Excess)/ Short holding | 2 | |||||||
| B. Forward basis-based on next 3 month consumption | ||||||||
| next 3 month cons | 1,423,750,000 | |||||||
| days | 92 | |||||||
| per day consumption | 15,475,543 | |||||||
| Stock | 125,000,000 | |||||||
| Stock days-actual | 8 | |||||||
| Stock days-budget | 10 | |||||||
| (Excess)/ Short holding | 2 | |||||||
| Note: | ||||||||
| short holding=less stock hold compare to budget | ||||||||
In this example we assume how much raw material is needed per month for production of BPBL. We assume BPBL is at the end of the month of February and currently BPBL have 500,000 kg stock in hand. Here the stock of December, January and February are based on historical consumption and rest of the months required stocks are forecasted. The budgeted stock coverage days here is 10 days. Which means at any point in time BPBL will try to reserve an amount of stock by which production can run for 10 days.
In historical basis the required stocks of December, January and February are added and then it is divided by 90 days (31+31+28=90) to find out the per day consumption. Then this per day consumption is divided from the current stock to find out the actual coverage days. Here by historical consumption actual coverage days is 8 days and a budgeted coverage day is 10 days. Therefore here is a short of 2 days.
In Forward basis Calculation are similar but it is based on the forecasted following three months (March, April and May) required stock. In this example by forward basis stock coverage days is 8 days but the budgeted stock coverage day is 10 days. Therefore, there is a short of 2 days. Now as BPBL know by this process that they are in a short of stock to cover the demand as forecasted they can instantly buy more stocks to meet the demand.
Example 2:
| Quantity in KG | ||||||||
| Month | NOV | DEC | JAN | FEB | MAR | APR | MAY | JUN |
| Days | 30 | 31 | 31 | 28 | 31 | 30 | 31 | 30 |
| Consumption | 1,623,000 | 1,625,000 | 1,730,000 | 1,818,000 | 1,890,000 | 1,680,000 | 1,590,090 | 1,645,000 |
| Current Stock in hand | 1,000,500 | |||||||
| Interest | 15% Annually | 0.0004 | Daily | |||||
| A. Historical basis-last 3 month consumption | ||||||||
| last 3 month consumption | 5,173,000 | |||||||
| days | 90 | |||||||
| per day consumption | 57,478 | |||||||
| Stock | 1,000,500 | |||||||
| Stock days-actual | 17 | |||||||
| Stock days-budget | 10 | |||||||
| (Excess)/ Short holding | (7) | |||||||
| B. Forward basis-based on next 3 month consumption | ||||||||
| next 3 month cons | 5,160,090 | |||||||
| days | 92 | |||||||
| per day consumption | 56,088 | |||||||
| Stock | 1,000,500 | |||||||
| Stock days-actual | 18 | |||||||
| Stock days-budget | 10 | |||||||
| (Excess)/ Short holding | (8) | |||||||
| Note: | ||||||||
| short holding=less stock hold compare to budget | ||||||||
| Quantity in value (Taka) | ||||||||
| Rate | 250 | per kg(considering same rate) | ||||||
| Month | NOV | DEC | JAN | FEB | MAR | APR | MAY | JUN |
| Days | 30 | 31 | 31 | 28 | 31 | 30 | 31 | 30 |
| Consumption | 405,750,000 | 406,250,000 | 432,500,000 | 454,500,000 | 472,500,000 | 420,000,000 | 397,522,500 | 411,250,000 |
| Current Stock in hand | 250,125,000 | |||||||
| Interest | 15% Annually | 0.0004 | Daily | |||||
| A. Historical basis-last 3 month consumption | ||||||||
| last 3 month consumption | 1,293,250,000 | |||||||
| days | 90 | |||||||
| per day consumption | 14,369,444 | |||||||
| Stock | 250,125,000 | |||||||
| Stock days-actual | 17 | |||||||
| Stock days-budget | 10 | |||||||
| (Excess)/ Short holding | (7) | |||||||
| Interest cost for extra holding | (43,739) | |||||||
|
| ||||||||
| B. Forward basis-based on next 3 month consumption | ||||||||
| next 3 month cons | 1,290,022,500 | |||||||
| days | 92 | |||||||
| per day consumption | 14,021,984 | |||||||
| Stock | 250,125,000 | |||||||
| Stock days-actual | 18 | |||||||
| Stock days-budget | 10 | |||||||
| (Excess)/ Short holding | (8) | |||||||
| Interest cost for extra holding | (45,167) | |||||||
| Note: | ||||||||
| short holding=less stock hold compare to budget | ||||||||
This example is similar to example 1. Here again we how much raw material is needed per month for production of BPBL. We assume BPBL is at the end of the month of February and currently BPBL have 1,000,500 kg stock in hand. Here the stock of December, January and February are based on historical consumption and rest of the months required stocks are forecasted. The budgeted stock coverage days here is 10 days. Which means at any point in time BPBL will try to reserve an amount of stock by which production can run for 10 days. Also, we assume current interest rate is 15% annually, which means daily interest rate is0.04%.
Here after calculation of stock by historical basis it is found that actual stock coverage day is 17 days, whereas, in budget it is 10 days. Therefore BPBL has 7 days excess stock. Which means their cost of holding inventory will increase. Also if they do not have this extra 7 days stock, they could invest this money to some other purpose or they can save it to bank which would give them an interest of Taka 43739 for this 7 days. Therefore they lose Taka 43739 as an interest cost for holding excess 7 days inventory.
(Interest Earning= per day consumption* daily interest rate* Excess days of stock holding)
(In Historical Basis Interest Earning=Tk 14,369,444/day*0.04%*7days=Taka43739)
Similarly, by forward basis after calculation it is found that actual stock coverage days are 18 days and the budgeted days is 10 days. Thus BPBL has 8 days excess stock. The interest cost of 8 days excess stock is Taka 45,167.
(In Forward Basis Interest Earning=Tk 14,021,984/day*0.04%*7days= Tk 45,167)
As BPBL here know that they have excess stock, they can reduce the purchase amount of stocks for the following moths and reforecast the stock requirement for the following months. Thus day can reduce cost of holding extra inventory.
BPBL use this inventory analysis to find out whether their budgeted and actual stock coverage days are matching with each other. By this analysis it is easy to find out the mismatch and the cost for this mismatch. It helps BPBL to take appropriate measures immediately to control inventory holding and reduce cost.
Distribution Channel
Berger Paints Bangladesh limited has two Factories; one is in Dhaka and another is in Chittagong. They have eight sales depots all over Bangladesh: Dhaka, Chittagong, Sylhet, Comilla, Bogra, Rajshahi, Khulna and Mymensingh. From these two factories Finished Goods are distributed to Sales Depots and then from sales depots it is distributed to the dealers.
- BPBL has two channel of distribution: channel one and channel two. In one channel level, paints from BPBL’s sales depots are delivered to the dealers from where ultimate users purchase paints. In the two-level channel, some major dealers dominate the paint market in the region where they are located. Small dealers collect paints from the large-scale dealers. Ultimate users buy paints from these small dealers. BPBL has its own vehicle to deliver goods to the dealers.
- Sometimes BPBL also do personal selling from its sales depots if they get very lucrative buyer. In personal selling they sometime also transport goods to the buyer.
- To become a registered dealer, a dealer has to do business with BPBL for a certain period of time. After the period if BPBL consider his performance as profitable for the company, they register him as dealer. Each registered dealers of Berger has to achieve a yearly sales target set by Berger to enjoy TOC (Turnover Commission), a percentage of total yearly sales.
- Usually BPBL do cash sales. But they also offer credit sales to dealers. Credit term varies from dealer to dealer. They set credit term on the basis of dealers’ previous performance, how long they are doing business with BPBL etc.
- After delivering goods to the dealers BPBL consider its goods to be sold. Whether dealers sold it to the end user or not, they have to pay BPBL either in cash or in case of credit sales within the credit period.
Ratio Analysis for Inventory Management and Working Capital Management
| Unit | 2008 | 2007 | 2006 | 2005 | |
|
|
|
|
|
| |
1 | Current Ratio | Times | 1.45 | 1.53 | 1.91 | 1.83 |
| Change than previous year |
| -5% | -20% | 4% |
| |
|
|
|
|
| ||
2 | Quick Ratio | Times | 0.53 | 0.65 | 0.91 | 1.16 |
| Change than previous year |
| -18% | -29% | -21% |
|
Current ratio of BPBL was in a decreasing trend after 2006. It has decreased 20% from the year 2006 to 2007 and 5% from 2007 to 2008. In case of quick ratio again it is in a decreasing trend. From 2005 to 2006 current ratio has increased but it that year quick ratio has decreased, which means BPBL has much inventory that time which cause the quick ratio to decrease. Besides, from years 2006 to 2007 current ratio decreased by 20%, in that year quick ratio decreased by 29% and from 2007 to 2008 current ratio decreased by 5% and quick ratio decreased by 18%. In both the year 2007 and 2008 quick ratio has decreased from previous year more than that of current ratio, which indicate BPBL’s inventory level is increasing which cause the quick ratio to fall more.
| Unit | 2008 | 2007 | 2006 | 2005 | |
|
|
|
|
| ||
1 | Cash Ratio | Times | 0.06 | 0.03 | 0.12 | 0.59 |
|
|
|
|
| ||
2 | Net Working Capital | TK | 338,604,000.00 | 366,965,000.00 | 389,075,000.00 | 436,346,000.00 |
BPBL’s Cash ratio is in a decreasing trend up to year 2007. However, in year 2008 it started increasing. BPBL’s NWC is in a decreasing trend, which may cause the decrease of liquidity.
Unit | 2008 | 2007 | 2006 | 2005 | ||
1 | Inventory Turnover Ratio (ITOR) | Times | 4.84 | 4.60 | 4.94 | 3.94 |
2 | Days Inventory Held (DIH) | Days | 75.46 | 79.33 | 73.87 | 92.56 |
|
|
|
|
| ||
3 | Receivables Turnover Ratio (RTOR) | Times | 439.85 | 459.43 | 365.64 | 258.42 |
4 | Days Sales Outstanding (DSO) | Days | 0.83 | 0.79 | 1.00 | 1.41 |
5 | Days Payable Outstanding (DPO) | Days | 51.06 | 52.31 | 47.30 | 57.52 |
|
|
|
|
| ||
6 | Cash Cycle/Cash Conversion Cycle (CCC) | Days | 25.23 | 27.81 | 27.56 | 36.46 |
|
|
|
|
| ||
7 | Cash Turnover | Times | 14.47 | 13.12 | 13.24 | 10.01 |
|
|
|
|
|
In case of inventory turnover ratio and days inventory held BPBL’s condition was best in 2006. In 2007 DIH has increased, but in 2008 it again decreased. However receivable turnover and day sales outstanding ratio seems to be good in recent years of 2007 and 2008, which may be a result of BPBL’s strict credit policy. Day’s payable outstanding was the best in the year 2005 and in 2007 and 2008 it was more or less same. Cash conversion cycle is in a decreasing trend, which is a good sign for the company. Also, cash turnover is in increasing trend. Here we can see that from the year 2006 to 2008 company’s inventory condition is a little bit degrading, but receivable and payable condition increases. This causes the cash conversion cycle to decrease. So, if BPBL can improve the condition of DIH Cash conversion cycle would decrease more, which will be very profitable for the company.
Findings
From the analysis of the overall system of inventory control and monitoring my findings is that BPBL has maintained a very good system to control its inventory.
- From Physical stock taking they find out the variance between their book balance and physical balance of inventory. After finding out the variance they investigate why the variance occur, which help them to find out the problem area of inventory and solve it. BPBL does physical stock taking 4 times a year. So, they are able to find out in every quarter how much inventory is mismatched with book balance and take steps so that the variance reduces in the next quarter. It helps them to become more efficient in inventory controlling.
- Stock Monitoring helps BPBL to find out the slow moving and high coverage day inventories. By constant monitoring they find out the slow moving inventory area and try to reduce the coverage days of those inventories. Also they investigate whether those are not moving for any specific reasons and solve the problem.
- Inventory analysis help BPBL to find out whether currently they are holding excess inventory or they are in short of inventory. After finding this information they adjust their inventory to meet the forecasted demand and to reduce the cost of excess inventory balance.
- BPBL’s distribution channel is also very good. But they are a bit stricter than their competitor about their credit policy, which is good in a sense that they will have fewer bad debts. On the other hand, they may loss some dealers who will be more interested in doing business with other companies as their credit term is less strict than BPBL. Other than this BPBL has a very effective distribution channel.
- From the ratio analysis of BPBL from 2005 to 2008 it is found that inventory position of BPBL is a bit degraded from 2006. Their current ratio, quick ratio, cash ratio net working capital all are in a decreasing trend. Quick ratio decreases more than that of current ratio, which shows BPBL is holding more inventory than before. This may cause if they are holding much slow moving/obsolete inventory. Also DIH increases after 2006. Though cash conversion cycle decreased their inventory position was better before.
- BPBL installed SAP in their operation from the middle of 2008. As it is a new system in BPBL sometimes they faces problem in adjusting, for example, if a new product is launched and in SAP its code is not listed, the inventory of that product cannot be monitored through SAP.
Recommendation
BPBL has already a very good inventory control system. To make it better here are some recommendations
- As from the ratio analysis it can be assumed that BPBL’s inventory holding is increasing, BPBL should try to reduce the holding of slow moving inventory.
- As BPBL is the market leader in paint industry in Bangladesh, they have customers all over the countries. They should open more sales depots in various locations. If more depots are opened it and will be easier for them to distribute inventory to dealers of different locations from the sales depots.
- BPBL can take a policy that for the dealers; BPBL will only produce the amount of goods as their requirement. It means dealers will place a requirement of goods needed for a month and BPBL will only produce that amount. Also, there would be a contract between the dealers and BPBL that the placed required amount will be actually purchased by the dealer. By doing this BPBL will not have to maintain a large amount of inventory as they already know how much they have to produce.
- If there are some lucrative offers BPBL should be lenient in their credit terms.
Limitation
I have faced some limitation while doing the study. Firstly, there are some confidential data and I could not use those data for publication. Another limitation is time. The time is too short for doing a proper research. Lastly, my lack of experience in real world business situation was a hindrance of faster progress of the study.
Budget
Time Budget: It took 14 weeks to complete the research. 12 weeks was spent for practical work and direct observation in the company. In these 12 weeks I spent 3 weeks to select the topic, 1 week to prepare the questionnaire, 6 weeks for observing and collecting information and 2 week for analysis. I spent other 2 weeks for prepare the report.
Financial Budget: Financial Budget for this study was mainly based on transportation cost, print/photocopy cost. Transportation cost from my home to Berger corporate office for 12 weeks was more or less TK 6000. The other costs such as print outs, photocopies, electricity involve using the computer; internet connection was Tk2000.
Conclusion
From the analysis it is found that Berger paints Bangladesh Limited is maintaining a very good inventory control system, which help them to manage their working capital effectively. The whole system was highly integrated. From the ratio analysis it is found that their inventory level is increasing a bit. BPBL should be concerned in this regard. Some recommendation is provided to improve the system further.