DEFINITION OF MUTUAL FUND:
Mutual Funds are also known as close ended Mutual Funds. The issued capital of a Mutual Fund is limited, that is, a Mutual Fund offers a limited number of certificates for sale to the public. The amount of capital and the number of certificates of each Mutual Fund remains unchanged. ICB Mutual Funds are independent of one another. A Mutual Fund being listed is traded on the Stock Exchanges. Price of Mutual Fund certificates after IPO is determined on the Stock Exchanges through interaction of supply and demand. The market price of a Mutual Fund certificates is available in Stock exchange quotations and in newspapers. .
TYPES OF MUTUAL FUND:
Any Mutual Fund could be of either of the following two kinds. Such as-
Open-end Mutual Fund:
Open-end investment company is a fund that continues to sale and repurchases their shares after their initial public offering. They stand ready to sell additional number of shares and thus keep going larger. The open-end fund company can by or sale their own shares.
Close-end Mutual Fund:
A close-end investment company operates like any other public firm. Their stock is traded on regular secondary market and the market price of its shares is determined by the supply and demand. It has a definite target amount for the found and cannot sell more shares after its initial offering. Its growths in terms of number of shares are issued like any other company’s new issues listed and quoted it stock exchange.
OBJECTIVE OF MUTUAL FUND:
The objective of any fund would fit into one of three broad categories.
Income: The emphasis is on producing a steady flow of dividend payment.
Capital gain: The manager concentrates on increasing the value of principal through appreciation of the stocks held.
Income and capital gain: Some combination of the first two approaches.
ADVANTAGES OF MUTUAL FUND:
- Mutual Fund substantially minimizes the investment risk of small investors through diversification in which funds are spread out into various sectors, companies, securities as well as entirely different market.
- Mutual Fund mobilizes the savings of small investor and channels them into lucrative investment opportunities. As a result, Mutual Fund adds liquidity to the market.
- Mutual Fund provides the small investors access to the whole market that at an individual level, would be difficult if not impossible to achieve.
- Because funds are professionally managed, investors are relieved from the emotional strain associated with the day to day management of the fund.
- The investors save a great deal in transaction costs given that s/he has access to a large number of securities by purchasing a single share of a Mutual Fund.
- Mutual Fund is the only vehicle which operates simultaneously both at the demand as well as the supply side of the market. On the supply side, the Mutual Fund being itself security at the SEC introduces a good and reliable instrument in the capital market for the small but astute investor.
- Mutual Fund is one of the most strictly regulated investment vehicles. The laws governing Mutual Fund require exhaustive disclosure to the SEC as well as the general public. The laws also entail continuous regulations of fund operations by the Trustee.
LAUNCHING OF ICB’S MUTUAL FUNDS:
ICB pioneered the Mutual Fund industry in Bangladesh. The country’s first Mutual Fund, the “First ICB Mutual Fund” was launched on 25 April 1980. Since then ICB had floated eight Mutual Funds of total capital of Tk.17.5 crore up to 1996.All ICB Mutual Funds are close-end Mutual Funds. Investors now perceive ICB Mutual Funds as a rewarding and relatively safe investment vehicle because of its strong and steady performance in terms dividend and portfolio management.
ICB launches eight Mutual Funds in different period with different paid up capital.
| Mutual Fund | Date of Floatation | Paid up capital (Tk. In lack) |
| First ICB Mutual Fund | 25 April,1980 | 50.00 |
| Second ICB Mutual Fund | 17 June,1984 | 50.00 |
| Third ICB Mutual Fund | 19 May,1985 | 100.00 |
| Fourth ICB Mutual Fund | 6 June, 1985 | 100.00 |
| Fifth ICB Mutual Fund | 8 June, 1987 | 150.00 |
| Sixth ICB Mutual Fund | 16 May,1988 | 500.00 |
| Seven ICB Mutual Fund | 30 June,1995 | 300.00 |
| Eighth ICB Mutual Fund | 23 July,1996 | 500.00 |
| Total 1750.00 | ||
Figure: Paid-up capital of eight ICB Mutual Fund
Here we see that 6th & 8th ICB Mutual Fund is the highest paid-up capital (Tk. 500.00 lac)
Operational Result:
Name of the Fund | Net Income (tk. In Lac) | Distributable income Per certificate (Taka) | Ex-dividend Intrinsic value per Certificate (Taka) |
| First ICB mutual fund | 423.33 | 1006.53 | 9877.68 |
| Second ICB mutual fund | 127.43 | 519.78 | 2788.41 |
| Third ICB mutual fund | 184.38 | 376.89 | 2190.38 |
| Fourth ICB mutual fund | 177.72 | 368.20 | 2387.84 |
| Fifth ICB mutual fund | 213.52 | 220.71 | 2036.43 |
| Sixth ICB mutual fund | 453.33 | 134.80 | 748.85 |
| Seventh ICB mutual fund | 299.62 | 155.77 | 1180.13 |
| Eighth ICB mutual fund | 463.64 | 137.17 | 864.95 |
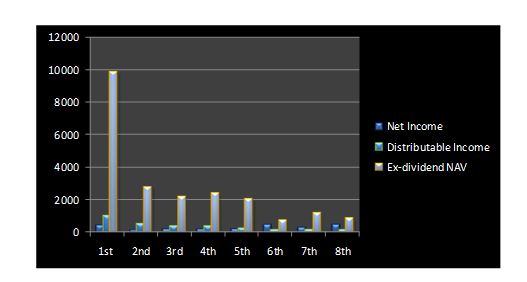
Here we see that, maximum Net Income comes from 8th ICB Mutual Fund 463.64; maximum Distribute Income per certificates comes from 1st ICM Mutual Fund 1006.53; and Ex-dividend intrinsic value per certificate comes from 1st ICB Mutual Fund 9877.68
CONSOLIDATED PORTFOLIO STATEMENT:
As on 30 June 2010 cost price and market price of eight Mutual Funds were Tk. 8006.72 lac and Tk 32058.21 lac respectively. A consolidated statement of the portfolio of the Funds is given in the following table:
Consolidated position of portfolios of ICB Mutual Funds as on June 2010
| Sl.no. | Particulars | 1st Mutual Fund | 2nd Mutual Fund | 3rd Mutual Fund | 4th Mutual Fund | 5th Mutual Fund | 6th Mutual Fund | 7th Mutual Fund | 8th Mutual Fund |
| 1 | No. of Companies | 122 | 120 | 140 | 139 | 153 | 187 | 181 | 172 |
| 2 | No. of Securities | 124 | 123 | 141 | 141 | 155 | 189 | 182 | 177 |
| 3 | Total investment at cost (Tk. In Lac) | 887.70 | 612.98 | 698.25 | 748.52 | 952.61 | 1225.85 | 1341.95 | 1538.86 |
| 4 | Market Value | 7791.87 | 1782.44 | 2547.87 | 2784.04 | 3662.00 | 4162.39 | 4324.86 | 5002.74 |
Portfolio Position, Market Price per Certificate and Number of Certificate Holders: (as on 30 June 2010)
Name of the Fund | Cost of portfolio (Tk. In Lac) | Market Value of the portfolio (Tk. In Lac) | Market price per certificate (Taka) | No. of Certificate-holders |
| First ICB mutual fund | 887.70 | 7791.87 | 8701.00 | 1105 |
| Second ICB mutual fund | 312.98 | 1782.44 | 2578.75 | 1093 |
| Third ICB mutual fund | 698.25 | 2547.87 | 1972.50 | 1502 |
| Fourth ICB mutual fund | 748.52 | 2784.04 | 2139.75 | 1253 |
| Fifth ICB mutual fund | 952.61 | 3662.00 | 1763.00 | 2560 |
| Sixth ICB mutual fund | 1225.85 | 4162.39 | 647.75 | 6385 |
| Seventh ICB mutual fund | 1341.95 | 4324.86 | 1063.00 | 2383 |
| Eighth ICB mutual fund | 1538.86 | 5002.74 | 755.50 | 6735 |
| Total | 8006.72 | 32058.21 |
| 23016 |
PRICE MOVEMENT AND TRANSACTIONS:
During the year under review, certificates of eight Mutual Funds were actively traded on the floor of the Dhaka Stock Exchange Ltd and Chittagong Stock Exchange Ltd. The highest and lowest price of the eight Mutual Funds certificates on Dhaka Stock Exchange Ltd and position of total transaction during 2009-10 are shown in the following table:
Market prices of ICB Mutual Funds and Transactions during 2009-10
| Sl. No | Mutual Funds | Highest market price (Taka) | Lowest market price (Taka) | Closing Market Price (Tk as on30 June 2010 |
| 1 | First ICB Mutual Fund | 9450.00 | 5790.00 | 8701.00 |
| 2 | Second ICB Mutual Fund | 1100 | 721 | 2578.75 |
| 3 | Third ICB Mutual Fund | 690 | 460.50 | 1972.50 |
| 4 | Fourth ICB Mutual Fund | 700 | 458 | 2139.75 |
| 5 | Fifth ICB Mutual Fund | 465 | 200 | 1763.00 |
| 6 | Sixth ICB Mutual Fund | 350 | 175 | 647.75 |
| 7 | Seven ICB Mutual Fund | 320 | 165.25 | 1063.00 |
| 8 | Eight ICB Mutual Fund | 316 | 162 | 755.50 |
Here we see that, 1st ICB Mutual Fund’s rate was highest price in the capital market and the amount is Tk. 9450, lowest market price in year of 2009-10 is 8th ICB Mutual Fund and the amount is Tk. 162. Maximum closing price Tk. 8701 (1st ICB Mutual Fund) and minimum closing price is Tk. 647.75 (6th ICB Mutual Fund).
FUNCTIONS OF ICB MUTUAL FUNDS DEPARTMENT:
Mutual portfolio formation and floating decision taken by ICB with the approval of the management EBR department decides holding category considering capital, portfolio risk, income trend, and risk diversified uniform income and growth. After all these decision security to be held are collected from IPO, Debenture issue, Secondary market etc. ICB helps sometime giving security at discount rate or at face value. Then the Fund is registered with SEC and listed with DSE and CSE. However after public issue, the fund portfolio is handed over to funds division for management operation. For purpose the Mutual Fund department has to perform the following activities mainly:
- Renunciation and issue of certificate.
- Maintain the register of the certificate holders.
- Transfer certificate if applied for after verifying transferee signature.
- Register the name of the transferee after getting approval from competent authority.
- Prepare dividend list and issue and mail dividend warrant as decided by the board.
- Record/ correct changes of address if applied.
- Reissue certificate after confirming loss and mark transfer restriction of the lost certificate, if applied for and also inform DSE & CSE on revision of the following document submitted by the loser.
REGULATORY SET-UP OF ICB’S MUTUAL FUNDS:
When ICB took the initiative of floating mutual fund in Bangladesh, there was no organized and recognized regulatory set-up for managing of mutual funds in Bangladesh. ICB had to formulate the necessary regulatory set-up and rules for the management of mutual funds. The regulatory set-up for ICB mutual funds is explicitly explained in the ICB Regulation-1977. The main features of this regulatory set-up are mentioned below:
- The Corporation may from constitute of ICB mutual funds of such denominations and securities in such each case as the board may determine.
- ICB mutual fund certificates will be listed and quoted in the stock exchange in Bangladesh and the board may determine subject to the permission of the stock exchange.
- ICB mutual funds certificate shall be movable property and freely transferable.
- ICB Mutual Fund certificate will be sold or offered for subscription with the prior consent of the government.
MANAGEMENT OF THE FUNDS:
There is a decision making board in order to manage different Mutual Funds. As per board’s decision securities are bought under different Mutual Funds. At the same way securities are sold. In case of new Mutual Fund subscribes for public issue.
ICB authority is made portfolio earlier by its own finance and given it name. After that it is published on any newspaper as prospectus. By studying this prospectus public response whether they will buy the Mutual Fund or not.
FLOATATION OF NEW MUTUAL FUNDS:
When ICB floats a new mutual fund, it is announced through publication of prospectus in two widely circulated newspapers. An investor has to apply for the shares of new mutual fund by filling in prescribed application form that can be collected from ICB officers and other attorney banks. Sometimes allotment is done by lottery draw.10% of any new mutual fund is served for non-Bangladeshi. Any Bangladeshi living abroad can collect from Bangladesh mission abroad or from authorized bank branches or from web site.
HOW TO BUY EXISTING MUTUAL FUNDS:
An investor can purchase any of the existing eight ICB Mutual Funds certificates through the Stock Exchanges at the prevailing Market Price. However, if an investor buys Mutual Fund certificates through the Stock Exchanges he/she must be careful to submit the certificates along with duly filled-in transfer deed at ICB Head Office to ensure that the certificates are registered in his/her name.
ADVANCES AGAINST MUTUAL FUND CERTIFICATES SCHEME:
Advance against ICB Mutual Fund certificates Scheme was introduced in 2003, designed for the ICB Mutual Fund Certificate holders to meet their emergency fund requirement. One can borrow maximum of 50% value of last one year’s weighted average market price of certificates at time of borrowing by depositing his/her certificates under lien arrangement from any of the ICB offices. The rate of interest on the loan is reasonable and also competitive.
MANAGEMENT FEE, CHARGE ETC.:
At present management fee @ 1% on the paid up capital of the Fund is charged annually. No amount is charged on account of custodial and trust services. Part of operating expenses are charged to the respective Mutual Funds on pro rata basis
ASSETS OF ICB MUTUAL FUNDS:
ICB Mutual Funds Certificates holders shall have unfettered ownership in the assets of the Fund to which they are related. In case of winding up of the Corporation the assets belonging to any ICB Mutual Fund shall not be treated as the assets of the Corporation.
TAX CONCESSIONS:
- Ø Investment in Certificates provides the same tax exemptions as an investment qualifying under Section 44 of the Income Tax Ordinance, 1984.
- Ø Capital gains received on investment in the Fund Certificates shall not be included in the total income of a Certificate holder within the limits specified in the Income Tax Ordinance, 1984.
- Ø Dividends received on investment in the Fund will be treated as dividend income under Income Tax Act, and will be exempted from tax with the limits specified in the Act.
- Ø The Fund incomes are to be exempted from all taxes as granted by the Government as per SRO No 80-L/80 dated April, 1980.
DECLARATION OF DIVIDEND:
The net income received on investments of Funds on account of dividend, bonus, interest, capital gain etc. are distributed amongst the Certificate holders as per decision of the Board of Directors of ICB. Board declares such income in the form of dividend at the end of July each year. Dividends declared by ICB in the past on the Mutual Funds were very attractive. The year-wise per certificate dividend performance of the Funds is given below.
Rate of the Dividend per Certificate (Taka)
| Year | Eight Mutual Funds | |||||||
| 1 st | 2 nd | 3 rd | 4 th | 5 th | 6 th | 7 th | 8 th | |
| 1980-81 | 20 | |||||||
| 1981-82 | 20 | |||||||
| 1982-83 | 20 | |||||||
| 1983-84 | 25 | |||||||
| 1984-85 | 35 | 21 | ||||||
| 1985-86 | 38 | 23 | 21 | |||||
| 1986-87 | 41 | 25.5 | 22.5 | 21.5 | ||||
| 1987-88 | 48 | 28 | 25.5 | 23 | 20 | |||
| 1988-89 | 49 | 29 | 26 | 23.5 | 20.5 | 15.5 | ||
| 1989-90 | 49 | 29 | 26 | 23 | 20.5 | 13.25 | ||
| 1990-91 | 35 | 22 | 19 | 17 | 10 | 6 | ||
| 1991-92 | 31 | 22 | 19 | 18 | 11 | 6 | ||
| 1992-93 | 31 | 21 | 18 | 17 | 12 | – | ||
| 1993-94 | 45 | 27 | 22 | 40 | 25 | 16 | ||
| 1994-95 | 50 | 40 | 27 | 41 | 28 | 18 | ||
| 1995-96 | 60 | 42 | 28 | 41 | 30 | 20 | 18 | |
| 1996-97 | 70 | 45 | 38 | 45 | 35 | 24 | 21 | 18 |
| 1997-98 | 70 | 30 | 35 | 32 | 22 | 18 | 14 | 12 |
| 1998-99 | 100 | 32 | 38 | 35 | 20 | 15 | 13 | 12 |
| 1999-2000 | 125 | 35 | 40 | 36 | 21 | 16 | 13.5 | 12.5 |
| 2000-2001 | 170 | 40 | 45 | 38 | 23 | 17 | 14 | 13 |
| 2001-2002 | 175 | 42 | 50 | 40 | 24 | 17.50 | 14.50 | 13.50 |
| 2002-2003 | 180 | 45 | 50 | 40 | 24 | 17.50 | 14.50 | 13.50 |
| 2003-2004 | 200 | 50 | 50 | 45 | 24 | 17.50 | 15 | 14 |
| 2004-2005 | 210 | 55 | 52 | 48 | 27 | 18.50 | 16 | 15 |
| 2005-2006 | 210 | 55 | 52 | 48 | 27 | 18.50 | 16 | 15 |
| 2006-2007 | 190 | 62 | 56 | 52 | 33 | 23 | 22.50 | 18 |
| 2007-2008 | 265 | 75 | 65 | 60 | 45 | 30 | 30 | 25 |
| 2008-2009 | 310 | 95 | 85 | 80 | 56 | 37 | 35 | 32 |
| 2009-2010 | 400 | 200 | 140 | 125 | 100 | 75 | 70 | 65 |
Dividend Performance: (Tk. per Certificate)
Mutual Funds | Financial Year | ||
2007-08 | 2008-09 | 2009-10 | |
| First ICB mutual fund | 265.00 | 310.00 | 400.00 |
| Second ICB mutual fund | 75.00 | 95.00 | 200.00 |
| Third ICB mutual fund | 65.00 | 85.00 | 140.00 |
| Fourth ICB mutual fund | 60.00 | 80.00 | 125.00 |
| Fifth ICB mutual fund | 45.00 | 56.00 | 100.00 |
| Sixth ICB mutual fund | 30.00 | 37.00 | 75.00 |
| Seventh ICB mutual fund | 30.00 | 32.00 | 70.00 |
| Eighth ICB mutual fund | 25.00 | 32.00 | 65.00 |
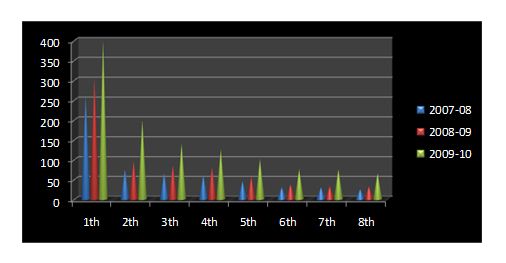
Here we see that, all Mutual Funds’ in every year increases the dividend. It is a good sign for a company and may be growth day by day. It’s very important things for investors. Sometimes it shows the future growth, and the investors are confident on the fund. In every year 1st ICB Mutual Fund declared the maximum dividend for the share holders.
DETAILS DESCRIPTION OF ICB’S EIGHT MUTUAL FUND:
First ICB Mutual Fund:
The 1st ICB Mutual Fund was floated at 25th April, 1980. It is the most attractive mutual fund among the others.
Dividend and Interest income:
The Fund had earned dividend of Tk. 85.70 lac from 47 securities during 2009-2010 of which a sum of Tk. 74.69 lac (87.15 percent) was received in cash within 30June 2010.
Capital Gains on Sale of Investments:
During 2009-10, the Fund earned Tk. 375.65 lac as capital gains by securities of 78 companies as shown in the following table:
| Sl. No | Name of the company | No. of Securities sold | Capital gain(taka) |
| 1 | Bangladesh Finance & Inv. Co. Ltd. | 1650 | 1101475.18 |
| 2 | Bangladesh Industrial Fin. Co. Ltd. | 100 | 67413.22 |
| 3 | Bay Leasing & Investment Ltd. | 200 | 266800.00 |
| 4 | Delta Brac Housing Fin. Cor. Ltd. | 400 | 683987.48 |
| 5 | Fidelity Assets & Securities Co. Ltd. | 1400 | 298376.93 |
| 6 | First Leasing International Ltd. | 100 | 118762.63 |
| 7 | IPDC | 400 | 68357.24 |
| 8 | IDLC | 700 | 775449.99 |
| 9 | ILFSL | 200 | 230701.88 |
| 10 | National Housing Fin & Investment Ltd | 200 | 198600.00 |
| 11 | PLFSL | 1200 | 413874.98 |
| 12 | Phoenix Fin. & Inv. Ltd. | 1950 | 697621.39 |
| 13 | Premier Leasing & Fin. Ltd. | 1700 | 356453.44 |
| 14 | Union Capital Ld | 4000 | 505879.20 |
| 15 | United Leasing Co. Ltd | 480 | 534669.63 |
| 16 | Al-Arafah Islami Bank Ltd | 1500 | 192477.40 |
| 17 | Bank Asia Ltd | 100 | 43174.41 |
| 18 | Brac Bank Ltd | 500 | 284379.37 |
| 19 | Dhaka Bank Ltd | 400 | 177954.68 |
| 20 | EXIM Bank Ltd | 1800 | 322914.64 |
| 21 | Mercantile Bank Ltd | 800 | 139668.34 |
| 22 | Mutual Trust Bank Ltd | 2300 | 579263.10 |
| 23 | One Bank Ltd | 50 | 22821.58 |
| 24 | Premier Bank Ltd | 3400 | 995594.33 |
| 25 | Shahjalal Islami Bank Ltd | 1400 | 407949.43 |
| 26 | Social Islami Bank Ltd | 300 | 87963.37 |
| 27 | Southeast Bank Ltd | 1600 | 308880.64 |
| 28 | Standard Bank Ltd | 300 | 48704.82 |
| 29 | First Security Islami Bank Ltd | 2600 | 286869.94 |
| 30 | EBL First MF | 56000 | 1029550.00 |
| 31 | Grameen One: Scheme Two | 2000 | 87100.00 |
| 32 | Trust Bank Ltd | 500 | 182614.70 |
| 33 | ICB AMCL Second MF | 150 | 25000.00 |
| 34 | ICB AMCL Second NRB MF | 200 | 23600.00 |
| 35 | Prime Bank First ICB AMCL MF | 2500 | 36250.00 |
| 36 | Prime Finance First MF | 1000 | 34000.00 |
| 37 | Trust Bank First MF | 5000 | 85500.00 |
| 38 | BSRM Steel Ltd | 1500 | 1149037.50 |
| 39 | Golden Son Ltd | 7000 | 324150.00 |
| 40 | Apex Foods Ltd | 945 | 874937.49 |
| 41 | BATBC | 500 | 167902.45 |
| 42 | Rahima Food | 3500 | 402436.25 |
| 43 | BOC | 1700 | 573786.59 |
| 44 | DESCO | 400 | 314453.88 |
| 45 | Jamuna Oil | 17100 | 3093632.74 |
| 46 | Meghna Petroleum | 7500 | 867665.56 |
| 47 | Padma Oil | 200 | 304900.00 |
| 48 | Power Grid | 200 | 114209.86 |
| 49 | Titas Gas | 100 | 50524.10 |
| 50 | AlltexInd. | 1150 | 72253.38 |
| 51 | Makson Spinning | 1000 | 88458.80 |
| 52 | Metro Spinning | 3500 | 236232.40 |
| 53 | Monno Fabrics | 2000 | 50231.70 |
| 54 | Prime Textile Spinning Mills | 3500 | 742123.75 |
| 55 | RN Spinning | 300 | 125800.00 |
| 56 | The Dhaka Dyeing | 14000 | 675500.00 |
| 57 | Beximco Pharma | 1200 | 200646.32 |
| 58 | Glaxo Smithkline BD | 4800 | 3270620.00 |
| 59 | Imam Button | 350 | 201512.50 |
| 60 | Marico BD | 3400 | 767300.00 |
| 61 | Reckitt Benckiser | 2700 | 3176476.37 |
| 62 | Square Pharma | 100 | 89323.65 |
| 63 | Lafarge Surma Cement | 1000 | 69019.90 |
| 64 | Bangladesh Online | 1000 | 103254.30 |
| 65 | RAK Ceramics BD | 400 | 68300.00 |
| 66 | Shinepukur Ceramics | 600 | 8479.98 |
| 67 | Agrani Insurance | 2800 | 265021.44 |
| 68 | Aisa Insurance | 1000 | 393400.00 |
| 69 | Asia Pacific General Insurance | 1200 | 427146.00 |
| 70 | Continental Insurance | 1200 | 368995.72 |
| 71 | Dhaka Insurance | 150 | 127600.00 |
| 72 | Green Delta Insurance | 100 | 35900.00 |
| 73 | Islami Insurance Bd | 350 | 138600.00 |
| 74 | Mercantile Insurance | 100 | 22712.50 |
| 75 | Nitol Insurance | 450 | 108985.72 |
| 76 | Provati Insurance | 150 | 77450.00 |
| 77 | Rupali Life Insurance | 250 | 378962.50 |
| 78 | Grameen Phone | 19400 | 3274820.00 |
| 79 | Bangladesh Shipping Corporation | 400 | 2141750.00 |
| Total | 37565167.38 | ||
Here we see that, the maximum capital gain came from the company of Grameen Phone Ltd. Total no. of securities 19400 and the amount is Tk. 3,274,820.00
Income, Expenses and Distributable Income:
| Particulars | Taka(Lac) | Taka(Lac) |
| Dividend IncomeInterest income on Bank deposits Capital gain & other income Gross Income…… Total expense…… (commission and brokerage, printing and stationery, postage, Bank charges, provision against investments and others) Net income………… Previous year’s undistributed income Net distributable income Distributable income per certificate | 85.707.99 375.65
|
469.34 (423.33) |
| 46.01331.57 | ||
| 754.901006.53 |
Dividend:
The Fund declared dividend at the rate of 400 percent per certificate including 310 percent for the previous year. After making provision of Tk. 300 lac for payment of dividend the Fund had an undistributed income of Tk 454.90 lac. The Year –wise dividend performance of the Fund is shown in the following table:
Year –wise dividend Performance
| Financial Year | Dividend Per Certificate | Financial Year | Dividend Per Certificate |
| 1980-81 | 20 | 1995-96 | 55 |
| 1981-82 | 20 | 1996-97 | 60 |
| 1982-83 | 20 | 1995-96 | 60 |
| 1983-84 | 25 | 1996-97 | 70 |
| 1984-85 | 35 | 1997-98 | 70 |
| 1985-86 | 38 | 1998-99 | 100 |
| 1986-87 | 41 | 1999-00 | 125 |
| 1987-88 | 48 | 2000-01 | 170 |
| 1988-89 | 49 | 2001-02 | 175 |
| 1989-90 | 49 | 2002-03 | 180 |
| 1990-91 | 35 | 2003-04 | 200 |
| 1991-92 | 31 | 2004-05 | 210 |
| 1992-93 | 31 | 2005-06 | 210 |
| 1993-94 | 45 | 2006-07 | 190 (1B:2) |
| 1994-95 | 50 | 2007-08 | 265 |
| 2008-09 | 310 | ||
| 2009-10 | 400 |
Portfolio:
During 2009-10, the fund made investments of Tk. 168.43 lac in securities of 24 companies. As on 30 June 2010 the Fund had securities of 122 companies in its portfolio with a total cost of Tk. 887.70 lac, the market value of which was Tk. 7791.87 lac. Details of the portfolio of the Fund as on 30 June 2009 were Tk. 770,047,230.70
The ex-dividend net asset value per certificate of Tk. 100.00 each of First Mutual Fund stood at Tk. 9877.68 as on 30 June 2010.
The opening and closing market price per certificate of First ICB Mutual Fund of Tk. 100.00 each of the fund was Tk.5783.00 and Tk. 8701.00 as respectively in 2009-10.
The number of certificate holders of the fund was 1105 as on 30 June 2010.
Second ICB Mutual Fund:
The 2nd ICB Mutual Fund was floated at 17 June 1984.
Dividend and Interest income:
The Fund had earned an amount of Tk. 29.67 lac as dividend and interest from 44 securities during 2009-2010 of which, Tk. 26.81 lac (90.50 percent) was received in cash within 30June 2010.
Capital Gains on Sale of Investments:
During 2009-10, the Fund earned Tk. 247.65 lac as capital gains by securities of 79 companies and total capital gain is Tk. 24,765,105.64.
Here, the maximum capital gain came from the company of Grameen Phone Ltd. Total no. of securities 14600 and the amount is Tk. 2,494,140.00
Income, Expenses and Distributable Income:
| Particulars | Taka(Lac) | Taka(Lac) |
| Dividend IncomeInterest income on Bank deposits Capital gains & Other income Gross Income……… Total expense……… (commission and brokerage, printing and stationery, postage, Bank charges, provision against investments and others) Net income…………
Previous year’s undistributed income Net distributable income Distributable income per certificate | 29.675.21 247.65
|
282.56 (155.10) |
| 127.43
132.46 | ||
| 259.89519.78 |
Dividend:
The Fund declared dividend at the rate of Tk. 200 per certificate of Tk. 100.00 each for the year 2009-10, which was Tk. 95.00 per certificate in the previous year. After making provision of Tk. 100.00 lac for payment of dividend the Fund had an undistributed income of Tk. 159.89 lac .The Year –wise dividend performance of the Fund is shown in the following table
Year –wise dividend Performance
| Financial Year | Dividend Per Certificate | Financial Year | Dividend Per Certificate |
| 1984-85 | 21 | 1997-98 | 30 |
| 1985-86 | 23 | 1998-99 | 32 |
| 1986-87 | 25 | 1999-2000 | 35 |
| 1987-88 | 28 | 2000-01 | 40 |
| 1988-89 | 29 | 2001-02 | 42 |
| 1989-90 | 29 | 2002-03 | 45 |
| 1990-91 | 22 | 2003-04 | 50 |
| 1991-92 | 22 | 2004-05 | 55 |
| 1992-93 | 21 | 2005-06 | 55 |
| 1993-94 | 27 | 2006-07 | 62 |
| 1994-95 | 40 | 2007-08 | 75 |
| 1995-96 | 42 | 2008-09 | 95 |
| 1996-97 | 45 | 2009-10 | 200 |
Portfolio:
During 2009-10, the fund made investments of Tk. 119.06 lac in securities of 24 companies. As on 30 June 2010 the Fund had securities of 120 companies in its portfolio with a total cost of Tk. 612.98 lac, the market value of which was Tk. 1782.44 lac. Details of the portfolio of the Fund as on 30 June 2010 were Tk. 174510768.45
The ex-dividend net asset value per certificate of Tk. 100.00 each of First Mutual Fund stood at Tk. 2788.41 as on 30 June 2010.
The opening and closing market price per certificate of First ICB Mutual Fund of Tk. 100.00 each of the fund was Tk.2244.75 and Tk. 2578.75 as respectively in 2009-10.
The number of certificate holders of the fund was 1093 as on 30 June 2010.
Third ICB Mutual Fund:
The 3rd ICB Mutual Fund was floated at 19 May 1985.
Dividend and Interest income:
The Fund had earned dividend of Tk. 36.41 lac from 53 securities during 2009-2010 of which a sum of Tk. 32.46 lac (89.15 percent) was received in cash within 30June 2010.
Capital Gains on Sale of Investments:
During 2009-10, the Fund earned Tk. 261.02 lac as capital gains by securities of 76 companies and total capital gain is Tk. 26,102,001.85
Here, the maximum capital gain came from the company of Jamuna Oil Co. Ltd. Total no. of securities 15800 and the amount is Tk. 2,544,718.3
Income, Expenses and Distributable Income:
| Particulars | Taka (Lac) | Taka (Lac) |
| Dividend IncomeInterest income on Bank deposits Capital gains Gross Income…….. Total expense…….. (commission and brokera9ge, printing and stationery, postage, Bank charges, provision against investments and others) Net income………
Previous year’s undistributed income Net distributable income Distributable income per certificate | 36.415.38 261.02 |
302.81 (118.43) |
| 184.38 192.51 | ||
| 376.89376.89 |
Dividend:
The Fund declared dividend at the rate of Tk. 114.00 per certificate of Tk. 100.00 each for the year 2009-10, which was Tk. 85.00 per certificate in the previous year. After making provision of Tk 140.00 lac for payment of dividend the Fund had an undistributed income of Tk. 236.89 .The Year –wise dividend performance of the Fund is shown in the following table
Year –wise dividend Performance
| Financial Year | Dividend Per Certificate | Financial Year | Dividend Per Certificate |
| 1985-86 | 21 | 1997-98 | 35 |
| 1986-87 | 22.50 | 1998-99 | 38 |
| 1987-88 | 25.50 | 1999-2000 | 40 |
| 1988-89 | 26 | 2000-01 | 45 |
| 1989-90 | 26 | 2001-02 | 50 |
| 1990-91 | 19 | 2002-03 | 50 |
| 1991-92 | 19 | 2003-04 | 50 |
| 1992-93 | 18 | 2004-05 | 52 |
| 1993-94 | 22 | 2005-06 | 52 |
| 1994-95 | 27 | 2006-07 | 56 |
| 1995-96 | 28 | 2007-08 | 65 |
| 1996-97 | 38 | 2008-09 | 85 |
| 2009-10 | 140 |
Portfolio:
During 2009-10, the fund made investments of Tk. 121.36 lac in securities of 23 companies. As on 30 June 2010 the Fund had securities of 140 companies in its portfolio with a total cost of Tk. 698.25 lac, the market value of which was Tk. 2547.87 lac.
The ex-dividend net asset value per certificate of Tk. 100.00 each of First Mutual Fund stood at Tk. 2190.38 as on 30 June 2010.
During 2009-10, the opening and closing market price per certificate of First ICB Mutual Fund of Tk. 100.00 each of the fund was Tk.921.22 and Tk. 1972.50. The number of certificate holders of the fund was 1502 as on 30 June 2010.
Fourth ICB Mutual Fund:
The 4th ICB Mutual Fund was floated at 06 June1986.
Dividend and Interest income:
The Fund had earned dividend of Tk. 45.89 lac from 59 securities during 2009-2010 of which a sum of Tk. 38.43 lac (8374 percent) was received in cash within 30June 2010.
Capital Gains on Sale of Investments:
During 2009-10, the Fund earned Tk. 339.80 lac as capital gains by securities of 75 companies and the total capital gain is Tk. 33,980,324.19
Here, the maximum capital gain came from the company of Jamuna Oil Co. Ltd. Total no. of securities 16200 and the amount is Tk. 2,929,054.91
Income, Expenses and Distributable Income:
| Particulars | Taka (Lac) | Taka (Lac) |
| Dividend IncomeInterest income on Bank deposits Capital gains & Other income Gross Income…….. Total expense……… (commission and brokerage, printing and stationery, postage, Bank charges, provision against investments and others) Net income………… Previous year’s undistributed income Net distributable income Distributable income per certificate | 45.896.30 339.80
|
391.99 (214.27) |
| 177.72190.48 | ||
| 368.20368.20 |
Dividend:
The Fund declared dividend at the rate of Tk. 125.00 per certificate of Tk. 100.00 each for the year 2009-10, which was Tk. 80.00 per certificate in the previous year. After making provision of Tk. 125.00 lac for payment of dividend the Fund had an undistributed income of Tk. 243.20 lac .The Year –wise dividend performance of the Fund is shown in the following table:
Year –wise dividend Performance
| Financial Year | Dividend Per Certificate | Financial Year | Dividend Per Certificate |
| 1986-87 | 21.5 | 1998-99 | 35 |
| 1987-88 | 23 | 1999-2000 | 36 |
| 1988-89 | 23.50 | 2000-01 | 38 |
| 1989-90 | 23 | 2001-02 | 40 |
| 1990-91 | 17 | 2002-03 | 40 |
| 1991-92 | 18 | 2003-04 | 45 |
| 1992-93 | 17 | 2004-05 | 48 |
| 1993-94 | 40 | 2005-06 | 48 |
| 1994-95 | 41 | 2006-07 | 52 |
| 1995-96 | 41 | 2007-08 | 60 |
| 1996-97 | 45 | 2008-09 | 80 |
| 1997-98 | 32 | 2009-10 | 125 |
Portfolio:
During 2009-10, the fund made investments of Tk. 121.32 lac in securities of 23 companies. As on 30 June 2010 the Fund had securities of 141 companies in its portfolio with a total cost of Tk. 748.52 lac, the market value of which was Tk. 2784.04 lac.
The ex-dividend net asset value per certificate of Tk. 100.00 each of First Mutual Fund stood at Tk. 2387.84 as on 30 June 2010.
The opening and closing market price per certificate of First ICB Mutual Fund of Tk. 100.00 each of the fund was Tk.1236.25 and Tk. 2139.75 as respectively in 2009-10. The number of certificate holders of the fund was 1253 as on 30 June 2010.
Fifth ICB Mutual Fund:
The 5th ICB Mutual Fund was floated at 08 June 1987.
Dividend and Interest income:
The Fund had earned dividend of Tk. 59.84 lac from 58 securities during 2009-2010 of which a sum of Tk. 51.34 lac (85.80 percent) was received in cash within 30June 2010.
Capital Gains on Sale of Investments:
During 2009-10, the Fund earned Tk. 386.03 lac as capital gains by securities of 78 companies and the total capital gain is Tk. 38,602,780.47
Here, the maximum capital gain came from the company of Jamuna Oil Co. Ltd. Total no. of securities 16800 and the amount is Tk. 2,899,439.4
Income, Expenses and Distributable Income:
| Particulars | Taka (Lac) | Taka (Lac) |
| Dividend IncomeInterest income on Bank deposits Capital gains & Other income Gross Income…… Total expense…… (commission and brokerage, printing and stationery, postage, Bank charges, provision against investments and others) Net income……… Previous year’s undistributed income Net distributable income Distributable income per certificate | 59.846.19 386.03
|
451.70 (238.18) |
| 213.52117.54 | ||
| 331.06220.71 |
Dividend:
The Fund declared dividend at the rate of Tk. 100.00 per certificate of Tk. 100.00 each for the year 2009-10, which was Tk. 56.00 per certificate in the previous year. After making provision of Tk. 150.00 for payment of dividend the Fund had an undistributed income of Tk. 181.06 .The Year –wise dividend performance of the Fund is shown in the following table:
Year –wise dividend Performance
| Financial Year | Dividend Per Certificate | Financial Year | Dividend Per Certificate |
| 1987-88 | 20 | 1998-99 | 20 |
| 1988-89 | 20.50 | 1999-2000 | 21 |
| 1989-90 | 20.50 | 2000-01 | 23 |
| 1990-91 | 10 | 2001-02 | 24 |
| 1991-92 | 11 | 2002-03 | 24 |
| 1992-93 | 12 | 2003-04 | 24 |
| 1993-94 | 25 | 2004-05 | 27 |
| 1994-95 | 28 | 2005-06 | 27 |
| 1995-96 | 30 | 2006-07 | 33 |
| 1996-97 | 35 | 2007-08 | 45 |
| 1997-98 | 22 | 2008-09 | 56 |
| 2009-10 | 100 |
Portfolio:
During 2009-10, the fund made investments of Tk. 159.93 lac in securities of 20 companies. As on 30 June 2010 the Fund had securities of 153 companies in its portfolio with a total cost of Tk. 952.61 lac, the market value of which was Tk. 3662.00 lac.
The ex-dividend net asset value per certificate of Tk. 100.00 each of First Mutual Fund stood at Tk. 2036.43 as on 30 June 2010.
The opening and closing market price per certificate of First ICB Mutual Fund of Tk. 100.00 each of the fund was Tk.1230.00 and Tk. 1763.00 as respectively in 2009-10. The number of certificate holders of the fund was 2560 as on 30 June 2010.
Sixth ICB Mutual Fund:
The 6th ICB Mutual Fund was floated at 16 May 1988.
Dividend and Interest income:
The Fund had earned dividend of Tk. 59.70 lac from 69 securities during 2009-2010 of which a sum of Tk. 55.69 lac (93.28 percent) was received in cash within 30June 2010.
Capital Gains on Sale of Investments:
During 2009-10, the Fund earned Tk. 501.23 lac as capital gains by securities of 83 companies and the total capital gain is Tk. 50,122,888.36
Here, the maximum capital gain came from the company of Grameen Phone Ltd. Total no. of securities 23200 and the amount is Tk. 3,961,700.00
Income, Expenses and Distributable Income:
| Particulars | Taka (Lac) | Taka (Lac) |
| Dividend IncomeInterest income on Bank deposits Capital gains Gross Income……… Total expense……… (commission and brokerage, printing and stationery, postage, Bank charges, provision against investments and others) Net income……… Previous year’s undistributed income Net distributable income Distributable income per certificate | 59.708.74 501.23
|
569.67 (116.34) |
| 453.33220.65 | ||
| 673.98138.80 |
Dividend:
The Fund declared dividend at the rate of Tk. 75.00 per certificate of Tk. 100.00 each for the year 2009-10, which was Tk. 37.00 per certificate in the previous year. After making provision of Tk. 375.00 lac for payment of dividend the Fund had an undistributed income of Tk. 298.98 .The Year –wise dividend performance of the Fund is shown in the following table:
Year –wise dividend Performance
| Financial Year | Dividend Per Certificate | Financial Year | Dividend Per Certificate |
| 1988-89 | 15.50 | 1999-2000 | 16 |
| 1989-90 | 13.25 | 2000-01 | 17 |
| 1990-91 | 6 | 2001-02 | 17.50 |
| 1991-92 | 6 | 2002-03 | 17.50 |
| 1992-93 | – | 2003-04 | 17.50 |
| 1993-94 | 16 | 2004-05 | 18.50 |
| 1994-95 | 18 | 2005-06 | 18.50 |
| 1995-96 | 20 | 2006-07 | 23 |
| 1996-97 | 24 | 2007-08 | 30 |
| 1997-98 | 18 | 2008-09 | 37 |
| 1998-99 | 15 | 2009-10 | 75 |
Portfolio:
During 2009-10, the fund made investments of Tk. 291.08 lac in securities of 23 companies. As on 30 June 2010 the Fund had securities of 187 companies in its portfolio with a total cost of Tk. 1225.85 lac, the market value of which was Tk. 4162.39 lac.
The ex-dividend net asset value per certificate of Tk. 100.00 each of First Mutual Fund stood at Tk. 748.85 as on 30 June 2010.
The opening and closing market price per certificate of First ICB Mutual Fund of Tk. 100.00 each of the fund was Tk.679.25 and Tk. 647.75 as respectively in 2009-10. The number of certificate holders of the fund was 6385 as on 30 June 2010.
Seventh ICB Mutual Fund:
The 7th ICB Mutual Fund was floated at 30 June 1995.
Dividend and Interest income:
The Fund had earned dividend of Tk. 72.05 lac from 70 securities during 2009-2010 of which a sum of Tk. 63.27 lac (87.81 percent) was received in cash within 30June 2010.
Capital Gains on Sale of Investments:
During 2009-10, the Fund earned Tk. 607.87 as capital gains by securities of 89 companies and total capital gain is Tk. 61,787,212.57
Here, the maximum capital gain came from the company of Sonargaon Textiles Ltd. Total no. of securities 16350 and the amount is Tk. 5,790,725.00
Income, Expenses and Distributable Income:
| Particulars | Taka (Lac) | Taka (Lac) |
| Dividend IncomeInterest income on Bank deposits Capital gains Gross Income…….. Total expense…… (commission and brokerage, printing and stationery, postage, Bank charges, provision against investments and others) Net income……… Previous year’s undistributed income Net distributable income Distributable income per certificate | 72.058.61 607.87
|
688.53 (388.91) |
| 299.62167.69 | ||
| 467.31155.77 |
Dividend:
The Fund declared dividend at the rate of Tk. 70.00 per certificate of Tk. 100.00 each for the year 2009-10, which was Tk. 35.00 per certificate in the previous year. After making provision of Tk. 210.00 lac for payment of dividend the Fund had an undistributed income of Tk. 257.31 lac. The Year –wise dividend performance of the Fund is shown in the following table:
Year –wise dividend Performance
| Financial Year | Dividend Per Certificate | Financial Year | Dividend Per Certificate |
| 1995-96 | 18 | 2002-03 | 14.50 |
| 1996-97 | 21 | 2003-04 | 15 |
| 1997-98 | 14 | 2004-05 | 16 |
| 1998-99 | 13 | 2005-06 | 16 |
| 1999-2000 | 13.50 | 2006-07 | 22.50 |
| 2000-01 | 14 | 2007-08 | 30 |
| 2001-02 | 14.50 | 2008-09 | 35 |
| 2009-10 | 70 |
Portfolio:
During 2009-10, the fund made investments of Tk. 218.46 lac in securities of 24 companies. As on 30 June 2010 the Fund had securities of 181 companies in its portfolio with a total cost of Tk. 1341.95 lac, the market value of which was Tk. 4324.86 lac.
The ex-dividend net asset value per certificate of Tk. 100.00 each of First Mutual Fund stood at Tk. 1180.13 as on 30 June 2010.
The opening and closing market price per certificate of First ICB Mutual Fund of Tk. 100.00 each of the fund was Tk. 892.50 and Tk. 1063.00 as respectively in 2009-10. The number of certificate holders of the fund was 2383 as on 30 June 2010.
Eighth ICB Mutual Fund:
The 8th ICB Mutual Fund was floated at 23 July 1996.
Dividend and Interest income:
The Fund had earned dividend of Tk. 75.41 lac from 66 securities during 2009-2010 of which a sum of Tk. 68.63 lac (91.01 percent) was received in cash within 30June 2010.
Capital Gains on Sale of Investments:
During 2009-10, the Fund earned Tk. 670.68 lac as capital gains by securities of 87 companies and the total capital gain is Tk. 67,067,600.98
Here, the maximum capital gain came from the company of United Leasing Co. Ltd. Total no. of securities 5960 and the amount is Tk. 7,329,581.64
Income, Expenses and Distributable Income:
| Particulars | Taka (Lac) | Taka (Lac) |
| Dividend IncomeInterest income on Bank deposits Capital gains Gross Income……… Total expense……… (commission and brokerage, printing and stationery, postage, Bank charges, provision against investments and others) Net income……… Previous year’s undistributed income Net distributable income Distributable income per certificate | 75.419.56 670.68
|
755.65 (292.01) |
| 463.64222.23 | ||
| 685.87137.17 |
Dividend:
The Fund declared dividend at the rate of Tk. 65.00 per certificate of Tk. 100.00 each for the year 2009-10, which was Tk. 32.00 per certificate in the previous year. After making provision of Tk. 325.00 lac for payment of dividend the Fund had an undistributed income of Tk. 360.87 lac .The Year –wise dividend performance of the Fund is shown in the following table:
Year –wise dividend Performance
| Financial Year | Dividend Per Certificate | Financial Year | Dividend Per Certificate |
| 1996-97 | 18 | 2003-04 | 14 |
| 1997-98 | 12 | 2004-05 | 15 |
| 1998-99 | 12 | 2005-06 | 15 |
| 1999-2000 | 12.50 | 2006-07 | 18 |
| 2000-01 | 13 | 2007-08 | 25 |
| 2001-02 | 13.50 | 2008-09 | 32 |
| 2002-03 | 13.50 | 2009-10 | 65 |
Portfolio:
During 2009-10, the fund made investments of Tk. 249.19 lac in securities of 21 companies. As on 30 June 2010 the Fund had securities of 175 companies in its portfolio with a total cost of Tk. 1538.86 lac, the market value of which was Tk. 5002.74 lac.
The ex-dividend net asset value per certificate of Tk. 100.00 each of First Mutual Fund stood at Tk. 864.95 as on 30 June 2010.
The opening and closing market price per certificate of First ICB Mutual Fund of Tk. 100.00 each of the fund was Tk. 632.76 and Tk. 755.50 as respectively in 2009-10. The number of certificate holders of the fund was 6735 as on 30 June 2010.
CHAPTER – 4
Ratio & Graphical Analysis
of ICB Mutual Funds
Current Ratio:
First ICB Mutual Fund:
| Name of the Ratio | Formula | 2009-10 | 2008-09 |
| Current Ratio | CR= Current Assets/Current Liabilities | 119264681÷35000563=3.41:1 | 114046205÷48864978=2.33:1 |
Interpretation: The standard ratio in this case is 2:1. The actual ratio for the fiscal year 2008-09 is 2.33:1 which is above of standard. In this case the current asset of ICB compared to current liabilities is sufficient. Again the actual ratio for the fiscal year 2009-10 is 3.41:1 which is above of the standard. Here the current asset of ICB compared to current liability is satisfactory.
Second ICB Mutual Fund:
| Name of the Ratio | Formula | 2009-10 | 2008-09 |
| Current Ratio | Current Ratio= current assets/current liabilities | 77171415÷45511592= 1.70 : 1 | 79292638÷55625608= 1.43 : 1 |
Interpretation: Standard ratio in this case 2:1. The actual ration for the fiscal year 2008-09 is 1.43:1 which is below of standard. In this case the current asset of ICB compared to current liability is not sufficient. Again the actual ratio for the fiscal year 2009-10 is 1.99:1 which is same to the standard. Here the current asset of ICB compared to current liability is satisfactory.
Third ICB Mutual Fund:
| Name of the Ratio | Formula | 2009-10 | 2008-09 |
| Current Ratio | Current Ratio= Current assets/ current liabilities | 94328785÷46252816=2.04 : 1 | 86105151÷47966901=1.78 : 1 |
Interpretation: Standard ratio in this case is 2:1. The actual ratio for the fiscal year 2008-09 is 1.78:1 which is below of standard. In this case the current asset of ICB compared to current liability is not sufficient. Again the actual ratio for the fiscal year 2009-10 is 2.04:1 which is above of the standard. Here the current asset of ICB compared to current liability is satisfactory.
Fourth ICB Mutual Fund:
| Name of the Ratio | Formula | 2009-10 | 2008-09 |
| Current Ratio | Current Ratio= Current assets/ current liabilities | 107587626÷59856216=1.80 : 1 | 95305253÷57346111=1.66 : 1 |
Interpretation: Standard ratio in this case is 2:1. The actual ratio for the fiscal year 2008-09 is 1.80:1 which is below of standard. In this case the current asset of ICB compared to current liability is not sufficient. Again the actual ratio for the fiscal year 2009-10 is 1.66:1 which is also below of the standard. Here the current asset of ICB compared to current liability is not satisfactory.
Fifth ICB Mutual Fund:
| Name of the Ratio | Formula | 2009-10 | 2008-09 |
| Current Ratio | Current Ratio= Current assets/ current liabilities | 145761261÷96235506=1.51 : 1 | 115814955÷79240948=1.46 : 1 |
Interpretation: Standard ratio in this case is 2:1. The actual ratio for the fiscal year 2008-09 is 1.46:1 which is below of standard. In this case the current asset of ICB compared to current liability is not sufficient. Again the actual ratio for the fiscal year 2009-10 is 1.51:1 which is also below of the standard. Here the current asset of ICB compared to current liability is not satisfactory.
Sixth ICB Mutual Fund:
| Name of the Ratio | Formula | 2009-10 | 2008-09 |
| Current Ratio | Current Ratio= Current assets/ current liabilities | 192517973÷74248077=2.59 : 1 | 160752686÷69316209=2.32 : 1 |
Interpretation: Standard ratio in this case is 2:1. The actual ratio for the fiscal year 2008-09 is 2.32:1 which is above of standard. In this case the current asset of ICB compared to current liability is sufficient. Again the actual ratio for the fiscal year 2009-10 is 2.59:1 which is also above of the standard. Here the current asset of ICB compared to current liability is satisfactory.
Seventh ICB Mutual Fund:
| Name of the Ratio | Formula | 2009-10 | 2008-09 |
| Current Ratio | Current Ratio= Current assets/ current liabilities | 209113978÷132366503=1.58 : 1 | 166670477÷109384891=1.52 : 1 |
Interpretation: Standard ratio in this case is 2:1. The actual ratio for the fiscal year 2008-09 is 1.52:1 which is below of standard. In this case the current asset of ICB compared to current liability is not sufficient. Again the actual ratio for the fiscal year 2009-10 is 1.58:1 which is also below of the standard. Here the current asset of ICB compared to current liability is not satisfactory.
Eighth ICB Mutual Fund:
| Name of the Ratio | Formula | 2009-10 | 2008-09 |
| Current Ratio | Current Ratio= Current assets/ current liabilities | 243425003÷124838239=1.95 : 1 | 189741743÷101518623=1.87 : 1 |
Interpretation: Standard ratio in this case is 2:1. The actual ratio for the fiscal year 2008-09 is 1.87:1 which is below of standard. In this case the current asset of ICB compared to current liability is not sufficient. Again the actual ratio for the fiscal year 2009-10 is 1.95:1 which is also below of the standard but it is more near from the standard level. Here the current asset of ICB compared to current liability is better but not satisfactory.
Earning Per Share:
First ICB Mutual Fund:
| Name of the Ratio | Formula | 2009-10 | 2008-09 |
| Earning Per Share (EPS) | EPS= Net Income/ No. of shares held | 42332887÷75000= 564.44 | 28893206÷75000= 385.24 |
Interpretation: Here we can sassily notice trend of earnings per share of ICB which is an indication of successful management of the fund, to retain the position and it is a bit higher.
Second ICB Mutual Fund:
| Name of the Ratio | Formula | 2009-10 | 2008-09 |
| EPS | EPS= Net income/ No. of share held | 12742793÷50000= 254.86 | 6777374÷50000= 135.55 |
Interpretation: Here we can easily notice increasing trend of earnings per share of ICB which is an indication of successful management of the fund.
Third ICB Mutual Fund:
| Name of the Ratio | Formula | 2009-10 | 2008-09 |
| EPS | EPS= Net Income/No. of share held | 18437719÷100000=184.38 | 12139709÷100000=121.40 |
Interpretation: Here we can easily notice an increasing trend of earnings per share of ICB which is an indication of successful management of the fund.
Fourth ICB Mutual Fund:
| Name of the Ratio | Formula | 2009-10 | 2008-09 |
| EPS | EPS= Net Income/No. of share held | 17772268÷100000=177.72 | 1142758÷100000=114.28 |
Interpretation: Here we can easily notice an increasing trend of earnings per share of ICB which is an indication of successful management of the fund
Fifth ICB Mutual Fund:
| Name of the Ratio | Formula | 2009-10 | 2008-09 |
| EPS | EPS= Net Income/No. of share held | 21351749÷150000=142.34 | 11784142÷150000=78.56 |
Interpretation: Here we can easily notice an increasing trend of earnings per share of ICB which is an indication of successful management of the fund.
Sixth ICB Mutual Fund:
| Name of the Ratio | Formula | 2009-10 | 2008-09 |
| EPS | EPS= Net Income/No. of share held | 45333419÷500000=90.67 | 24999936÷500000=50.00 |
Interpretation: Here we can easily notice an increasing trend of earnings per share of ICB which is an indication of successful management of the fund.
Seventh ICB Mutual Fund:
| Name of the Ratio | Formula | 2009-10 | 2008-09 |
| EPS | EPS= Net Income/No. of share held | 29961888÷300000=99.87 | 14999581÷300000=50.00 |
Interpretation: Here we can easily notice an increasing trend of earnings per share of ICB which is an indication of successful management of the fund.
Eighth ICB Mutual Fund:
| Name of the Ratio | Formula | 2009-10 | 2008-09 |
| EPS | EPS= Net Income/No. of share held | 46363644÷500000=92.73 | 21423580÷500000=42.85 |
Interpretation: Here we can easily notice an increasing trend of earnings per share of ICB which is an indication of successful management of the fund.
Earning Per Share:
| Year | 1st | 2nd | 3rd | 4th | 5th | 6th | 7th | 8th |
| 2009-10 | 564.44 | 254.86 | 184.38 | 177.72 | 142.34 | 90.67 | 99.87 | 92.73 |
| 2008-09 | 385.24 | 135.55 | 121.40 | 114.28 | 78.56 | 50.00 | 50.00 | 42.85 |
EPS means Earning per Share. So, maximum earn from per share shows the maximum profit and company’s growth is well.
Here we see that, EPS is increases in 2009-10 from previous year of 2008-09. It is a good sign for a company. And here most EPS comes from 1st ICB Mutual Fund.
Price Earning Ratio:
First ICB Mutual Fund:
| Name of the Ratio | Formula | 2009-10 | 2008-09 |
| Price Earning Ratio | PE=Market Price/EPS | 8701÷564.44= 15.42 | 5783÷385.24= 15.01 |
Interpretation: Price Earning Ratio gives the idea of what the market is willing to pay for the company’s earning. Higher PE indicates the higher risk. Here we see that in year 2009-10 PE is 15.42 it is more than for the year of 2008-09 15.01. It’s not a better for investors.
Second ICB Mutual Fund:
| Name of the Ratio | Formula | 2009-10 | 2008-09 |
| Price Earning Ratio | PE=Market Price/EPS | 2578.75÷254.86= 10.12 | 2244.75÷135.55=16.56 |
Interpretation: Price Earning Ratio gives the idea of what the market is willing to pay for the company’s earning. Higher PE indicates the higher risk. Here we see that in year 2009-10 PE is 10.12, it is less than for the year of 2008-09 16.56. It’s a better for investors.
Third ICB Mutual Fund:
| Name of the Ratio | Formula | 2009-10 | 2008-09 |
| Price Earning Ratio | PE=Market Price/EPS | 1972.50÷186.38=10.58 | 1259.50÷121.40=10.37 |
Interpretation: Price Earning Ratio gives the idea of what the market is willing to pay for the company’s earning. Higher PE indicates the higher risk. Here we see that in year 2009-10 PE is 10.58, it is some more than for the year of 2008-09 10.37. It’s not a better for investors.
Fourth ICB Mutual Fund:
| Name of the Ratio | Formula | 2009-10 | 2008-09 |
| Price Earning Ratio | PE=Market Price/EPS | 2139.75÷177.72=12.04 | 1236.25÷114.28=10.82 |
Interpretation: Price Earning Ratio gives the idea of what the market is willing to pay for the company’s earning. Higher PE indicates the higher risk. Here we see that in year 2009-10 PE is 12.04, it is more than for the year of 2008-09 10.82. It’s not a better for investors.
Fifth ICB Mutual Fund:
| Name of the Ratio | Formula | 2009-10 | 2008-09 |
| Price Earning Ratio | PE=Market Price/EPS | 1763÷142.34= 12.39 | 1230÷78.56= 15.66 |
Interpretation: Price Earning Ratio gives the idea of what the market is willing to pay for the company’s earning. Higher PE indicates the higher risk. Here we see that in year 2009-10 PE is 12.39, it is more than for the year of 2008-09 15.66. It’s better for investors.
Sixth ICB Mutual Fund:
| Name of the Ratio | Formula | 2009-10 | 2008-09 |
| Price Earning Ratio | PE=Market Price/EPS | 647.75÷90.67= 7.14 | 679.25÷50= 13.59 |
Interpretation: Price Earning Ratio gives the idea of what the market is willing to pay for the company’s earning. Higher PE indicates the higher risk. Here we see that in year 2009-10 PE is 7.14, it is more than for the year of 2008-09 13.59. It’s better for investors.
Seventh ICB Mutual Fund:
| Name of the Ratio | Formula | 2009-10 | 2008-09 |
| Price Earning Ratio | PE=Market Price/EPS | 1063÷99.87= 10.64 | 892.50÷50= 17.85 |
Interpretation: Price Earning Ratio gives the idea of what the market is willing to pay for the company’s earning. Higher PE indicates the higher risk. Here we see that in year 2009-10 PE is 10.64, it is more than for the year of 2008-09 17.85. It’s better for investors.
Eighth ICB Mutual Fund:
| Name of the Ratio | Formula | 2009-10 | 2008-09 |
| Price Earning Ratio | PE=Market Price/EPS | 755.50÷92.73= 8.15 | 632.75÷42.85= 14.77 |
Interpretation: Price Earning Ratio gives the idea of what the market is willing to pay for the company’s earning. Higher PE indicates the higher risk. Here we see that in year 2009-10 PE is 8.15, it is more than for the year of 2008-09 14.77. It’s better for investors.
Price Earning Ratio:
| Year | 1st | 2nd | 3rd | 4th | 5th | 6th | 7th | 8th |
| 2009-10 | 15.42 | 10.12 | 10.58 | 12.04 | 12.39 | 7.14 | 10.64 | 8.15 |
| 2008-09 | 15.01 | 16.56 | 10.37 | 10.82 | 15.66 | 13.59 | 17.85 | 14.77 |
Here we see that, some PE ratios are flow down and some are flow up. PE ratio gives an idea of what the market is willing to pay for the company’s earnings. Lower PE ratio indicates the lower risk for investors. And higher ratio not better for investors. Most of the ICB Mutual Fund’s PE ratio goes down. That means investors are less willing to pay for the mutual funds.
Capital Gain on Investment:
First ICB Mutual Fund:
| Name of the Ratio | Formula | 2009-10 | 2008-09 |
| Capital gain of investment | Capital gain of investment= Capital gain/Total investment *100 | 37565167÷88770795*100= 42.38% | 24346125÷58028689*100= 42% |
Interpretation: Capital gain on investment means gain from the sale of investment. Here we can see an increasing trend of rate of capital gain which indicated growing demand of fund in the market.
Second ICB Mutual Fund:
| Name of the Ratio | Formula | 2009-10 | 2008-09 |
| Capital gain on Investment | Capital gain on investment= Capital gain/Total investment*100 | 24765105÷61297649*100= 40.40% | 14850124÷43719169*100= 33.97% |
Interpretation: Capital gain on investment means gain from the sale of investment. Here we can see an increasing trend of rate of capital gain which indicates growing demand of fund in the market.
Third ICB Mutual Fund:
| Name of the Ratio | Formula | 2009-10 | 2008-09 |
| Capital gain on Investment | Capital gain on investment= Capital gain/Total investment*100 | 26102001÷69825467*100= 7.38% | 20512814÷72145974*100= 28.43% |
Interpretation: Capital gain on investment means gain from the sale of investment. Here we can see an increasing trend of rate of capital gain which indicates growing demand of fund in the market.
Fourth ICB Mutual Fund:
| Name of the Ratio | Formula | 2009-10 | 2008-09 |
| Capital gain on Investment | Capital gain on investment= Capital gain/Total investment*100 | 33980324÷74851794*100= 45.40% | 26047694÷79252866*100= 32.87% |
Interpretation: Capital gain on investment means gain from the sale of investment. Here we can see an increasing trend of rate of capital gain which indicates growing demand of fund in the market.
Fifth ICB Mutual Fund:
| Name of the Ratio | Formula | 2009-10 | 2008-09 |
| Capital gain on Investment | Capital gain on investment= Capital gain/Total investment*100 | 38602780÷95261107*100= 40.52% | 50282123÷100385396*100= 50.08% |
Interpretation: Capital gain on investment means gain from the sale of investment. Here we can see decreasing trend of rate of capital gain which indicates decreasing demand of fund in the market.
Sixth ICB Mutual Fund:
| Name of the Ratio | Formula | 2009-10 | 2008-09 |
| Capital gain on Investment | Capital gain on investment= Capital gain/Total investment*100 | 50122888÷122585722*100= 40.88% | 45913255÷122913451*100= 37.35% |
Interpretation: Capital gain on investment means gain from the sale of investment. Here we can see decreasing trend of rate of capital gain which indicates decreasing demand of fund in the market
Seventh ICB Mutual Fund:
| Name of the Ratio | Formula | 2009-10 | 2008-09 |
| Capital gain on Investment | Capital gain on investment= Capital gain/Total investment*100 | 61787212÷1341995756*100= 46.04% | 66779737÷139461880*100= 47.88% |
Interpretation: Capital gain on investment means gain from the sale of investment. Here we can see decreasing trend of rate of capital gain which indicates decreasing demand of fund in the market
Eighth ICB Mutual Fund:
| Name of the Ratio | Formula | 2009-10 | 2008-09 |
| Capital gain on Investment | Capital gain on investment= Capital gain/Total investment*100 | 67067600÷153886033*100= 43.58% | 60787221÷157025973*100= 18.47% |
Interpretation: Capital gain on investment means gain from the sale of investment. Here we can see increasing trend of rate of capital gain which indicates increasing demand of fund in the market.
Capital gain on investment:
| Year | 1st | 2nd | 3rd | 4th | 5th | 6th | 7th | 8th |
| 2009-10 | 42.38% | 40.40% | 7.38% | 45.40% | 40.52% | 40.88% | 46.04% | 43.58% |
| 2008-09 | 42% | 33.97% | 28.43% | 32.87% | 50.08% | 37.35% | 47.88% | 18.47% |
Here we see that, the capital gain some are increases and some are decreases. If it is maximize we can say it’s good. Authority and the committee are working properly, but here we see in 3rd ICB Mutual Fund decreases the capital gain 28.43% in 2008-09 and direct fall to 7.38% in year of 2009-10. It’s a very bad sign of this sector.
Return on Investment:
First ICB Mutual Fund:
| Name of the Ratio | Formula | 2009-10 | 2008-09 |
| Return on Investment | ROI= Net Income/Total investment*100 | 42332887÷88770795*100= 47.69% | 24827105÷58028689*100= 42.78% |
Interpretation: Here we see an increasing trend of return on investment which indicated successful and wise full management of the fund.
Second ICB Mutual Fund:
| Name of the Ratio | Formula | 2009-10 | 2008-09 |
| Return on Investment | ROI= Net Income/Total investment * 100 | 12742793÷61297649*100=20.79% | 6777374÷43719169*100=15.50% |
Interpretation: Here we see a increasing trend of return on investment which indicated successful of the fund.
Third ICB Mutual Fund:
| Name of the Ratio | Formula | 2009-10 | 2008-09 |
| Return on Investment | ROI= Net Income/Total investment * 100 | 18437719÷69825467*100=26.40% | 12139709÷72145974*100=16.82% |
Interpretation: Here we see an increasing trend of return on investment which indicated successful and wise full management of the fund.
Fourth ICB Mutual Fund:
| Name of the Ratio | Formula | 2009-10 | 2008-09 |
| Return on Investment | ROI= Net Income/Total investment * 100 | 17772268÷74851794*100=23.74% | 11427598÷79252866*100=14.42% |
Interpretation: Here we see an increasing trend of return on investment which indicated efficient management of the fund.
Fifth ICB Mutual Fund:
| Name of the Ratio | Formula | 2009-10 | 2008-09 |
| Return on Investment | ROI= Net Income/Total investment * 100 | 21351749÷95261107*100=22.41% | 11784142÷79252866*100=11.74% |
Interpretation: Here we see an increasing trend of return on investment which indicated efficient management of the fund.
Sixth ICB Mutual Fund:
| Name of the Ratio | Formula | 2009-10 | 2008-09 |
| Return on Investment | ROI= Net Income/Total investment * 100 | 45333419÷122585722*100=36.98% | 24999936÷122913451*100=20.33% |
Interpretation: Here we see an increasing trend of return on investment which indicated successful and wise full management of the fund.
Seventh ICB Mutual Fund:
| Name of the Ratio | Formula | 2009-10 | 2008-09 |
| Return on Investment | ROI= Net Income/Total investment * 100 | 29961888÷134195756*100=22.32% | 14999581÷13946188*100=11.17% |
Interpretation: Here we see an increasing trend of return on investment which indicated successful and wise full management of the fund.
Eighth ICB Mutual Fund:
| Name of the Ratio | Formula | 2009-10 | 2008-09 |
| Return on Investment | ROI= Net Income/Total investment * 100 | 46363644÷153886033*100=30.12% | 21423580÷157025973*100=13.64% |
Interpretation: Here we see an increasing trend of return on investment which indicated successful and wise full management of the fund.
Return on investment:
| Year | 1st | 2nd | 3rd | 4th | 5th | 6th | 7th | 8th |
| 2009-10 | 47.69% | 20.79% | 26.40% | 23.74% | 22.41% | 36.98% | 22.32% | 30.12% |
| 2008-09 | 42.78% | 15.50% | 16.82% | 14.42% | 11.74% | 20.33% | 11.17% | 13.64% |
Here we see that, in every mutual fund’s return on investment are increases in 2009-10 from year of 2088-09. It is a very good scenario. Every company want to maximize the return on investment.
Dividend Payout Ratio:
First ICB Mutual Fund:
| Name of the Ratio | Formula | 2009-10 | 2008-09 |
| Dividend Payout Ratio | Dividend Payout Ratio=Dividend per share/Earning per share * 100 | 400÷564.44*100=70.87% | 310÷385.24*100=80.47% |
Interpretation: Here we notice decreases of rate of paying cash dividend which indicates decreasing capability of ICB to invest fund.
Second ICB Mutual Fund:
| Name of the Ratio | Formula | 2009-10 | 2008-09 |
| Dividend Payout Ratio | Dividend Payout Ratio=Dividend per share/Earning per share * 100 | 200÷254.86 *100= 78.47% | 95÷135.55 *100=70.08% |
Interpretation: Here we notice an increasing trend of rate of paying cash dividend which indicates increasing capability of ICB to invest future
Third ICB Mutual Fund:
| Name of the Ratio | Formula | 2009-10 | 2008-09 |
| Dividend Payout Ratio | Dividend Payout Ratio=Dividend per share/Earning per share * 100 | 140÷184.38*100= 75.93% | 85÷121.40 *100=70.00% |
Interpretation: Here we notice an increasing trend of rate of paying cash dividend which indicates increasing capability of ICB to invest fund.
Fourth ICB Mutual Fund:
| Name of the Ratio | Formula | 2009-10 | 2008-09 |
| Dividend Payout Ratio | Dividend Payout Ratio=Dividend per share/Earning per share * 100 | 125÷177.72*100= 70.34% | 80÷114.28 *100=70.00% |
Interpretation: Here we notice an increasing trend of rate of paying cash dividend which indicates increases satisfaction of investor.
Fifth ICB Mutual Fund:
| Name of the Ratio | Formula | 2009-10 | 2008-09 |
| Dividend Payout Ratio | Dividend Payout Ratio=Dividend per share/Earning per share * 100 | 100÷142.34*100= 70.25% | 56÷78.56 *100=71.28% |
Interpretation: Here we notice decreasing trend of rate of paying cash dividend which indicates decreases not satisfaction of investor.
Sixth ICB Mutual Fund:
| Name of the Ratio | Formula | 2009-10 | 2008-09 |
| Dividend Payout Ratio | Dividend Payout Ratio=Dividend per share/Earning per share * 100 | 75÷90.67*100= 82.71% | 37÷50 *100=74.00% |
Interpretation: Here we notice an increasing trend of rate of paying cash dividend which indicates increases satisfaction of investor.
Seventh ICB Mutual Fund:
| Name of the Ratio | Formula | 2009-10 | 2008-09 |
| Dividend Payout Ratio | Dividend Payout Ratio=Dividend per share/Earning per share * 100 | 70÷99.87*100= 70.09% | 35÷50 *100=70.00% |
Interpretation: Here we notice an increasing trend of rate of paying cash dividend which indicates increases satisfaction of investor.
Eighth ICB Mutual Fund:
| Name of the Ratio | Formula | 2009-10 | 2008-09 |
| Dividend Payout Ratio | Dividend Payout Ratio=Dividend per share/Earning per share * 100 | 65÷92.73*100= 70.09% | 32÷42.85 *100=74.67% |
Interpretation: Here we notice decreasing trend of rate of paying cash dividend which indicates decreases not satisfaction of investors.
Dividend payout ratio:
| Year | 1st | 2nd | 3rd | 4th | 5th | 6th | 7th | 8th |
| 2009-10 | 70.87% | 78.47% | 75.93% | 70.34% | 70.25% | 82.71% | 70.09% | 70.09% |
| 2008-09 | 80.47% | 70.08% | 70.00% | 70.00% | 71.28% | 74.00% | 70.00% | 74.67% |
Here we see that, 1st, 5th and 8th ICB Mutual Fund is decreases and other Mutual Funds ration is increases. If dividend pay out ratio is increases this is indicates increasing capability of ICB to invest fund. And other hand if it’s decreases which indicates decreasing capability of ICB to invest fund.
Maximum Capital gain on a Security:
| Year Of 2009-2010 | 1st | 2nd | 3rd | 4th | 5th | 6th | 7th | 8th | |
| Securities | GrameenPhone Ltd.
| GrameenPhone Ltd.
| Jamuna OilCo. Ltd
| Jamuna OilCo. Ltd
| Jamuna OilCo. Ltd
| GrameenPhone Ltd.
| SonargaonTextiles Ltd.
| UnitedLeasing Co. Ltd
| |
| Amount (Tk in lac) | 32.74 | 24.94 | 25.44 | 29.29 | 28.99 | 39.61 | 57.90 | 73.29 |
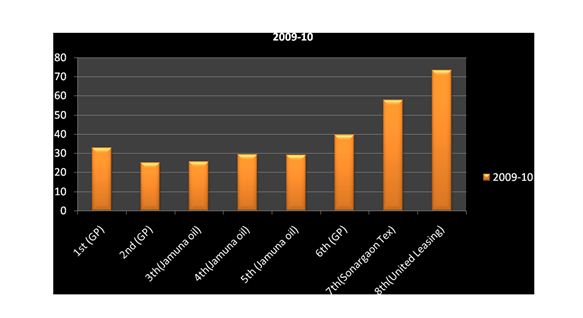
Here we see that, maximum profit earn from an individual securities. And 8th ICB Mutual Fund earn capital gain maximum from United Leasing Co. Ltd. and the amount is Tk. 73.29 Lac.
CHAPTER – 5
Problem, Recommendation & Conclusion
FINDINGS:
Problem Related to the ICB Mutual Fund:
Mutual funds are managed and run by a professional management team , the success and growth of the mutual funds depend future profitability and investors confidence also depend on the management performance .
During the internship at ICB, I have found some problems, which can affect the fund future and the confidence of the investors. There are some problems related to fund. They are as follows:
From depositor’s Point of view:
- The services provided by the related personnel are not prompt. It is taking more than required time for giving the service.
- Same laggard procedure is also taking place at the time of execution of order.
- Withdrawal of any funds of securities is also very lengthy and complicated process and inefficiently managed.
From Portfolio investment point of view:
ICB has not yet done any systematic analysis for measuring how they are doing. ICB has not identified any key variables to size up all its diversified performance.
From Capital market point of view:
- Dividend is one of the sources of income for the mutual fund. Most of the companies do not declare dividend up to satisfactory level.
- The rate of supply of fundamentally strong securities is very low.
- Political unsteady position also hearts the investor’s sentiment in the market and thereby leads to flat the stock market.
- Using costly borrowing capital for the investment on securities is another factor causing problem for high expenditure of maintenance of funds, which affects the income of fund
RECOMMENDATIONS:
Recommendations ICB Mutual Funds are suggested are on the basis of the problems. These are:
- The interest of making portfolio of proposed funds and the existing ICB unit mutual fund profitable and attractive, it is imperative to design balance portfolio of securities. As the supply of securities is not adequate, I think, the portfolio is envisaged to be designed and developed from the following sources:
- Shares of multinational companies
- Shares of public enterprises
- Primary issue of securities by companies
- Secondary market operation.
Share of public enterprises means government has been pursuing policy of divesting 49% shares of government enterprises of public subscription. In this regard govt. should reserve 30% of all new issues in all cases for ICB.
- Reserve should be kept at a minimum level; it may vary fund to fund, but not more than 25% of a fund’s income.
- Investing in costly borrowing funds should be reduced. Management may look for sources of less costly funds and reduce expenses and increase income.
- ICB should fix redemption date of each fund. I may redeem 1st, 2nd, and 3rd mutual fund. Because these funds are established for more than 15 years.
- ICB may take initiative and decision to float more funds for the stabilization of capital market and for gaining of investor’s confidence to invest in the capital market.
- ICB should reduce interest rate.
- Orders are to be executed quickly.
- Training program should be arranged for developing of management efficiency.
CONCLUSION:
ICB is a unique name in our country as an investment Bank. It is playing a pivotal role to develop the country’s capital market, ICB as the National Investment House is the organization to per from the activities by creating demand for securities and on the other hand to ensure the supply of securities in the Capital Market. ICB’s investor’s scheme helps to boost up domestic economy through facilitating to invest into the capital market. At a stage, this made an important effect on the capital market and excellent response from the investor’s/ the floatation of mutual funds and issuance of unit certificates by the ICB strengthens the activities of mutual fund.
Mutual Fund department is appreciably innovative, explorative and dynamic. ICB should specially continue the operations and management of mutual fund because most of the small investors are key clients of mutual fund. But still, Mutual Funds are not above the shortcomings. So, ICB should concentrate to increase the performance of its mutual fund and way to find out the path for overcoming the problems of operations.
We are quite optimistic that if the given recommendations of this paper are implemented then ICB mutual fund may be able to overcome its present problems and may enlarge its contribution to the rapid development of Bangladesh capital market.