Introduction
Early banking system served mainly as depositors for funds, while the more modern system has considered the supplying of credit their main purpose. A bank not only accepts money or deposits, but also lends money and creates its own credit; Crowther (2009, Bank Foundation, 5th edition) has defined a bank as “a dealer in debts- his own and of other people”. Sawyers (2006, Fundamentals of Banking, 2nd edition) states, “we can define a bank as an institution whose debts (bank deposits) are widely accepted in settlement of other peoples debts to each other”.
SWOT Analysis of Trust Bank Limited:
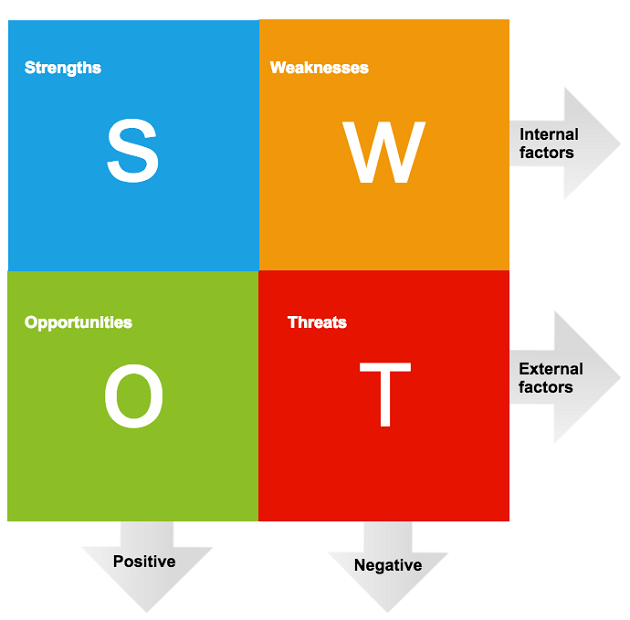
Strengths
- Number of overseas branches.
- Friendly environment.
- Low customer base ensure dedicated attention to each customer.
- All over Bangladesh are situated in Bank.
- It state owned commercial banking system.
Weakness
- Low rate of interest on deposits.
- Very few ATM Booths.
- Very few Branches are internet Banking system.
- Not enough promotional Activities.
- Not internet banking all over branches in Bangladesh.
Opportunities
- Innovation of new services.
- Increasing demand for import export and L/C through proper promotional activities.
- Enlarging business by opening new branches in over country.
Threats
- Increasing competition by foreign and local banks and especially private bank.
- Political involvement in decision making.
- Forecast of low growth in national economy due to adverse world economic situation and recession.
An overview on Compensation
In the 21st century organizations, by and large, people pay much more attention to their life style and the money they earn from the work than their predecessors. However, it still remains unclear whether many of them would continue working if it were not for the money they earn. Employee expectations of a compensation plan are that it is fair and equitable, that it provides them with tangible rewards commensurate with their skills, and further, that it provides recognition and a livelihood. Compensation, in the organizations of today is a major consideration in Human Resource Management (HRM), and how it is allocated sends a message to employees about what the organizations believe to be important and worth encouraging. For employers, the compensation usually represents a sizeable proportion of operating costs. Many employers view this only as a cost, while failing to consider the strategic benefits of a well considered remuneration and benefits plan.
In manufacturing firms, payment to employees generally exceeds 20 percent of total expenditure and can exceed 80 percent in service firms Belcher and Atchison (1987) which indicates that the organizations need to spend more on compensation to make sure that their employees are motivated enough to perform at their best. Modern day organizations render an utmost importance to work which provides products and services, which characterize the basis for a company’s success Steers (1991), but it is also a vital and highly central aspect in the lives of individuals Hall (1994) due to numerous reasons. First, persons receive some kind of reward, extrinsic (such as money) or intrinsic (satisfaction coming from the work), in exchange for their performance Steers and Porters (1991). The individual holds certain personal expectations in terms of form and amount of reward, which he/she should receive for the provided service. Thereby, the performance of a person as well as the decision to remain in the company is influenced by the level to which such expectations are met steers (1991). Second, the workplace presents opportunities for socialization with other people Hall (1994). Third, the job is often a source of rank, or status, in the society in general Steers (1991). In other words, the work may provide a source of social delineation. Fourth, reason pointed by Steers and Porter (1991) indicates that work has an individual meaning for each person. It may range from a source of identity and self-esteem, to a source of frustration, monotony, and a feeling of futility, which may be due to the work itself or even may be due to the personality traits of the person. As stated earlier, work may be a sound base of self fulfillment for some employees. For others it may be other way around and leaves the employees in a state of dissatisfaction. With regard to the employees’ time which they use up for most of their day time at work and that too for almost whole of their lives before they retire. It becomes pivotal that the employees should have a positive mind set for the work which they do. If not, it will leave them annoyed and unhappy. In addition, this negative mind set will not only leave a bad impact on the social and family life but also renders an individual physically and emotionally distressed, Schultz and Schultz (1998). Herzberg, Mausner, and Snyderman (1999) pointed out that an employee, irrespective of working in an office or on a bench, will experience his/her tasks, as well as the workday totally differently if the attitudes toward the job are good or if they are bad. More over, they are also of the view that the good or bad performance of a company is also influenced by the feelings of the employees’. The case in point would be hard times in an organization where the employees’ morale may be the driving force in the run for company’s survival.
To state it a bit differently a motivated work force is a vital component for a company’s survival. Employees are a valuable resource that may contribute in several different ways to a company’s activities, provided that the company gives them an appropriate chance Morgan (1997). For a company to be successful, it needs the work force that can act strongly for the achievement of organizational goals and also have a strong urge to remain loyal to the company Molander (1996). For such devotion and dedication the key remains the motivation. Moreover, motivation is expected to accomplish work productivity and job satisfaction Schultz and Schultz (1998). Mainly, the impacts of motivation on the work performance and productivity attracted attention towards motivation in the work environment Huddleston and Good (1999). Employees with high level of motivation tend to work hard and perform better in their work as compared to the employees with low level of motivation. The understanding of the employees’ needs and expectations of employees at work signifies the base for their motivation. In addition, the arrangement of the employees’ work and the level of satisfaction with the job are important in order to increase the actual motivation and satisfaction with their work. The differences in this regard that what people want and actually perceive from their job are of significance. The strongest motivator is, according to Wiley (1997), something that people value, but lack. The awareness, for the organization, about those strong motivators is of great value and may serve as a starting point to re-design the work, in order to increase an employee’s motivation and satisfaction. Top executives are primarily responsible for corporate profitability and shareholders’ wealth; lower level line managers are primarily responsible for operational performance. Although organizations often seek to associate a portion of middle managers’ pay to corporate financial performance, these managers are also likely to be rewarded for their contribution to the organizations in terms of their ability to effectively manage the production systems for which they are responsible.
Compensation Research
Compensation research from WWII until the 1990s was consistent with the practice of ILMs in its primary focus on aspects of pay, compensation practice, and reactions of employees to pay that represented internal organizational concerns. As an interdisciplinary field, HRM has historically drawn research contributions from different disciplines (Ferris, Barnum, Rosen, Holleran, & Dulebohn, 1995). Along these lines, compensation research has been conducted by a variety of disciplines including economics, psychology, sociology, and finance. The resulting research and theory by different disciplines to compensation often was descriptive and purposed to answer questions organizations had, often in the context of administering organizational pay. While human resource management has benefited fromdisparate streams of compensation research, compensation appears to have been a less researched area than other employment related issues such as turnover and manpower (i.e., HR) planning (Opshal & Dunnette, 1966). Further, research has often viewed compensation as an outcome or dependent variable, rather than the primary object of interest (Gerhart & Milkovich, 1992).
A number of scholars have provided comprehensive reviews of compensation research (Gerhart & Milkovich, 1992; Gerhart & Rynes, 2003; Rynes & Gerhart, 2000) and this is not the objective of the following discussion. The purpose of the review below is to provide some examples of the internal focus that has largely characterized prior compensation research in human resource management. We present some research on pay structure, job evaluation and internal equity as well as individual reactions to pay. This sampling of research will be followed by a discussion of changes in the environment and organizations that highlight the need to shift compensation research to include a focus on external factors.
Pay satisfaction
While pay has been consistently viewed as a primary motivator in modern approaches to management, it was not until the 1960s that systematic pay satisfaction research began. The premise for this research was the expectation that compensation and work-related outcomes were mediated by attitudes toward pay (Williams, McDaniel, & Nguyen 2006). Pay satisfaction represents an attitude and has been defined by Miceli and Lane (1991) as the “amount of overall positive or negative affect (or feelings) that individuals have toward their pay” ( p. 246). Pay satisfaction has been hypothesized to be related to work-related outcomes such as absenteeism and turnover (Heneman & Schwab, 1985; Williams et al., 2006).
Pay satisfaction research has its roots in research on cognitive dissonance theory and theoretical work in social exchange and equity (cf., Homans, 1961). Homans (1961) defined equity in the context of an exchange relationship. He conceptualized individual evaluations of equity employing “quasi-economic terms” (Adams, 1965,p.272).Homans (1961) asserted that equity results when an individual obtains rewards that are proportional to his or her investments, less costs, when compared to the other party in the exchange relationship. Investments represent the relevant attributes brought by the individual to the exchange relationship. The two primary theories underlying pay satisfaction research have been equity theory and discrepancy theory (Lawler, 1971) that represent an extension of equity theory.
Frequency Distribution
Table Gender of the respondents
Frequency | Percent | Valid Percent | Cumulative Percent | |
| male | ||||
17 | 56.7 | 56.7 | 56.7 | |
| Female | ||||
13 | 43.3 | 43.3 | 100.0 | |
| Total | ||||
30 | 100.0 | 100.0 |
Among all the employees female 43.3% and56.7% of the employees male about the fact that Gender of Respondent
Table Department of the responds
Frequency | Percent | Valid Percent | Cumulative Percent | |
| General banking | ||||
11 | 36.7 | 36.7 | 36.7 | |
| Foreign Exchange | ||||
12 | 40.0 | 40.0 | 76.7 | |
| credit | ||||
3 | 10.0 | 10.0 | 86.7 | |
| Cash | ||||
4 | 13.3 | 13.3 | 100.0 | |
| Total | ||||
30 | 100.0 | 100.0 |
Among all the employee there are 36.7% are in General Banking, 40% are Foreign Exchange, 10% are Credit and 13.3% are Cash
Table Age of the respond
Frequency | Percent | Valid Percent | Cumulative Percent | |
| 26 to 30 | ||||
13 | 43.3 | 43.3 | 43.3 | |
| 31 to 35 | ||||
9 | 30.0 | 30.0 | 73.3 | |
| 36 to 40 | ||||
5 | 16.7 | 16.7 | 90.0 | |
| Above 40 | ||||
3 | 10.0 | 10.0 | 100.0 | |
| Total | ||||
30 | 100.0 | 100.0 |
Among all the employees (26-30 years) 43.3% and 30% employees (31-35years) about the fact that Age of Respondent. 16.7% of the employees (36-40years) and 10% employees ( above 40) with this fact
Table No of years in TBL of the respond
Frequency | Percent | Valid Percent | Cumulative Percent | |
| less than 1 year | ||||
8 | 26.7 | 26.7 | 26.7 | |
| 1 to 5 years | ||||
12 | 40.0 | 40.0 | 66.7 | |
| 6 to 10 years | ||||
9 | 30.0 | 30.0 | 96.7 | |
| 11 to 15 years | ||||
1 | 3.3 | 3.3 | 100.0 | |
| Total | ||||
30 | 100.0 | 100.0 |
Among all the employees (Less than 1 years) 26.7% and 40% employees (1-5years) about the fact that years of service of respondent. 30% of the employees (6-10years) and 3.3%of the employee (11-15 years) with this fact
Table Management of the trust bank periodically review the salary package of employee
Frequency | Percent | Valid Percent | Cumulative Percent | |
| Strongly Disagree | ||||
2 | 6.7 | 6.7 | 6.7 | |
| Disagree | ||||
4 | 13.3 | 13.3 | 20.0 | |
| neurtal | ||||
8 | 26.7 | 26.7 | 46.7 | |
| Agree | ||||
9 | 30.0 | 30.0 | 76.7 | |
| Strongly Agree | ||||
7 | 23.3 | 23.3 | 100.0 | |
| Total | ||||
30 | 100.0 | 100.0 |
According to the table, 2 respondents said that, they are “Strongly Disagree” about this statement. Another 4 respondents have “Disagree” with this statement. And another 8 respondents have “Neutral” with this statement.9 respondents said that ”Agree’’ and 7 respondents are said ‘’ Strongly agree’’ with this statement.
Table Salary package is flexible and accommodate excellence.
Frequency | Percent | Valid Percent | Cumulative Percent | |
| Strongly Disagree | ||||
1 | 3.3 | 3.3 | 3.3 | |
| Disagree | ||||
10 | 33.3 | 33.3 | 36.7 | |
| Neutral | ||||
9 | 30.0 | 30.0 | 66.7 | |
| Agree | ||||
8 | 26.7 | 26.7 | 93.3 | |
| Stongly Agree | ||||
2 | 6.7 | 6.7 | 100.0 | |
| Total | ||||
30 | 100.0 | 100.0 |
According to the table, 9 respondents were “Neutral” with this statement. Another 8 respondents have “Agreed” with this statement. And another 2 respondents have “Strongly Agreed” with this statement. This is respectively 30%, 26% and 7%. And 1 respondents said ‘’ Strongly Disagree’’ 10 respondents said ‘’Disagree’’ with this statement. This is respectively 4% and 34%.
Table Salary package reflect current job market requirements.
Frequency | Percent | Valid Percent | Cumulative Percent | |
| Strongly Disagree | ||||
3 | 10.0 | 10.0 | 10.0 | |
| Disagree | ||||
6 | 20.0 | 20.0 | 30.0 | |
| Neutral | ||||
5 | 16.7 | 16.7 | 46.7 | |
| agree | ||||
9 | 30.0 | 30.0 | 76.7 | |
| Strongly agree | ||||
7 | 23.3 | 23.3 | 100.0 | |
| Total | ||||
30 | 100.0 | 100.0 |
According to the table, 5 respondents were “Neutral” with this statement. Another 9 respondents have “Agreed” with this statement. And another 7 respondents have “Strongly Agreed” with this statement. This is respectively 17%, 30% and 23%. And 3 respondents said ‘’Strongly Disagree’’ 3 respondents said ‘’Disagree’’ So it can be easily said that, some of the respondents aware whether the salary package reflects current job market requirements.
Table I am satisfied with my salary.
Frequency | Percent | Valid Percent | Cumulative Percent | |
| Strongly Disagree | ||||
3 | 10.0 | 10.0 | 10.0 | |
| Disagree | ||||
7 | 23.3 | 23.3 | 33.3 | |
| Neutral | ||||
8 | 26.7 | 26.7 | 60.0 | |
| Agree | ||||
8 | 26.7 | 26.7 | 86.7 | |
| Strongly Agree | ||||
4 | 13.3 | 13.3 | 100.0 | |
| Total | ||||
30 | 100.0 | 100.0 |
According to the table, 8 respondents were “Neutral” with this statement. Another 8 respondents have “Agreed” with this statement. And another 4 respondents have “Strongly Agreed” with this statement. This is respectively 27%, 27% and 14%. And 3 respondents said ‘’Strongly Disagree’’ 7 respondents said ‘’Disagree’’ So it can be easily said that, some of the respondents aware whether So it can be easily said that, most of the respondents are satisfied with their salary.
Table : Salary package are commensurate with quality and capabilities of employee.
Frequency | Percent | Valid Percent | Cumulative Percent | |
| Disagree | ||||
9 | 30.0 | 30.0 | 30.0 | |
| Neutral | ||||
7 | 23.3 | 23.3 | 53.3 | |
| Agree | ||||
10 | 33.3 | 33.3 | 86.7 | |
| Strongly Agree | ||||
4 | 13.3 | 13.3 | 100.0 | |
| Total | ||||
30 | 100.0 | 100.0 |
According to the table, 7 respondents were “Neutral” with this statement. Another 10 respondents have “Agreed” with this statement. And another 4 respondents have “Strongly Agreed” with this statement. This is respectively 24%, 34% and 14%. And 9 respondents said ‘’Strongly Disagree’’ So it can be easily said that, some of the respondents aware whether So it can be easily said that, most of the employees think that their salary packages are commensurate with quality and capabilities.
Table I am paid fairly.
Frequency | Percent | Valid Percent | Cumulative Percent | |
| Strongly Disagree | ||||
2 | 6.7 | 6.7 | 6.7 | |
| Disagree | ||||
4 | 13.3 | 13.3 | 20.0 | |
| Neutral | ||||
11 | 36.7 | 36.7 | 56.7 | |
| Agree | ||||
6 | 20.0 | 20.0 | 76.7 | |
| Strongly Agree | ||||
7 | 23.3 | 23.3 | 100.0 | |
| Total | ||||
30 | 100.0 | 100.0 |
According to the table, 11 respondents were “Neutral” with this statement. Another 6 respondents have “Agreed” with this statement and 7 respondents said ‘’ Strongly Agree’’ This is respectively 37% and 20% and 24%. And 2 respondents said’ Strongly Disagree’’ 4 respondents said ‘’Disagree’’ So it can be easily said that, from the employees of The Trust Bank Limited are paid fairly.
Table The Trust Bank Limited offers a comprehensive benefits package.
Frequency | Percent | Valid Percent | Cumulative Percent | |
| Disagree | ||||
8 | 26.7 | 26.7 | 26.7 | |
| Neutral | ||||
9 | 30.0 | 30.0 | 56.7 | |
| Agree | ||||
4 | 13.3 | 13.3 | 70.0 | |
| Strongly Agree | ||||
9 | 30.0 | 30.0 | 100.0 | |
| Total | ||||
30 | 100.0 | 100.0 |
According to the table, 9 respondents were “Neutral” with this statement. Another 4 respondents have “agreed” with this statement. And another 9 respondents have “Strongly Agree” with this statement. This is respectively 30%, 13% and 30% And 8 respondents said ‘’ Disagree’’. So it can be easily said that, most of the respondents think The Trust Bank Ltd offer a comprehensive benefits package.
Table The Trust Bank Limited offers better benefits than other private banks
Frequency | Percent | Valid Percent | Cumulative Percent | |
| Strongly Disagree | ||||
5 | 16.7 | 16.7 | 16.7 | |
| Disagree | ||||
9 | 30.0 | 30.0 | 46.7 | |
| Neutral | ||||
8 | 26.7 | 26.7 | 73.3 | |
| Agree | ||||
3 | 10.0 | 10.0 | 83.3 | |
| Strongly Agree | ||||
5 | 16.7 | 16.7 | 100.0 | |
| Total | ||||
30 | 100.0 | 100.0 |
According to the table, 8 respondents were “Neutral” with this statement. Another 3 respondents have “agreed” with this statement. And another 5 respondents have
“Strongly Agree” with this statement. This is respectively 27%, 10% and 17% And 9 respondents said ‘’ Disagree’’ .and 5 respondents said ‘’ Strongly Disagree’’ So it can be easily said that, most of the respondents think The Trust Bank Ltd does not offer better benefits than other private banks.
Table The Benefits statement I receive is clear and easy to understand.
Frequency | Percent | Valid Percent | Cumulative Percent | |
| Strongly Disagree | ||||
5 | 16.7 | 16.7 | 16.7 | |
| Disagree | ||||
7 | 23.3 | 23.3 | 40.0 | |
| Neutral | ||||
8 | 26.7 | 26.7 | 66.7 | |
| Agree | ||||
5 | 16.7 | 16.7 | 83.3 | |
| Strongly Agree | ||||
5 | 16.7 | 16.7 | 10 0.0 | |
Total | 30 | 100.0 | 100.0 |
According to the table, 8 respondents were “Neutral” with this statement. Another 5 respondents have “agreed” with this statement. And another 5 respondents have “Strongly Agree” with this statement. This is respectively 27%, 17% and 17% And 7 respondents said ‘’ Disagree’’ .and 5 respondents said ‘’ Strongly Disagree’’ So it can be easily said that, most of the respondents think the benefits statement they receive is more or less clear and easy to understand.
Table The information related to benefits provided by the bank is accurate and helpful.
Frequency | Percent | Valid Percent | Cumulative Percent | |
| Strongly Disagree | ||||
3 | 10.0 | 10.0 | 10.0 | |
| Disagree | ||||
9 | 30.0 | 30.0 | 40.0 | |
| Neutral | ||||
8 | 26.7 | 26.7 | 66.7 | |
| Agree | ||||
5 | 16.7 | 16.7 | 83.3 | |
| Strongly Agree | ||||
5 | 16.7 | 16.7 | 100.0 | |
| Total | ||||
30 | 100.0 | 100.0 |
According to the table, 8 respondents were “Neutral” with this statement. Another 5 respondents have “agreed” with this statement. And another 5 respondents have “Strongly Agree” with this statement. This is respectively 27%, 17% and 17% And 9 respondents said ‘’ Disagree’’ .and 3 respondents said ‘’ Strongly Disagree’’ So it can be easily said that, most of the employee think the information related to benefits provided by the bank is accurate and helpful.
TableThe Benefits offered provide security for me and for my family.
Frequency | Percent | Valid Percent | Cumulative Percent | |
| Strongly Disagree | ||||
4 | 13.3 | 13.3 | 13.3 | |
| Disagree | ||||
4 | 13.3 | 13.3 | 26.7 | |
| Neutral | ||||
10 | 33.3 | 33.3 | 60.0 | |
| Agree | ||||
7 | 23.3 | 23.3 | 83.3 | |
| Strongly Agree | ||||
5 | 16.7 | 16.7 | 100.0 | |
| Total | ||||
30 | 100.0 | 100.0 |
According to the table, 10 respondents were “Neutral” with this statement. Another 7 respondents have “agreed” with this statement. And another 5 respondents have “Strongly Agree” with this statement. This is respectively 34%, 23% and 17% And 4 respondents said ‘’ Disagree’’ .and 4 respondents said ‘’ Strongly Disagree’’ So it can be said that, few of the respondents think that their Benefits offered provide security for him and for his family is not true. Moreover, most of the employees are think whether their Benefits offered provide security for him and for his family.
Table I recognize my Benefits are part of an employee total compensation program.
Frequency | Percent | Valid Percent | Cumulative Percent | |
| Strongly Disagree | ||||
4 | 13.3 | 13.3 | 13.3 | |
| Disagree | ||||
8 | 26.7 | 26.7 | 40.0 | |
| Neutral | ||||
9 | 30.0 | 30.0 | 70.0 | |
| Agree | ||||
6 | 20.0 | 20.0 | 90.0 | |
| Strongly Agree | ||||
3 | 10.0 | 10.0 | 100.0 | |
| Total | ||||
30 | 100.0 | 100.0 |
According to the table, 9 respondents were “Neutral” with this statement. Another 6 respondents have “agreed” with this statement. And another 3 respondents have “Strongly Agree” with this statement. This is respectively 30%, 20% and 10% And 8 respondents said ‘’ Disagree’’ .and 4 respondents said ‘’ Strongly Disagree’’ So it can be easily said that, most of the respondents think they recognize their Benefits are part of an employee total compensation program.
Table The Trust Bank Limited offers an excellent retirement plan.
Frequency | Percent | Valid Percent | Cumulative Percent | |
| Strongly Disagree | ||||
4 | 13.3 | 13.3 | 13.3 | |
| Disagree | ||||
9 | 30.0 | 30.0 | 43.3 | |
| Neutral | ||||
6 | 20.0 | 20.0 | 63.3 | |
| Agree | ||||
5 | 16.7 | 16.7 | 80.0 | |
| Strongly Agree | ||||
6 | 20.0 | 20.0 | 100.0 | |
| Total | ||||
30 | 100.0 | 100.0 |
According to the table 6 respondents were “Neutral” with this statement. Another 5 respondents have “agreed” with this statement. And another 6 respondents have “Strongly Agree” with this statement. This is respectively 20%, 17% and 20% And 9 respondents said ‘’ Disagree’’ .and 4 respondents said ‘’ Strongly Disagree’’ .So it can be easily said that, some of the respondents think The Trust Bank Limited are not offers an excellent retirement plan.
Table I am satisfied with the overall benefits and compensation package of the The Trust Bank Limited.
Frequency | Percent | Valid Percent | Cumulative Percent | |
| Strongly Disagree | ||||
5 | 16.7 | 16.7 | 16.7 | |
| Disagree | ||||
6 | 20.0 | 20.0 | 36.7 | |
| Neutral | ||||
7 | 23.3 | 23.3 | 60.0 | |
| Agree | ||||
8 | 26.7 | 26.7 | 86.7 | |
| Strongly Agree | ||||
4 | 13.3 | 13.3 | 100.0 | |
| Total | ||||
30 | 100.0 | 100.0 |
According to the table 7 respondents were “Neutral” with this statement. Another 8 respondents have “agreed” with this statement. And another 4 respondents have “Strongly Agree” with this statement. This is respectively 23%, 27% and 13% And 6 respondents said ‘’ Disagree’’ .and 5 respondents said ‘’ Strongly Disagree’’
Findings
On the basis of this report analysis part, it was found that in some of the cases there are most of respondents who totally “Dissatisfied” with the statements. Another in some of the cases there are most of respondents who are not “Conscious” with the statements. But most of the cases in between the analysis the respondents are totally “Satisfied” or “Strongly Satisfied” with the statements which are given below:
- Around half of the employees think that Trust Bank Ltd. periodically reviews the salary package.
- Some of the employees think that Salary package is not flexible and cannot accommodate excellence.
- Some of the employees think that Salary package of Trust Bank Ltd. does not reflect current job market requirements.
- Around half of the employees are dissatisfied with the salary provided by Trust Bank Ltd.
- Around half of the employees think that Trust Bank Limited does not offer better benefits than other private banks.
- According to some of the employees’ responses, it is found that the information related to benefits provided by the bank is not accurate and helpful.
- Some of the employees disagree about the fact the benefits offered can provide security for them and for their family.
- Around half of the employees think that Trust Bank Limited does not offer an excellent retirement plan.
- Overall, all the employees are not satisfied about the benefits and compensation package of Trust Bank Limited.
Recommendations
- Trust Bank Limited may be more flexible in terms of the salary package so that the employees’ payment can be adjusted with their performance. This will increase the employee motivation.
- They may increase the amount of the salary of the employees according to the pay survey information conducted on other competitive banks.
- Trust Bank should offer better benefits to the employees similar as the other banks’ employee benefit programs.
- Employee benefit programs can be designed in such a way so that it can ensure employee and employee’s families well-being.
- The bank may also revise its current retirement plan, as many of the employees are dissatisfied in terms of retirement plan. In case also Trust Bank Limited may collect data from other banks and adjust accordingly.
Conclusion
This report is a very effective conduct to study a problem. It helps me to analysis how and why a situation exists in between the overall compensation package. This report makes me possible to find out new things and ideas and make accessible me accurate and consistent information which can be used as basis for making decision for immediate and future actions. All the way through the report I can reach the solution of an exacting difficulty. From the analysis part it has been clear to me that The Trust Bank Limited employees were not much positive about their overall compensation package including Salary and Benefits. Some employees are dissatisfied about different features of the compensation package. So if Trust Bank Limited wants to retain employees in long-term, it should try to accommodate accordingly.