Executive Summary
Banks play a major role in maintaining confidence in the monetary system of a country.
This study investigates about different forecasting techniques of foreign exchange markets. This includes different forecasting techniques which are followed by HSBC and also some other forecasting methods which I have suggested to do in stead of the current techniques followed by the bank.
The foreign exchange market has played a vital role in the last decade or so in guiding the purchase and sale of goods, services and raw materials globally. The market directly affects country’s bond, equities, private property, manufacturing and all assets that are available to foreign investors. The market is a stabilizing factor in the world system of monetary exchange and was created not by design but necessity.
Foreign exchange rates also play a major role in determining who finances government deficits, which buys equities in companies and literally effects and influences the economic scenario of every nation to cope with the foreign exchange risk in an open market economy. The market has its own momentum and therefore it is crucial to follow a universal time tested policy to tackle the forces behind the free market system with minimal risk involvement.
This study is based on both primary and secondary data, which are collected from many sources.
1.0.Introduction
Hong Kong Shanghai Banking Corporation (HSBC)
Headquartered in London, HSBC is one of the largest banking and financial services organizations in the world. It began operations in Hong Kong more than 130 years ago. The HSBC Group’s international network comprises some 7,000 offices in 80 countries and territories in Europe, the Asia-Pacific region, the Americas, the Middle East and Africa. With listings on the London, Hong Kong, New York and Paris stock exchanges, around 190,000 shareholders in some 100 countries and territories hold shares in HSBC. Through a global network linked by advanced technology, including a rapidly growing e-commerce capability, HSBC provides a comprehensive range of financial services: personal, commercial, corporate, investment and private banking; trade services; cash management; treasury and capital markets services; insurance; consumer and business finance;
HSBC group Vision & Values:
Become the world’s leading financial services company.
- Long term, ethical client service.
- High productivity through teamwork.
- Confident and ambitious sense of excellence.
- Capable of creativity and strong marketing.
HSBC’s Business Principal and value:
The HSBC Group is committed to five Business Principles:
- Outstanding customer service;
- Effective and efficient operations;
- Strong capital liquidity;
- Conservative lending policy;
- Strict expense discipline;
HSBC in Bangladesh
The HSBC Asia Pacific group represents HSBC in Bangladesh. HSBC opened its first branch in Dhaka in 17th December 1996 to provide personal banking services, trade and corporate services, and custody services. The Bank was awarded ISO9002 accreditation for its personal and business banking services, which cover trade services, securities and safe custody, corporate banking, Hexagon and all personal banking. This ISO9002 designation is the first of its kind for a bank in Bangladesh. The Hong Kong and Shanghai Banking Corporation Bangladesh Ltd. primarily limited its operations to help garments industry and to commercial banking. Latter, it is extended to pharmaceuticals, jute and consumer products. Other services include cash management, treasury, securities, and custodial service.
HSBC in Bangladesh also specializes in self-service banking through providing 24-hour ATM services. In total the branch currently has 9 ATM’s (5 on-site & 4 offsite) located at various geographical areas of Dhaka & Chittagong.
Operations of Global Markets:
HSBC’s operations in Global Markets consist of treasury and capital markets services for supranational, central banks, corporations, institutional and private investors, financial institutions and other market participants. Products include:
• Foreign exchange;
• Currency, interest rate, bond, credit, equity and other specialized derivatives;
• Government and non-government fixed income and money market instruments;
• Precious metals and exchange traded futures;
• Equity services, including research, sales and trading for institutional, corporate and private clients and asset management services, including global investment advisory and fund management services; and
• Distribution of capital markets instruments, including debt, equity and structured products, utilizing links with HSBC’s global networks. Corporate and Investment Banking
The main purpose of treasury is to:
- Manage bank’s assets and liabilities.
- Promote and sell bank’s product.
- Manage the Bank’s excess/short foreign exchange products.
- Manage the bank’s excess/short interest rate products.
Some Typical Treasury Products
- Spot foreign exchange
- Forward foreign exchange
- Swaps : a) currency b) interest rate & c) structured
- Options : a) plain vanilla & b) complex
- Derivatives : a) plain vanilla & b) structured
- Securities : a) T-Bills and T-Bonds b) FRNs
- Repo & Reverse Repo : Repurchase / Sell-Buy transactions
- Money market : overnight and term deposits
2.0 Statement of the Problem
Now a days, competition between banks has really increased in Bangladesh as there are quite a large numbers of bank’s has established in past few years. So it has really important for HSBC to hold up there current customers. So the management of HSBC is facing a lot of competition and also thinking how they can attract new customers.
In this research I have tried to show different forecasting techniques of exchange rate, some forecasting problems in the forex markets due to technical problem or wrong prediction and also tried to recommend some solution to overcome these problems.
3.0 Purpose of the study
The purposes of this paper are to establish rational behind the activity and to enlighten a core area of operation- to forecast the exchange rate. Within the two major forecasting techniques, more emphasis is given on the technical forecasting techniques which is followed by HSBC and I have also tried to shown some alternative forecasting techniques and also suggested the best one I found based on my calculations. A detailed discussion of these is presented in this paper.
The purpose of the study is to explore different forecasting techniques of foreign exchange markets, technical analysis basics of foreign exchange market, business utilization of technical analysis, use of technical analysis in HSBC, some risks involved in foreign exchange market and also the way to avoid mistakes in foreign exchange market
4.0 Research Time Line
| 2007-Sept | Writing Research Proposal |
| 2007-Sept | Developing Literature Review |
| 2007-Sept | Collecting Data |
| 2007-Oct | Data Analysis and Interpretation of the Findings |
| 2007-Nov | Preparing Draft and Finalizing the Research Paper |
| 2007-Dec | Submission of the Research Paper |
5.0 Limitation of the Study
- The major limitations of the technical analysis is, it may or may not produces the accurate projections of the foreign currency rates as a large amount of dependency on the dealers perspective. Also experience is the countable variables here, which cannot be expressed, in any mathematical models.
- According to the technical forecasting techniques the market has it own destiny and the major part of the analysis based on to determine the future. So major social or economical even political events can change it a lot. So dealers must be reactive rather than proactive.
- Time frame for the research was very limited.
- Large-scale research was not possible due to constraints and restrictions posed by the organization.
- Getting relevant papers and documents were strictly prohibited.
- The limitations that I already faced are to unable to collect local financial data, and also direct interviewing to managers doesn’t reveal many aspects of HSBC which they deny to answer or doesn’t want to answer due to their own personal career security at HSBC
- One of the main barriers in writing this report was the confidentiality of data. Though I saw their internal procedure that is being used in processing and evaluating any documentary credit, but I was told strictly not to disclose that even in my internship report.
6.0 Literature Review
Financial markets could mean:
1. Organizations that facilitate the trade in financial products. i.e. Stock exchanges facilitate the trade in stocks, bonds and warrants.
2. The coming together of buyers and sellers to trade financial products. i.e. stocks and shares are traded between buyers and sellers in a number of ways including: the use of stock exchanges; directly between buyers and sellers etc.
In academia, students of finance will use both meanings but students of economics will only use the second meaning.
Financial markets can be domestic or they can be international.
The foreign exchange (currency or forex or FX) market exists wherever one currency is traded for another. It is by far the largest financial market in the world, and includes trading between large banks, central banks, currency speculators, multinational corporations, governments, and other financial markets and institutions. The average daily trade in the global forex and related markets currently is over US$ 3 trillion. Retail traders (individuals) are a small fraction of this market and may only participate indirectly through brokers or banks, and are subject to forex scams
The term FOREX is derived from the words Foreign exchange and is the largest financial market in the world. Unlike many markets the FX market is open 24 hours per day and has an estimated $1.2 Trillion in turnover every day. This tremendous turnover is more than the combined turnover of the main worlds’ stock markets on any given day. This trends to lead to a very liquid market and thus a desirable market to trade.
Unlike many other securities (any financial instrument that can be traded) the FX market does not have a fixed exchange. It is primarily traded through banks, brokers, dealers, financial institutions and private individuals.
The Foreign Exchange market is a worldwide network which connects the various national exchange markets by telephone and telex etc, either directly or via brokers, to transact foreign exchange business.
The Foreign Exchange, also referred to as the “Forex” or “Spot FX” market, is the largest financial market in the world. Money is traded in the FX market. Forex trading is where the currency of one nation is traded for that of another. Therefore, Forex trading is always traded in pairs. The most commonly traded currency pairs are traded against the US Dollar (USD). They are called ‘the Majors’. The major currency pairs are the Euro Dollar (EUR/USD); the British Pound (GBP/USD); the Japanese Yen (USD/JPY); and the Swiss Franc (USD/CHF).
The notable ‘commodity’ currency pairs that trade are the Canadian Dollar (USD/CAD) and the Australian Dollar AUD/USD. Because there is not a central exchange for the Forex market, these pairs and their crosses are traded over the telephone and online through a global network of banks, multinational corporations, importers and exporters, brokers and currency traders.
“Technical analysis is the study of market action, primarily through the use of charts, for the purpose of forecasting future price trends.” In its purest form, technical analysis considers only the actual price behavior of the market or instrument, based on the premise that price reflects all relevant factors before an investor becomes aware of them through other channels.
Technical analysis is widely used among traders and financial professionals, and some studies say its use is more widespread than is “fundamental” analysis in the foreign exchange market. Academics such as Eugene Fama say the evidence for technical analysis is sparse and is refuted by the efficient market hypothesis, yet some Federal Reserve and academic studies include evidence that supports technical analysis. MIT finance professor Andrew Lo argues that “several academic studies suggest that…technical analysis may well be an effective means for extracting useful information from market prices.” Burton Malkiel argues, “Technical analysis is anathema to the academic world.” He further argues that under the weak form of the efficient market hypothesis, “…you cannot predict future stock prices from past stock prices.
7.0 Forecasting techniques in the foreign exchange markets:
Currently there are widely accepted two alternative techniques for forecasting, namely
1. Fundamental Analysis
2. Technical Analysis
7.1 Fundamental Analysis
A method of currency valuation which involves examining the countries financial figures like import/exports, balance of trade, reserve on currency, political and economical news etc. Fundamental analysis takes into consideration only those variables that are directly related to the country itself, rather than the overall state of the market or technical analysis data.
Fundamental analysis is the examination of the underlying forces that affect the well being of the economy, industry groups, and companies. As with most analysis, the goal is to derive a forecast and profit from future price movements. At the company level, fundamental analysis may involve examination of financial data, management, business concept and competition. At the industry level, there might be an examination of supply and demand forces for the products offered. For the national economy, fundamental analysis might focus on economic data to assess the present and future growth of the economy. To forecast future stock prices, fundamental analysis combines economic, industry, and company analysis to derive a stock’s current fair value and forecast future value. If fair value is not equal to the current stock price, fundamental analysts believe that the stock is either over or under valued and the market price will ultimately gravitate towards fair value. Fundamentalists do not heed the advice of the random walkers and believe that markets are weak-form efficient. By believing that prices do not accurately reflect all available information, fundamental analysts look to capitalize on perceived price discrepancies.
7.1. a General Steps to Fundamental Evaluation
Even though there is no one clear-cut method, a breakdown is presented below in the order an investor might proceed. This method employs a top-down approach that starts with the overall economy and then works down from industry groups to specific companies. As part of the analysis process, it is important to remember that all information is relative. Industry groups are compared against other industry groups and companies against other companies. Usually, companies are compared with others in the same group. For example, a telecom operator (City cell) would be compared to another telecom operator (Gremeen Phone), not to an Electronics company (Philips).
7.1. b Economic Forecast
First and foremost in a top-down approach would be an overall evaluation of the general economy. The economy is like the tide and the various industry groups and individual companies are like boats. When the economy expands, most industry groups and companies benefit and grow. When the economy declines, most sectors and companies usually suffer. Many economists link economic expansion and contraction to the level of interest rates. Interest rates are seen as a leading indicator for the stock market as well.
Below is a chart of the S&P 500 and the yield on the 10-year note over the last 30 years. Although not exact, a correlation between stock prices and interest rates can be seen. Once a scenario for the overall economy has been developed, an investor can break down the economy into its various industry groups.
7.2 Technical Analysis
In contrast to the efficient market hypothesis or fundamental analysis, technical analysis involves the examination of past data like prices and volume of trading, which leads to an estimation of future price trends and there of an investment decision. Technical analysis don’t require any analysis of the multitude of economic, industry and company variables to arrive at an estimate of future value because they believe that past price movements will signal future price movements.
7.2. a Underlying assumptions of technical analysis
1. The market value of any goods and service is determined solely by the interaction of supply and demand
2. Supply and demand is governed by numerous factors, both rational and irrational.
3. Disregarding minor fluctuations, the prices for individual securities and the overall value of the market tend to move in trends, which persists for appreciable length of time
4. Prevailing trends change in reaction to shifts in supply and demand relationships. These shifts, no matter why they occur can be detected sooner or later in the action of the market itself.
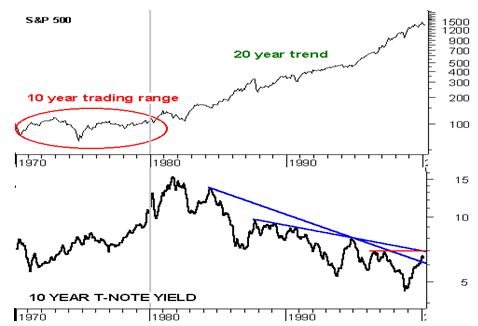
(Figure: 1- A chart of the S&P 500 and the yield on the 10-year note over the last 30 years)
7.2. The main considerations in Technical Analysis
Price: Changes in price reflect in investor attitudes and demand and supply of securities.
Time: The degree of movements in price is a function of time. The longer it takes for a reversal in trend for instance, the greater the price changes that would follow.
Volume: The intensity of price changes is reflected in the volume transactions that accompany the changes. An increase is not strong enough.
Breadth: Study of Breadth of market indicators, the extent to which the price changes have taken place in the market in accordance with a certain overall limit.
8.0 Research Methodology:
8.1 Research Design:
Source of Data
Both the primary as well as the secondary form of data was used to prepare the report. The details of these sources are highlighted below:
8.1. a Primary Sources
Major sources of primary information were discussions with Mr. Wahiduzzaman and Md. Bahaudding Saad, Dealers of global markets.
8.1.b Secondary Sources
Secondary information was collected from relevant documents and literature, HSBC Internet web sites, ABC guide to foreign exchange, treasury.
Other secondary sources were books on foreign exchange and treasury back office stuffs.
8.2 Data Collection
For data collection I have interviewed dealers of global markets and also the treasurer of global market. I have asked them many questions about my related topics. Some questions are:
- What are the operations of Global Markets?
- What are the main purposes of Treasury?
- What are the Treasury products HSBC is using right now?
- What are the forecasting techniques of foreign exchange market?
- What are the Basic for technical analysis?
8.3 Data Analysis
Here are some Forecasting Techniques followed by HSBC in their Foreign Exchange Markets:
8.3.1 Technical Analysis Basics
8.3.1. a Rationale
–Examination of the past price movements to forecast future movements
–Price Discounts Everything
–Price Movements are not Totally Random
–What is More Important than Why
–Discipline – divorce yourself from emotions
– Volume for Stock, Open Interest & volume for Futures
8.3.1. b Types of Charts
- Line,
- Bar,
- Candle,
- Points & Figure Etc
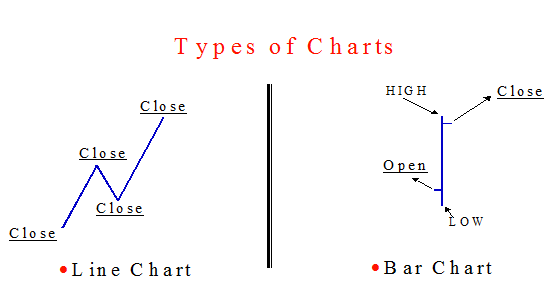
(Figure: 2- Types of charts used in forecasting)
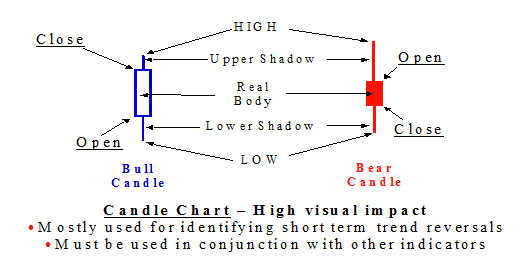
(Figure: 3- A price chart that displays the high, low, open, and close for a security each day over a specified period of time)
8.3.1. c Candle Chart
8.3.1. d Why Use Candle charts
“Make use of your opportunities.” (Japanese proverb)
The candlestick techniques we use today originated in the style of technical charting used by the Japanese for over 100 years before the West developed the bar and point-and-figure analysis systems. In the 1700s a Japanese man named Homma, a trader in the futures market, discovered that, although there was a link between price and the supply and demand of rice, the markets were strongly influenced by the emotions of the traders. He understood that when emotions played into the equation a vast difference between the value and the price of rice occurred. This difference between the value and the price is as applicable to stocks today as it was to rice in Japan centuries ago. The principles established by Homma are the basis for the candlestick chart analysis, which is used to measure market emotions towards a stock.
This charting technique has become very popular among traders. One reason is that the charts reflect only short-term outlooks–sometimes lasting less than eight to 10 trading sessions.
A big difference between the bar charts common in North America and the Japanese candlestick line is the relationship between opening and closing prices. We place more emphasis on the progression of today’s closing price from yesterday’s close. In Japan, chartists are more interested in the relationship between the closing price and the opening price of the same trading day.
8.3.2 Followings are some other Forecasting Techniques in which I have shown the calculations of forecasting foreign exchange rates and also based on the result I made recommendation for HSBC which they can be used instead of their current method:
Moving Average:
In the moving average method, we use the most recent n data values in the time series as the forecast for the next period. Mathematically, the moving average calculation is made as follows:
Moving Average=∑ (most recent n data values)/n
The term “moving” is used because every time a new observation becomes available for the time series, it replaces the oldest observations, and a new average is computed. The average changes, or moves, as new observations become available.
(See Appendix: 4- Calculation of moving average)
Exponential Smoothing Average:
Exponential smoothing uses a weighted average of past time values as the forecast, it is special case of the weighted moving averages method in which we select only one weight-the weight for the most recent observation. The weights for the other data values are computed automatically and become smaller as the observations move farther into the past. The basic exponential smoothing model follows:
Exponential Smoothing Average, F (t+1)=∞Yt+(1-∞)Ft
Where,
F (t+1) =forecast of the time series for period t+1
Yt =actual value of the time series in period t
Ft=forecast of the time series for period t
∞=smoothing constant (0≤∞≤1)
Or we can use the simplified form,
F(t+1)=0.2Yt+0.8Ft
(See Appendix: 5- Calculation of exponential smoothing average)
Seasonal Variation:
Seasonal variation is the patterns of change in a time series within a year. These patterns tend to repeat themselves each year.
The third component of a time series is the seasonal component. Many sales, production, and other series fluctuate with the seasons. The unit of time reported is either quarterly or monthly.
Almost all businesses tend to have recurring seasonal patterns. Men’s and boys’ clothing, for example, have extremely high sales just prior to Christmas and relatively low sales just after Christmas and during summer.
In the following Graph I will show you the comparison between different forecasting rate with the actual market rate (See appendix: 7):
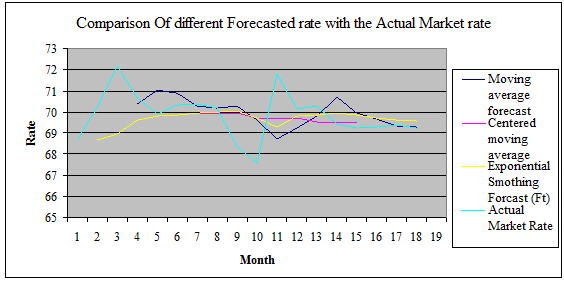
Among the three forecasting techniques, I think the moving average technique is the most appropriate, because from the graph you can see that among the three techniques the moving average techniques has the least spread than the other techniques compared to the actual forecasting techniques.
And also from the mean calculation(See-Appendix: 7),we can see that the spread between Moving Average method and the Actual Market rate is the least, which is 0.116172778,and it is the closest amongst the other methods. So, I can suggest HSBC to use the moving average method if they wants to change their current Forecasting Method.
Some More Parts-
Report on Forecasting Techniques in Foreign Exchange Markets (Part-1)
Report on Forecasting Techniques in Foreign Exchange Markets (Part-2)