The selection criteria for the patients on attendant:
patients suffering from RTIs /STIs and managed by syndromic management
patients who are willing and give herbal consent to be interviewed only are included in this study.
selection criteria of service providers:
working in the ~rnentioned urban primary healthcare centers (medical officers, nurses, paramedics, health workers and managers)
willing to participate and give herbal consent to take part in the study are included.
SAMPLE SIZE:
The study is a qualitative as well as quantitative one and about the sample size there is no rigidity. As study population is selected purposively so the formula is not necessary to calculate for this study.
DATA COLLECTION INTRUMENTS:
Checklist was completed, as per instruction by observation of the centers and interview questionnaire has been prepared for both the clients and providers. All providers efficiency are leveled on self rating score in five levels
5 = Excellent
4 = Good
3 = Average
2 = Fair
1 = Poor.
Answers should be selected in another sheet and marks would be given as per researcher requirement. Provider’s efficiency to assess the management practice practiced in urban care primary health care centers.
Providers efficiency Information questions and answers:
| Sl No | Questions | Excellent | Good | Average | Fair | Poor |
| 5 | 4 | 3 | 3 | 1 | ||
| 8 | What do you mean by syndromic approach? | Based on recognizing syndromes Syndromes are collection of and easily recognizabel sign. This gives the opportunity to treat the patients at the primary level requires little skill and provided treatment deals with majority of the organisms. | Based on recognizing syndromes. | Collections of signs | Idea not clear | No Comments |
| 9 | What are the types of Reproductive Tract Infections? | Three types, 1, Non sexually transmitted RTIs, 2. Sexually transmitted RTIs. 3 Sexually transmitted disease not infecting the reproductive tract organs | Tow types,1. Non sexually2. Sensually. | Trichomoniasis,CandidiasisSyphylisGonorrhoea
| SyphylisGonorrhea | No Comments |
| 10 | What do you mean by flow chart | For 7 syndromes, 7 flow charts are there Recetly due resistant of Ciproflaxacin, Cefixime & Azithromycin is | Mentioned 6 syndromes, | Can mentioned only 5 treatment only 5 syndromes | Only mentioned 2 syndromes | No Comments |
| 11 | What do you counsel your patients | I. Compliance with treatment-2, Counseling for preventoin 3. Condoms with demonstratoin of correct use 4. Contact tracing & treatment. | Can motioned only 3 from left columm | Can mentioned only 2f rom left column | Can mentioned only 1 from left column | No Comments |
| 12 | What do you mean by privacy in this case management |
| If answer only 3 from left column | If answer only 2 from left Column | If answer only 1 from left Column | No Comments |
| 13 | What are common complication of medicines prescribing in RTI/STI. | For 1. Metronidazole Nausia, Vomiting2. Drug residtance if irregular in treatment3. In case of pregnancy aboid tetracycline | If answer only 2 from left Column | If answer only 1 from left Column | Idea not clear | No Comments |
| 14 | What are advantages of Syndromic Management in Reproductive Tract Infections | 1. Reduces probability of incorrectclinical diagnosis by dealing with mostlikely sensitive agent.2. Presents and alternative whenlaboratory support is not available. 3. Standardize treatment at all revels of the health care system. 4. Allows patients to be treated electively at their first visit. 5. Uniformity in collecting data 6. Easy availability of drugs 7. Can be used even at primary health care level 8. Easy to train the health care provicers simple & easy to follow ~. Cost effective.
| If mentioned 7 | If mentioned 5 | If mentioned 1 to 4 | No Comments |
| 15 | What are the disadbangtages of sydromic Management in Reproductive Tract Infections |
| If mentioned 3 | If mentioned 2 | If mentioned 1 | No Comments |
| 16 | How do you dispose used gauze, cotton |
| If mentioned 2 | If mentioned 1 | Idea not clear | No Comments |
| 17 | How do you sterilize gloves |
| If mentioned 3 | If mentioned 2 | If mentioned 1 | No Comments |
| 18 | What do you mean by infection prevention steps |
| If mentioned 2 but can mentioning percentagte of cholrine solutioin & time | If mentioned 1 | Idea not clear | No Comments |
| 19 | What are consequences of RTIs/STIs |
| If mentioned 6 | If mentioned 5 | If mentioned 1 to 4 | No Comments |
| 20 | How do you maintain records of RTIs/STIs Patients |
| If mentioned 3 | If mentioned 2 | If mentioned 1 | No Comments |
SAMPLING TECHNIQUES:
No sampling technique arc uscd. Samples should be selected purposively.
DATA COLLECTION PROCEDURE:
Before the study should be carried out in the selected place. questionnaire is developed according to the oblectives. variables of the study.
The questionnaire was pre tested among some clients and providers in urban primary health care centers in Mohamm~idpur~ in Dhaka city to see its validity and reliability of questionnaire. Finalization oF the questionnaire and checking was done for necessary modi Iteation and correction.
Permission approach by the researcher from respected guide and NIPSOM authority and accordingly permission of the Managing Director was obtained. There after the clients and providers were approached and tht~ purpose of the study was explained to each potential clients and providers and their verbal consent t to participate in the study was obtained. Each consenting client and provider was individually interviewed face to face by using the interview questionnaire and by observation checklist was completed as per instruction. All possible measures were taken. kr maintaining privacy.
DATA PROCESSiNG AND ANALISIS:
Data entry. checking and analysis- collected data should be entered into a IBM-compatible PC using a d~ta base software. Generated data should be then subjected to in-depth statistical analysis using (statistical package for social science) SPSS. After generating a frequency distribution table at the fist instance, crossed tabulation (Cl-Il-square. fisher’s, exact test where needed) should be generated as an whenever needed.
More over a self retainii~g score has been done on the basis of total correct answer to see the efficiency of the providers in management practice in~ RTI/STI cases. the score that are used are. excellent = 5. good=4. average =3.
Fair2. Poor =1.
RESULT:
The study was conducted among 83 client and 26 service providers of one Urban primary health care project. The project area is six. Which runs by the NGO. MARIE STOPES CLINIC SOCIETY in collaboration, with Dhaka city corporation. funded by Asian development Bank at Mohammadpur in Dhaka
city. It has six primary health care centers flOW named as city health care center. The objectives were to find out the st~s o~ RTI/STI diagnosis. determine protective measures taken by service providers during patient examination, and assess” the state of practice of syndromic management of RTI/STI patients an,d record keeping system. In summery table I shows the percentage regarding the steps of management which includes history of present-illness, past-illness. physical examination, counseling and clinical follow-up.
The findings of data analyses and their interpretation are presented hereinafter.
Summary Table
Table I. Distribution of the Clients by steps of management (N =
Steps of diagnosis No %
History of present illness 79 95.2
History of past illness 82 98.8
Physical examination 83 100.0
Counseling 76 91.6
Clinical follow up 78 – – 94.0
* Total will not correspond to 100% because of multiple response.
Table I demonstrate that in majority of the cases steps of diagnosis were followed. History of present and past illness was taken in 95.2°i~ and 98.8% cases respectively. Counseling and clinical follow up was done in 91.6°/o and 94% cases respectively.
Table II. Distribution of the Clients by present complaints (N = 83*)
Cardinal complaints No %
Vaginal discharge 69 83.1
.Urethral discharge 03 3.6
Genital ulcer 13 15.7
InguinalBubo 01 1.2
Lower abdominal pain 16 19.3
Scrotal swelling 03 3.6
Neonatal conjunctivitis 02 2.4
Others 04 — 4.8
91.7
* Total will not correspond to 100% because of multiple response.
Table II shows the distribution of Clients by present complaints. Majority (83.1°/o) of the complained of vaginal discharge. followed by lower abdominal pain 19.3% and Genital ulcer 15.7%. Very few Clients complained of urethral discharge (3.6%). inguinal Bubo (1 .2°/o). scrotal swelling.
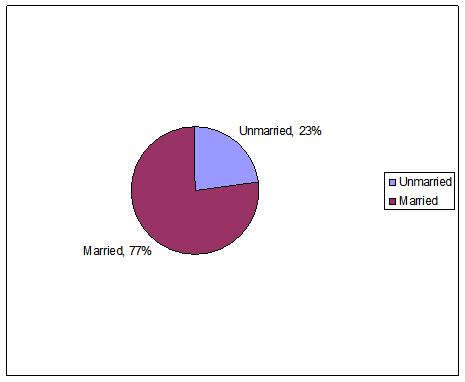
Table HI. Distribution of the service provider by sex (N = 26)
Sex No %
Mate 02
Female 24 92.3
100.00
Table 111 shows that majority (92.3%) of the service providers was female and only 2(7.7%) were males.
Table IV. Distribution of the Service provider by management efficiency (N = 83*)
Management efficiency
Discrete activities ______________________________________
Excellent Good Average Fair Poor
(4) (3) (2) (1)
Sydromic approach 6(23.1) 7(26.9) 9(34.6) 1(3.8) 3(1 L..5)
Types of RTIs/STIs 7(26.9) 11(42.3) 4(15.4) 3(11.5) 1(3.8)
Flow-chart of SM 8(30.8) 6(23.1) 3(11.5) 7(26.9) 2(7.7)
Counseling 2(76.9) 5(19.2) 00 00 1(3.8)
Privacy 22(84.6) 3(11.5) 00 1(3.8) 00
Complication of 1(3.8) 8(30.8) 2(7.7) 11(42.3) 4(15.4)
medicine
Merits of SM 1(3.8) l(46.2) 2(7.7) 10(38.5) 1(3.8)
Demerits of SM 00 10(38.5) 32(7.7) 12(46.2) 2(7.7)
Disposal of clinic waste 26(100.0) 00 00 00 00
Sterilization procedure 26(100.0) 00 00 00 00
Consequence of RTIs 00 7(26.9) 2(7.7) 12(46.2) 5(19.2)
Record keeping system 1(3.8) 10(38.5) 2(7.7) 6(23.1) 6(23.1)
Table IV demonstrates the distribution of service-providers by management efficiency. Majority of the Service provider attained either ‘excellent’ or ‘good’ score on all the discrete activities.
Table V. Distribution of the Service provider by management efficiency based on combined score(N = 83*)
Management No . %
Efficiency
Excellent(60—49) IG, 38.5
Good (48 — 37) 08 30.8
Average (36 — 25) 08 30.8
Fair(24— 13) 00 00
Poor(12) ____ 00 00
99.10
Table V demonstrates the management efficiency of the service providers based on combined score of 60 for 12 discrete activities. The total scores attained by the respondents were categorized into five categories with 60-49 being the excellent and 12 being the Poor with Good. Average & and Fair in between them. Based on the score attained by the respondents 38.5% were categorized into Excellent.. 30. 8% Good and the rest 30.8% Average.
Table VI. Association between age and management efficiency of service provider (N = 83*)
Management efficiency
Age (yrs) p-value
Excellent Good Average
(n=10) (n=8) (n=8)
30 3(3ØØ)* 3(37.5) 3(37.5)
30 — 40 5*50.0) 5(62.5) 4(50.0) 0.77 1
_40 2(20.0) 00 1(12.5)
*Figures in the parentheses denote corresponding %.
# Data were analyzed using Chi-square (x2) Test: level of significance was
0.05.
Table VI demonstrates the association between age and management efficiency. Half of the excellent efficiency was found among age group 30—40 years. 62.5% of the Good efficiency was also found in the same age group. However, no age group was found to be significantly associated with management efficiency (p = 0.771).
Table VII. Association between sex and management efficiency of Service providers (N = 83*)
Management efficiency
Sex pvalue#
Excellent Good Average
(n = 10) (n= 8) (n = 8)
Male 00 1(12.5) 1(12.5)
0.508
Female 10(100.0) 7(87.5) 7(87.5)
*Figures in the parentheses denote corresponding %.
,4 Data were analyzed using Chi-square (x2) Test: level of significance was 0.05. Table VII shows the association between sex and management efficiency. Neither male nor female sex was found associated with management efficiency. As only 2 service-provider were of male sex association between
Summary Table:
Table I. Distribution of the Clients by steps of management (N =
Steps of diagnosis No %
History of present illness 79 95.2
~.History of past illness 82 98.8
Physical examination 83 100.0
Counseling 76 91.6
Clinical follow up 78 – – 94.0
* Total will not correspond to 100% because of multiple response.
Table I demonstrate that in majority of the cases steps of diagnosis were followed. History of present and past illness was taken in 95.2°i~ and 98.8% cases respectively. Counseling and clinical follow up was done in 91.6°/o and 94% cases respectively.
Table II. Distribution of the Clients by present complaints (N = 83*)
Cardinal complaints No %
Vaginal discharge 69 83.1
.Urethral discharge 03 3.6
Genital ulcer 13 15.7
InguinalBubo 01 1.2
Lower abdominal pain 16 19.3
Scrotal swelling 03 3.6
Neonatal conjunctivitis 02 2.4
Others 04 — 4.8
91.7
* Total will not correspond to 100% because of multiple response.
Table II shows the distribution of Clients by present complaints. Majority (83.1°/o) of the complained of vaginal discharge. followed by lower abdominal pain 19.3% and Genital ulcer 15.7%. Very few Clients complained of urethral discharge (3.6%). inguinal Bubo (1 .2°/o). scrotal swelling.
Table HI. Distribution of the service provider by sex (N = 26)
Sex No %
Mate 02
Female 24 92.3
100.00
Table 111 shows that majority (92.3%) of the service providers was female and only 2(7.7%) were males.
Table IV. Distribution of the Service provider by management efficiency (N = 83*)
Management efficiency
Discrete activities ______________________________________
Excelle Good Average Fair Poor
nt (4) (3) (2) (1)
Sydromic approach 6(23.1) 7(26.9) 9(34.6) 1(3.8) 3(1 L..5)
Types of RTIs/STIs 7(26.9) 11(42.3) 4(15.4) 3(11.5) 1(3.8)
Flow-chart of SM 8(30.8) 6(23.1) 3(11.5) 7(26.9) 2(7.7)
Counseling 2(76.9) 5(19.2) 00 00 1(3.8)
Privacy 22(84.6) 3(11.5) 00 1(3.8) 00
Complication of 1(3.8) 8(30.8) 2(7.7) 11(42.3) 4(15.4)
medicine
Merits of SM 1(3.8) l(46.2) 2(7.7) 10(38.5) 1(3.8)
Demerits of SM 00 10(38.5) 32(7.7) 12(46.2) 2(7.7)
Disposal of clinic waste 26(100.0) 00 00 00 00
Sterilization procedure 26(100.0) 00 00 00 00
Consequence of RTIs 00 7(26.9) 2(7.7) 12(46.2) 5(19.2)
Record keeping system 1(3.8) 10(38.5) 2(7.7) 6(23.1) 6(23.1)
Table IV demonstrates the distribution of service-providers by management efficiency. Majority of the Service provider attained either ‘excellent’ or ‘good’ score on all the discrete activities.
Table V. Distribution of the Service provider by management efficiency based on combined score(N = 83*)
Management No . %
Efficiency
Excellent(60—49) IG, 38.5
Good (48 — 37) 08 30.8
Average (36 — 25) 08 30.8
Fair(24— 13) 00 00
Poor(12) ____ 00 00
99.10
Table V demonstrates the management efficiency of the service providers based on combined score of 60 for 12 discrete activities. The total scores attained by the respondents were categorized into five categories with 60-49 being the excellent and 12 being the Poor with Good. Average & and Fair in between them. Based on the score attained by the respondents 38.5% were categorized into Excellent.. 30. 8% Good and the rest 30.8% Average.
Table VI. Association between age and management efficiency of service provider (N = 83*)
Management efficiency
Age (yrs) p-value
Excellent Good Average
(n=10) (n=8) (n=8)
30 3(3ØØ)* 3(37.5) 3(37.5)
30 — 40 5*50.0) 5(62.5) 4(50.0) 0.77 1
_40 2(20.0) 00 1(12.5)
*Figures in the parentheses denote corresponding %.
# Data were analyzed using Chi-square (x2) Test: level of significance was
0.05.
Table VI demonstrates the association between age and management efficiency. Half of the excellent efficiency was found among age group 30—40 years. 62.5% of the Good efficiency was also found in the same age group. However, no age group was found to be significantly associated with management efficiency (p = 0.771).
Table VII. Association between sex and management efficiency of Service providers (N = 83*)
Management efficiency
Sex pvalue#
Excellent Good Average
(n = 10) (n= 8) (n = 8)
Male 00 1(12.5) 1(12.5)
0.508
Female 10(100.0) 7(87.5) 7(87.5)
*Figures in the parentheses denote corresponding %.
,4 Data were analyzed using Chi-square (x2) Test: level of significance was 0.05. Table VII shows the association between sex and management efficiency. Neither male nor female sex was found associated with management efficiency. As only 2 service-provider were of male sex association between
Table VIII. Association between length of job and management efficiency of Service providers (N = 83*)
Management efficiency
Length of job p_value#
(yrs) E~ccllent Good Average
_____ _____ (n10) (n=8) (n=8)
<5 6(60.0)* 4(50.0) ~5(62.5)
0.864
_ 5 4(40.0) 4(50.0) 3(37.5)
*Figures in the parentheses denote corresponding %.
# Data were analyzed using Chi-square (x2) Test: level of significance was
0.05.
Table VIII presents the association between length of job and management efficiency. Sixty percent of the excellent efficiency was found among the service providers with length of service below 5 year3. The length of service was not revealed to be associated with management efficiency of the service providers
(p = 0.864).
Table IX. Association between official status of service providers and management efficiency (N = 83*)
Management efficiency
Status of service p-valued
providers Excellent Good Average
____ (n10) (nf8) (n=8)
Medical officer 6(60.0) 3(37.5) 00
0.029
Others 4(40.0) 5(62.5) 8(lOb.0)
*Figures in the parentheses denote corresponding %.
# Data were analysed using Chi-square (X2) Test: level of significance was
0.05.
Table IX demonstrates the association between official status of the service providers and management efficiency. Sixty percent of the excellent service was provided by the medical officers compared to 40% by nurses and paramedics. The status of the service providers tends to be significantly associated with management efficiency (p 0.029).
Table X. Distribution of the Service Providers by protective measure
(N = 83*)
Efficiency
Protective measure ______ ____________
Excellent Good Average Fair Poor
_____ ______ (5) (4) (3) (2) (1)
Disposal of clinic waste 26(100.0) 00 00 00 00
Infection prevention 26(100.0) 00 00 00 00
steps ______________ _________ ________________________
Table X describes the protective measure adopted in the clinic. Disposal of clinic waste and infection prevention steps was 100% achieved.
Table XL Distribution of the Service providers by record keeping system of the RTI/ST1 Patients (N = 26*)
Efficiency
Record keeping system
Excellent Good Average Fair Poor
(5) (4) (3) (2) (1)
1(3.8) 10(38.5) 2(7.7) . 6(23.1) 7(26.9)
Table Xl shows that 3 8.5% of the record keeping system was good. followed by 23.1% fair, another 26.9% poor. 7.75 average and only 1(3.8%) excellent.
Table XII. Distribution of the Clients by other services provided (N =
83*)
Other services provided No %
• Partner management 37 44.6
Medicine supplied 79 95.2
– Referred for better Management 05 6.0
* Total will not correspond to 100% because of multiple response.
Table Xli demonstrates approximately 45% of the Clients told that their partners were managed . 95.2% informed that they received medicine from the clinic and 94% told that need of follow up visit was consulted as well.
Table Xlii.. Distribution of the Clients by age (N = 83)
Age (yrs)* No
<20 06 7.2
20—30 35 42.2
_ 30 42 50.6
* Mean age = (27.42 ± 7.32); Range = (11 —45) years.
Table XIII shows that half (50.6%) of the Clients were 30 years of age or more. followed by 20 — 30 years 42.2% and below 20 years only 7.2%. The mean age of the respondents was 27.42 ± 7.32 years and the lowest and highest ages were 11 and 45 years respectively.
Table XIV. Distribution of the Clients by occupation (N = 83)
Occupation No
Service 25 30.1
Business 01 1.2
I-louse-wife 36 43.4
Labour 06 7.2
Others 15 18.1
Table XIV describes that 43.4% of the Clients were house-wives. 30.1% service-holders. 7.2% labour and 18.1% were occupied with other jobs.
Fig. 1: Distribution of respondents by sex (n=83)
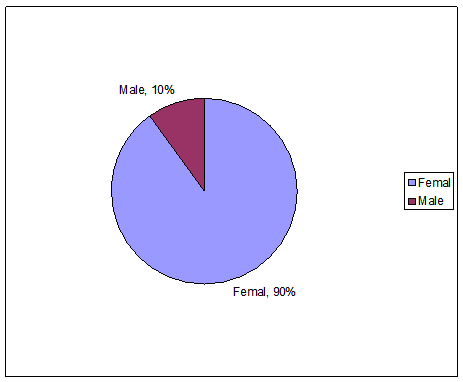
Fig. 1: Depicts that 90% of the respondents were female and the rest male giving a male-female ration of 1:10.
DISCUSSION:
The syndromic approach is pragmatic in that it does not require laboratory facilities. However, in many countries, including Bangladesh, RTIs are managed using clinical~ or etiological diagnosis employing sub-optimal or incomplete diagnostics (30). In the case of qualified medical practitioners. they are not used To the syndromic approach because they arc trained on etiological diagnosis. Hence, competency-based training for healthcare providers is usually required when providing RTI clinical care through first-level healthcare facilities adopting a syndromic-based approach. Such training should be targeted to medical officers, nurses (paramedics). medical assistants, etc (3 1).
The study-findings showed that the existing facilities of the centers required more motivation for the male patient to come for the management for :STIS/RTIS card should be separated for each patients and should be maintained adolescents condition should be assessed by their patents and street based heath education for the daily laborers should be needed because their frequency of service seeking behavior came poor.
RTI is prevalent in Bangladesh. Some JTIs are also STDs. which are transmitted from and to husbands (male partners). HIV is now an emerging problem in our country and the presence of STDs will. include, facilitate HIV transmission.
A questionnaire having structured questions and semi structured questions.
Steps of RTI/STI patient diagnosis:
In this study treatment was given according to the technical standard and the patient were informed about the use of medicine and all the centers have the drug package for the clients of RTIs/STIs patient (100%). Counseling of the clients with RTIs/STIs patient here follows four issues and in (table-i) 76 (9 1.6%) of the clients were counseled. Here the counseling includes the 4Cs which was discussed in earlier chapter counseling, satisfied about 80 (94.0%) among 85 clients in a study done by (Chowdhury et.al)~3~. In this study air no~:
all the clients that is 78’ (94.0%) of the respondents were informed by the providers for the. farther clinical follow-up. In (R. Saiful et.al 2001)(6) in this study shown that each and every patients were informed about follow-up but clients hardly come for follow-up 7% of 341 of cleats come for follow-up.
(Table -1): This table shows that history of presents and past illness was taken is (95.2%) and (98%) cases respectively and, counseling and clinical follow-up was done is (91.6%) and (94%) case respectively. So the steps of diagnosis in these centers were excellent as they were following the steps very cautiously. (R. Saifur et.al 2001)(6) in their findings showed that the providcrswere aware of the steps of history taking, but in case of physical examination they could mention the examination steps as a part of routine examination but not aware of importance of following the certain steps.
So we can see that the steps of diagnosis of RTIs/STIs patient following strictly in these centers.
Assessment of the state of practices of syndromic management’s:
For diagnosis and treatment the study referred to the management by flowcharts of seven syndromes according to the technical standard (10). Each of these flowcharts started with a RTI/STI symptoms. The management of RTIs/STIs had to be according to clients complaints that matched with the symptoms of those flowcharts. For the symptoms of vaginal discharge. lower abdominal pain the study considered flowchart with speculum examination for the diagnosis and treatment as the centers had facilities for speculum examination.
In this study among the 83 respondents (Table-Il) show 69 (84.1%) come with vaginal discharge, 3(3.6%) were with urethral discharge. genital ulecr 13 (15 .7%).Inguinal bubo was 1(1 .2).complaints with lower abdominal pain were 16(19.3) and scrotal s~velling were 3(3.6). In ( R. Saifur et.al 201)(6) study in s primary Health care level clinic providing syndromic management of the RTIs/. STIs cases showed that clients were diagnosed and managed as having vaginitis . cervicitis ,PID.urethral discharge and genital ulcer. Among the 343 clients (36%) were diagnosed as vaginitis. (33%) were cervicities. (20%) PID, 7% were ‘with cervicities and vaginitis . .(3&%) of them were urethral discharge and (1%) was genital, ulcer and RTIs diagnosed by syndromic approach( Chowdury H.A.2002) ~ showed in his study that 42 (49.4%) were with whitish discharge ( vaginal discharge) , 20 (23.5%) were lower abdominal pain, 15(17.6%) were genital ulcer,5(5.9%) were urethral discharge . 3(3.5%) were ~scrotal swelling. (Table – III) Shows that majority (92.3) of the service ~providers were female and only 2(7.7%) were males along 26 service providers. In (chowdhury H.A .2002)~ amongst 58 service providers 5(8.6%) were male and 53 (9 1.4%) were female.
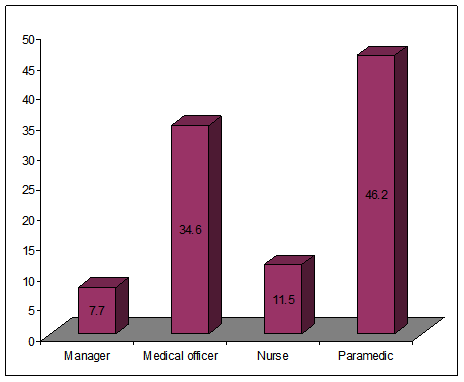
(Fig:4) Distribution of service providers b’ official status shows that nearly half (46.2%) of the service providers wereparamedics and (34.6%) were medical officers, (11.5%) were nurses and, (7.7%) managers , where In ( Chowdhury H.A 2002)~~~ 10 (17.2%) specialist 10(17.2%) medical officers, 29(50%) nurses,5(8.6%) health assistant, 2((3.5%) medical assistant. (Table V) Demonstrated the management efficiency of the service providers based on combined score of 60 for 12 discrete activities shown in (table IV), the total scores attained byihe respondents were categorized in to live categories within (60 — 49) being the excellent and 12 being the poor with good, Average and fair in between them; Based on the score attained by 4he respondents 10(38.5%) were categorized into excellent. 8 (30.8%) good and rest (30.8%) were average. This scoring done by making self scoring semi-structured questionnaire for the service providers to asses the syndromic management practices in those centers.
(Table- VI) showed association between age and management efficiency. Half of the excellent efficiency was found among age groups (30-40 years). (62.5%) of the ~‘good” efficiency was also found in the same age group. However no age group was found to be significantly associated with management efficiency. In (Chowdhury H.A. 2002)~~~ 18-30 years were perceived 100% and 3 1-60 years were perceived 87%. Though the efficiency and perception ward is ~not the same but there is minor relationship in between them.
In (Table —VII) association between sex and management efficiency. neither male nor female sex was found assOciated with management cfficiency. as only. 2 service provider were male.
(Table- VIII) presents the association between length of job and management efficiency, (60%) of the excellent efficiency was found among the service providers with length below 5 years. The length of service was not revealed to be associated with management efficiency of the service providers. In (Table —IX) association between official status of the service providers and management efficiency 60% of the excellent service provided by the medical officers where 40% by nurses and paramedics. So the official status of the service providers tends to be significantly associated with management efficiency.
Protective measures taken by the service provider:
It is very important to follow the infection prevention steps in case of management of RTI/STI case. The infection prevention steps include high level disinfection practice, dec~ntamination, cleaning and autoclaving. If is found in the study that all the centers follows the steps fully that was in (table —X), 26
• (100%) of all the providers can answer it, which is a great achievement. About the waste disposal system in (table — X) also showe4 the same result.
Record Keeping System:
Distribution of service providers by others service provided related with RTI/STI management were partner management, which shown in (table-XII),
only in 37(44.6%) cases partner management given and almost all the clients were informed about the medicinci9(95.2%). Only 5(6%) clients were referred to higher centers for better treatment. 78(94%) of the clients that the need of follow-up visit were consulted as well.
Record Keeping System was seen’ by record review with the help of an observation check list and an semi-structured questionnaire. in the check list it includes ESP Card, Registered khata, Partner Management Card and Computer. In the (table -XI) only 1(3.8%) record keeping system was excellent, 10(38.5) good. 2(7.7) average, 6(23.1) fair and 7(26.9) was poor. In (R.Saifur et.al 2001)(6) was also shown that diagnosis was not always recorded in the clinic registration khata/ book according to the recommendation of the technical standard.
Table XIII shown the distribution of the clients by occupation. 36(43.4%) were house wife, 25(30.1%) were service holder and rest of them were negligible. it indicates the lack of health education at the grass root level.
One important public-health intervention to interrupt the chain of STI transmission is partner notilication which also shadowed by the frequency of RTI /STI male patient in those centres. Among the 83 clients 9(10%) were only male and 75(90%) were female shown in (figure 1). A study done by (R. Saifur et.al 2001)(6) client flow with RTIs/STIs in a Primary Health Care Clinic among 341 clients only (4%) ~vere male. The service of the centres shown that the partner notification was very poor although the health care providers of the clinic counsel the STIs clients to bring their partner.
Few studies were found regarding this study so there is less opportunity to compare.
RECOMMENDATIONS:
Based on the study finding of the study following recommendation are made:
1. Male clients should be motivated in syndromic approach for RTIs.
2. RTIs card should be separated for each patients and should be maintained.
3. Effective partners’ management strategies must be developed.
4. Safety measures should be strictly followed in disposing of the used equipment and materials.
5. Neonate and adolescent’s condition should be assessed by their parent’s satisfaction regarding syndromic approach.
6. Overall, information education and communication (IEC) must be integrated at grass root level.
CONCLUSION:
Euring this research. I could realize that the syndromic management can be the greatest economic and effective management for the intervention of the deadly disease HIV which is encoring our developing and under developed world which may thrown us to the black well. If we practice this and realize the people of it’s wide good/excellent effect on health of the society and country for a healthful leaving, then I think it will be ridiculous economic treatment for the prevention of STIs/RTIs.
The Findings of study suggest that management practice of RTIS/STIS patient at the primary heath care centers of the urban-primary health care projects are possible. However for an effective management practice an effective management approach like syndromic approach needed for the RTIs/STIs patient in all respect.
However this study assessed syndromic management of RTIS/STIS using the standard guidelines including the~steps of diagnosis of those patients. the protective measures taken by the service providers and record keeping system.
The research is essential to assess, improve and implement available technologies in addressing these issues
The NIPHP, in collaboration with the ministry of health and family welfare. GOB. developed a technical standard and service delivery protocol for management of RTIs~’STIs. This protocol is used by the providers at the primary health care facilities and in study there efficiency was found to be wonderful and they achieved this acceptability regarding sysdromic approach, of RTIs/ST1s case management.
The study finding also showed that the clients did not express any negative concern regarding the management practice except bringing partners for treatment. However they mentioned that they could communicate their problems without hesitation and received spot treatment without any added expense and hassle of laboratory examination.
The study also reveals that they followed the infection prevention steps strictly which prevents the cross-infection. Their record keeping system should be improved, So the study explored and identified some important operational aspects of syndrornic management that could be taken care of and have given special consideration to ensure RTIs/STIs management practice with quality at the lowest static primary health care centers in Urban area of Bangladesh.
Some are parts:
Management Practice of Rti Sti Patients in Urban Primary Health Care Centers (Part 1)
Management Practice of Rti Sti Patients in Urban Primary Health Care Centers (Part 2)