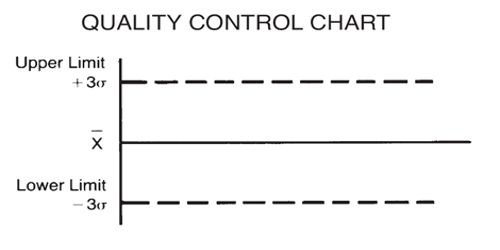
The quality control charts:
In general, the purpose of quality control charts is to monitor the quality of an ongoing process. For example, in the manufacture of piston rings, one could take samples of piston rings and measure their diameters. One can continuously plot the means for successive samples that are taken. With the aid of statistical techniques (proper control limits), this will allow the quality control engineer to detect if and when the process mean (piston ring diameter) shifts outside acceptable limits. Analyzing the pattern of variance depicted by a quality control chart can help determine if defects are occurring randomly or systematically. For controlling quality characteristics that represent attributes the product, the following charts are commonly constructed:
C chart
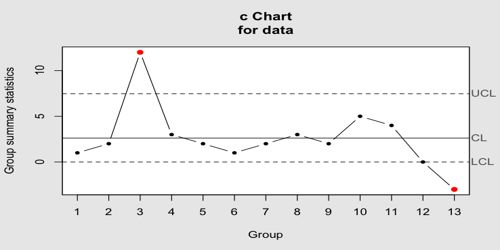
In this chart we plot the number of defects (per batch, per day, per machine, per 100 feet of pipe, etc.). This chart assumes that defects of the quality attribute are rare and the control limits in this chart are computed based on the Poisson distribution (distribution of rare events).
U chart
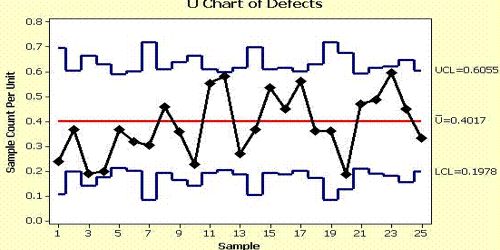
In this chart we plot the rate of defects that is, the number of defectives divided by the number of units inspected (the n; e.g., feet of pipe, number of batches). U-charts show how the process, measured by the number of non conformities per item or group of items, changes over time. Unlike the C chart, this chart does not require a constant number of units, and it can be used, for example, when the batches (samples) are of different sizes. It is also occasionally used to monitor the total number of events occurring in a given unit of time.
Np chart
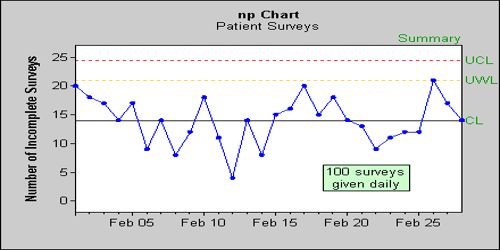
In this chart, we plot the number of defectives (per batch, per day, per machine) as in the C chart. However, the control limits in this chart are not based on the distribution of rare events, but rather on the binomial distribution. It is sensitive to changes in the number of defective items in the measurement process. The “NP” in NP charts stands for the np (the mean number of successes) of a binomial distribution. Therefore, this chart should be used if the occurrence of defectives is not rare (e.g., they occur in more than 5% of the units inspected). For example, we may use this chart to control the number of units produced with minor flaws.
P chart
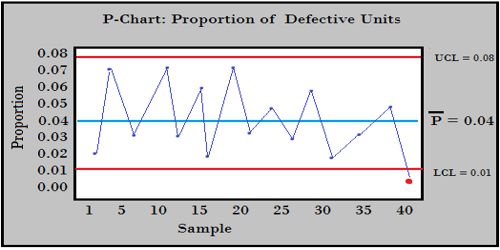
In this chart, we plot the percent of defectives (per batch, per day, per machine, etc.) as in the U chart. However, the control limits in this chart are not based on the distribution of rare events but rather on the binomial distribution (of proportions). In statistical quality control, the p-chart is a type of control chart used to monitor the proportion of nonconforming units in a sample, where the sample proportion nonconforming is defined as the ratio of the number of nonconforming units to the sample size, n. Therefore, this chart is most applicable to situations where the occurrence of defectives is not rare (e.g., we expect the percent of defectives to be more than 5% of the total number of units produced).
Information Source: