Introduction:
Origin:
Ability to align the theoretical knowledge with the practical working area is the most important and imperative task for a person to be attained. The report was assigned to develop the insight to be able to translate the theoretical knowledge and understanding which was gained from the course “Financial Theory and Practices” with the experience of real life situation. This report is actually a practical demonstration of the Financial Theory and Practices.
Background:
In Bangladesh right now two stock exchanges are in operation.
1) Dhaka Stock Exchange (DSE)
2) Chittagong Stock Exchange (CSE)
Dhaka Stock Exchange Limited (DSE) is larger than Chittagong Stock Exchange in the country. DSE was originally incorporated on April 28, 1954. It was started under the name of “East Pakistan Stock Association Limited”. Thereafter it had faced various changes over the years and resumed its trading activities in 1976 initially with 9 listed companies. Then the total paid up capital of the market was Tk. 137.52 million. In the last few years, it has attracted a lot of interest from local and international investors. At October 31, 2008 the number of listed securities was 401 and the total issued capital and debentures of all listed securities were Tk. 350,621 million. Most of the investors are retail and local with little knowledge about the market as a whole, and sound finance knowledge. This is one of the reasons why a lot of investors are losing a lot of money. Using the beta to get a better understanding of risk and return is one way to better understand the stocks one is investing.
Objectives:
The objectives of this report are:
- To calculate the monthly average return and beta of five selected companies in the Food and Allied Industry category listed in the Dhaka Stock Exchange Limited (DSE).
- To work out and present the Security Market Line with the 70 companies serving as the market proxy
- Plot these five companies in the SML graph.
- To identify whether the stocks of these 5 specific companies are undervalued and overvalued.
Scope:
While conducting this report and analysis companies from Dhaka Stock Exchange were selected only. However many listed companies in this category is also listed in Chittagong Stock Exchange. The performance of common stocks of selected foods and allied category companies in Chittagong Stock Exchange has not been considered in this report.
Methodology:
Here as per the allocation the assigned industry to conduct the study is Food and Distribution category of the Dhaka Stock Exchange Limited.
Sample size:
Right now in Bangladesh Food and Distribution companies are doing really well and they are enjoying a huge growth and lots of companies has become enlisted to the Dhaka Stock Exchange Limited. Thus this category of industry has become is quite varied with the products of the companies varying from different other companies. However, to make a more realistic comparison, we chose five companies with relatively similar activities.
Sampling unit:
The chosen five companies are:
1. Apex Foods
2. Bangas
3.Chittagong Vegetable
4. Fine Foods
5. Fu Wang Food
Sampling method: Convenience or judgmental sampling
Data source:
Secondary data from Dhaka Stock Exchange. To find the beta of these companies, the returns of the market was required. The ideal situation would be to use the DSI Index, which is the all-share index of the Dhaka Stock Exchange. However, DGEN index is considered as the close substitute of DSI Index for the market. Nevertheless, the shortcomings of the DGEN have to be taken into consideration
Here the closing price stated by DSE has been considered instead of the last traded price. As the closing price is the average price of the last fifty trades of any given day for any given stock so by considering the closing price a better representation of price performance of a stock has been obtained.
Again there was an instruction to use the data on the last date. However due to the weekly or some national holidays the immediate previous working day closing price has been considered as the month end price.
Time Frame:
As per instruction the end price of these companies stocks from the month of November 2005 to November 2010 has been taken under judgment.
While finding the beta of these five companies, the market return was determined by using the DGEN index. In the process excess return on market and stock was calculated and the characteristics line was drawn.
These five companies were found regular in declaring dividends. As per the instruction of course instructor the closing prices for dividends were adjusted where it was needed to be adjusted.
While adjusting for dividends or others e.g. bonus, right share we considered three very sensitive dates. The first was the declaration date, the second was the record date and the third was the annual general meeting (AGM) date. Although these three dates are very sensitive, the entitlement of the dividend is only for investors holding the shares on the record date. The AGM date also plays a vital role in the sense that, the approval of the dividends is given on that date. But, only the shareholders on the record date are invited to the AGM, and there is not precedence that, once a dividend declare has been changed by the shareholders.
To construct the security market line, we have taken 2.05% annual rate as the risk free rate. This is the t-bill rate that the banks can borrow from the Government of Bangladesh.
Here we have used MS Excel 2007 as Spreadsheet program.
Limitation:
The limitations of this report are:
- The DGEN doesn’t represent the total market rather it reflects only a portion of the market.
- Again in case of calculating the returns of the stocks the closing price of the stocks was considered, which may not be a representative price to calculate gains.
- From this study it is really tough to conclude on the sector or the total market.
Brief Review of Selected Companies
As already mentioned, for our report we have chosen the following companies from the Food industry:
- Apex Foods
- Bangas
- Chittagong vegetable
- Fine Foods Limited
- Fu Wang Food
Apex Foods
Apex Foods is one of the pioneers in processing and exporting frozen shrimp. The company was listed in DSE in 1981. Its Market Category of the company is A, with 50.48% of the shares being held by the Sponsors/ Directors and 36.88% by the public.
Bangas
Bangas Ltd was established in 1980 and is renowned as a manufacturer and exporter of a wide array of food items including Biscuits, Noodles, chips etc. It is a Category A share and is listed in DSE since 1984.
Chittagong Vegetable
| Basic information about the company | |
| Name of the Company | Chittagong Vegetable |
| Address: | 37, Katalgonj, Panchlaish, Chittagong. |
| Contact Phone: | 031-650526, 650533 (Ctg) |
| Fax: | 88 – 031- 650134 |
| E-mail: | cvsharna@spnetctg.com |
| Web Address: | N/A |
| Authorized Capital in BDT* (mn) | 100.0 |
| Paid-up Capital in BDT* (mn) | 100.0 |
| Face Value | 100.0 |
| Total no. of Securities | 1000000 |
| 52 Week’s Range | 106.5 – 3930 |
| Market Lot | 10 |
Fine Foods Ltd.
Fine Foods is an A category share, and has been listed in DSE since 2002
| Basic information about the company | |
| Name of the Company | FINE FOODS LIMITED |
| Address: | Nobodoy Housing Society, Mahammadpur, Dhaka |
| Contact Phone: | 01926-76 64 69 |
| Fax: | 880 – 02 – 9552164 |
| E-mail: | finefoodsltd@live.com |
| Web Address: | N/A |
| Authorized Capital in BDT* (mn) | 1000.0 |
| Paid-up Capital in BDT* (mn) | 106.0 |
| Face Value | 10.0 |
| Total no. of Securities | 10565625 |
| 52 Week’s Range | 44.3 – 142 |
| Market Lot | 500 |
Fu Wang Food
| Basic information about the company | |
| Name of the Company | FU WANG FOOD |
| Address: | House # 55, Road # 17, Banani C/A, Dhaka |
| Contact Phone: | 9889864, 9889958, 8815476 |
| Fax: | 880 – 02 – 8827451 |
| E-mail: | fuwang@citechco.net |
| Web Address: | http://www.fuwanggroup.com |
| Authorized Capital in BDT* (mn) | 1000.0 |
| Paid-up Capital in BDT* (mn) | 243.0 |
| Face Value | 10.0 |
| Total no. of Securities | 24288000 |
| 52 Week’s Range | 49 – 129.8 |
| Market Lot | 500 |
Theoretical Background on Financial Aspects
It has been found that most of the people who have investing in the stock markets are ignorant about the market and possess very minimal knowledge about the risks or the market. Thus it is better to have some knowledge about some common terms like risk and return while investing in this capital market. The terms could be defined as follows;
Return:
Income received on an investment plus any change in market price, usually expressed as a percentage if the beginning market price of the investment. If one investor buys the stock at a price of 100 Tk. Which will give the investor a payment of 7 Tk. Again at the end of the year let the price of the stock become 108 Tk. Thus the return would become as (108 + 7 – 100)/ 100 = 15%.
Here it can be said that return comes to an investor from two sources; income plus any price appreciation or depreciation of the stock.
Required Rate Of Return (RRR):
Theoretically RRR can be defined as the discount rate that equates the present value of the future net cash flows from an investment project with the project’s initial cash outflow. When an investor invests in stock or any project, the investor definitely expects return for the investment.
For example, while investing in a stock, investor’s required return might be above 12% per year. Reasoning is that if he/she doesn’t receive 12% return, then it would be better off depositing in bank, on which bank is paying 12% interest.
Expected Return:
It can be defined as the weighted average of possible returns with the weights being the probabilities of occurrence.
We can also describe the expected return as the multiplication of benefit and likelihood of success which is subject to division by the cost.
The average of a probability distribution of possible returns, calculated by using the following formula:
From the above formula it could be revealed that the expected return could be found by multiplying the probability of each possible return outcome with the return outcome.
Say, if a given investment had a 55% chance of earning a 15% return, a 15% chance of earning 20% and a 30% chance of earning -10%, the expected return would be equal to 7.5%:
= (0.55) (0.15) + (0.15) (0.2) + (0.30) (-0.1)
= 0.0825
= 8.25%
This is nothing but an expectation but there is no guarantee that the expected return will be the actual one.
Risk
Risk could be defined as the variability of returns from those that are expected. In Generally by risk we mean the probability of losing something. In the investing world, the dictionary definition of risk is the chance that an investment’s actual return will be different than expected. Technically, this is measured in statistics by standard deviation. Risk means the possibility of losing some, or even all, of original investment.
We can also define risk as the variability of returns from those that are expected. The greater the variability, the riskier the security is said to be. Low levels of uncertainty (low risk) are associated with low potential returns. High levels of uncertainty (high risk) are associated with high potential returns.
It is said that the risk/return tradeoff is the balance between the desire for the lowest possible risk and the highest possible return. The below chart will give us a better graphical representation. A higher standard deviation means a higher risk and higher possible return.
According to portfolio management theory the risk for individual stock returns has two components:
Systematic Risk
These are market risks that cannot be diversified away. Interest rates, recessions and wars are examples of systematic risks.
Unsystematic Risk
Also known as “specific risk”, this risk is specific to individual stocks and can be diversified away as you increase the number of stocks in your portfolio. It represents the component of a stock’s return that is not correlated with general market moves.
It is a gamble to invest money in the capital market. Especially right now the risk factor of the market is really high. Thus to minimizing the risk factor of the portfolio it is really important to diversify the stocks that means to purchase different sorts of stocks.
From the above discussion we could reveal that there are two types of risks. Problems are mostly correlated with the unsystematic risks which can’t be assumed. From different studies and mathematical models it has been revealed that maintaining a well-diversified portfolio of 25 to 30 stocks will yield the most cost-effective level of risk reduction.
Diversification strives to smooth out unsystematic risk events in a portfolio so that the positive performance of some investments will neutralize the negative performance of others. Therefore, the benefits of diversification will hold only if the securities in the portfolio are not perfectly correlated.
For a well-diversified portfolio, the risk – or average deviation from the mean – of each stock contributes little to portfolio risk. Instead, it is the difference – or covariance – between individual stocks’ levels of risk that determines overall portfolio risk. As a result, investors benefit from holding diversified portfolios instead of individual stocks.
For every level of return, there is one portfolio that offers the lowest possible risk, and for every level of risk, there is a portfolio that offers the highest return. These combinations can be plotted on a graph and following figure shows it for just two stocks – a high risk/high return technology stock (Google) and a low risk/low return consumer products stock (Coca Cola)
Below three main indicators of investment risk that apply to the analysis of stocks, bonds and mutual fund portfolios are discussed. They are standard deviation, alpha and beta. These statistical measures are historical predictors of investment risk/volatility and are all major components of portfolio management.
Standard Deviation
The standard deviation essentially reports a fund’s volatility, which indicates the tendency of the returns to rise or fall drastically in a short period of time. A security that is volatile is also considered higher risk because its performance may change quickly in either direction at any moment. The standard deviation of a fund measures this risk by measuring the degree to which the fund fluctuates in relation to its mean return, the average return of a fund over a period of time.
A fund that has a consistent four-year return of 3%, for example, would have a mean, or average, of 3%. The standard deviation for this fund would then be zero because the fund’s return in any given year does not differ from its four-year mean of 3%. On the other hand, a fund that in each of the last four years returned -5%, 17%, 2% and 30% will have a mean return of 11%. The fund will also exhibit a high standard deviation because each year the return of the fund differs from the mean return. This fund is therefore more risky because it fluctuates widely between negative and positive returns within a short period.
A note to remember is that, because volatility is only one indicator of the risk affecting a security, a stable past performance of a fund is not necessarily a guarantee of future stability. Since unforeseen market factors can influence volatility, a fund that this year has a standard deviation close or equal to zero may behave differently in the following year.
Beta
Here to understand markets we have considered the beta the most. Beta is statistical measure of the volatility of an investment in relation to the market as a whole; also known as “beta coefficient” or “systematic risk.” By definition, the market has a beta of 1.0, and individual stocks are ranked according to how much they deviate from the market. A stock that swings more than the market over time has a beta above 1.0. If a stock moves less than the market, the stock’s beta is less than 1.0. High-beta stocks are supposed to be riskier but provide a potential for higher returns; low-beta stocks pose less risk but also lower returns.
Beta is a key component for the capital asset pricing model (CAPM), which is used to calculate cost of equity. The cost of capital represents the discount rate used to arrive at the present value of a company’s future cash flows. All things being equal, the higher a company’s beta is, the higher its cost of capital discount rate. The higher the discount rate, the lower the present value placed on the company’s future cash flows. An asset with a beta of 0 means that its price is not at all correlated with the market; that asset is independent. A positive beta means that the asset generally follows the market. A negative beta shows that the asset inversely follows the market; the asset generally decreases in value if the market goes up and vice versa.
Capital Asset Pricing Model (CAPM)
CAPM is described as a model which defines all the relationship between the risk and expected return; in this model, a security’s expected return is the risk-free rate plus a premium based on the systematic risk of the security. It actually describes the relationship between risk and expected return, and it acts as a model for the pricing of risky securities.
As per the CAPM the expected return of a security or a portfolio equals the rate on a risk-free security plus a risk premium. If this expected return does not meet with the required return, the investment should not be undertaken.
The commonly used formula to describe the CAPM relationship is as follows:
For example, the current risk free-rate of the market is 3.5%, and the stock market is expected to return to 10% next year. Now consider that a particular investor is interested in determining the return that FuWang’s will have next year. Its beta value is 1.5. The overall stock market has a beta of 1.0, so FuWang’s beta of 1.5 tells us that it definitely carries more risk than the overall market; this extra risk means that the investor can expect a higher potential return than the 10% of the stock market.
Now,
Required (or expected) Return = 3.5% + (10% – 3.5%)*1.5
Required (or expected) Return = 13.25%
From this CAPM we can get that the required rate of return of FuWang is 13.25%. So, while investing in this stock the investor should be able to get at least 13.25% return on investment. If the investor is not sure that FuWang not produce this kind of returns then the investor should invest the capital in purchasing other stocks.
It is important to remember that high-beta shares usually give the highest returns. Over a long period of time, however, high beta shares are the worst performers during market declines. While an investor might receive high returns from high beta shares, there is no guarantee that the CAPM return is realized.
Beta Calculation of the Selected Companies
Calculation of beta
Beta is a statistical estimate of the expected average change in an investment’s rate of return that corresponds to a one percent change in the market over the time period selected.
Beta is calculated as follows:
| Where |
| β = Beta, ¯x = Benchmark return, ¯y = Portfolio return |
Beta of the stocks has been calculated as per following procedure:
i) To calculate β Sixty-months closing price and dividend earning from a stock are used to calculate monthly return of the respective stock as per following formula:
(Dividend paid+ Ending Price-Beginning Price)/Beginning Price
ii) Generally sixty-months closing index of General Index (DGEN) are used to calculate monthly return of the market. In this report, the monthly average return of the 70 selected companies is used to compile and calculate the monthly return of the market.
iii) Monthly risk free return has been deducted from the monthly returns to determine the excess returns from the stock and the market. Rate of interest of 91-days T-bill has been used as risk free rate.
iv) Covariance between excess return from market and stock (Covm,s), and variance of excess market return (Vars)have been calculated from the above data using MS-Excel.
v) Beta has been calculated as: Beta = (Covm,s/ Vars)
vi) Characteristic line has been drawn for every stock to make graphical presentation.
4.3 Detailed Data and Beta of the stocks has been presented under Appendix 1 : Beta Calculations
Analysis of Beta Calculation for the Selected Companies
Having done the Beta calculations for each company, here is an analysis of the companies Risk Vs Return interpretation in terms of individual Beta. The table with the Beta Result is presented below:
Sector | Sl | Company | Monthly Return | Beta |
Food | 1 | Apex Foods Ltd | 44.662% | 0.65 |
2 | Bangas | 79.103% | (0.07) | |
3 | Chittagong Vegetable | 157.658% | 0.65 | |
4 | Fine Foods | 111.533% | (0.23) | |
5 | Fu Wang Foods | 93.518% | 0.41 |
Beta value of a stock is the measurement of the volatility of a stock in comparison to the volatility of the market. It is a simple and very useful indicator that all traders and investors should be aware of. Calculation of beta value of stocks is essential with many trading/investing strategies especially with Capital Asset Pricing Model (CAPM), which describes how much risk that one can take to get a desirable return or vice versa.
Many financial sites, broker sites and trading platforms offer real-time and daily beta value of stocks. When calculating the beta value, the volatility of the market is taken as 1 and the beta of stock is calculated as how much the stock price moved in comparison to this market volatility. The value can take one of the following forms.
- Negative beta: A beta less than 0 – which would indicate an inverse relation to the market – is possible but highly unlikely. This is an interesting but rare condition where the price of the stock moves in reverse direction to the market movement. Usually no stock has prolonged negative beta value as most (all) them move with the market.
- Zero beta: Basically, cash has a beta of 0. In other words it can be said that regardless of which way the market moves, the value of cash remains unchanged (given no inflation). This is another rarity, where the price of stock stays same over time irrespective of market movement. This can sometimes happen in sideways moving markets, where no major economic/industry/company news is coming up.
- Beta less than one: Companies with volatilities lower than the market have a beta of less than 1. This happens when the stock price moves less in comparison of market. Many blue-chip and large-cap company stocks have beta value less than one, which make them qualify for low-risk investments. But these stocks tend to offer low-returns; and are not so suitable for short-term trading.
- Beta of one: This happens when the stock price movement is same as that of market. This is true for many index-linked stocks and funds.
- Beta greater than one: Beta exceeds one when the stock price movement surpass market movement. Many fast growing, mid and small-cap company stocks have beta higher than one. These stocks tend to offer better return for high-risk taken, but many of them are less suitable for long-term investing. Remember, very high beta levels may indicate low liquidity causing increase in volatility.
Knowledge of beta value is essential from a trader’s perspective as many experts believe that about 70% of stock price movements are with respect to market changes. In general it is believed that investing in instruments with high beta is good in rising markets and investing in low beta instruments is good in falling markets.
It has been found that Stocks of well-known companies rarely ever have a beta higher than 4.
Apex Foods Ltd: Beta=0.65
Apex Foods Ltd has a Beta greater than one which means the stock price movement surpasses market movement. Many fast growing, mid and small-cap company stocks have beta higher than one. These stocks tend to offer better return for high-risk taken, but many of them are less suitable for long-term investing. However, very high beta levels may indicate low liquidity causing increase in volatility.
Knowledge of beta value is essential from a trader’s perspective as many experts believe that about 70% of stock price movements are with respect to market changes. In general it is believed that investing in instruments with high beta is good in rising markets and investing in low beta instruments is good in falling markets. Hence depending on the Upside or Downside situation prevailing in the market, Apex Foods Ltd Stocks can be invested in to have a well-diversified portfolio.
Bangas: Beta= -0.07
Bangas has a Negative beta of -0.07 which indicates an inverse relation to the market .This is an interesting but rare condition where the price of the Bangas stock moves in reverse direction to the market movement. Usually no stock has prolonged negative beta value as most (all) them move with the market. In such case, the Risk of Bangas Stocks is high, but with calculated move, it may or may not yield a high return. This is an unstable condition and therefore hard to make a concrete decision.
Chittagong Vegetable: Beta=0.65
Chittagong Vegetable has a Beta greater than one, similar to Apex Foods Ltd, which means the stock price movement surpasses market movement. Many fast growing, mid and small-cap company stocks have beta higher than one. These stocks tend to offer better return for high-risk taken, but many of them are less suitable for long-term investing. However, very high beta levels may indicate low liquidity causing increase in volatility.
Knowledge of beta value is essential from a trader’s perspective as many experts believe that about 70% of stock price movements are with respect to market changes. In general it is believed that investing in instruments with high beta is good in rising markets and investing in low beta instruments is good in falling markets.Hence depending on the Upside or Downside situation prevailing in the market, Chittagong Vegetable Stocks can be invested in to have a well-diversified portfolio.
Fine Foods: Beta=-0.23
Fine Foods has a Negative beta of -0.23, following similar pattern to Bangas, which indicates an inverse relation to the market .This is an interesting but rare condition where the price of the Fine Foods stock moves in reverse direction to the market movement. For Fine Foods the negative Beta is less than Bangas of -0.07 and inverse relation is proportionally less with respect to Bangas. Usually no stock has prolonged negative beta value as most (all) them move with the market. In such case, the Risk of Fine Foods Stocks is high, but with calculated move, it may or may not yield a high return. Similar to Bangas, this is an unstable condition and therefore hard to make a concrete decision.
Fu Wang Foods: Beta=0.41
Fu Wang Foods has a Beta greater than one, similar to Apex Foods Ltd & Chittagong Vegetable, which means the stock price movement surpasses market movement. Many fast growing, mid and small-cap company stocks have beta higher than one. These stocks tend to offer better return for high-risk taken, but many of them are less suitable for long-term investing. However, very high beta levels may indicate low liquidity causing increase in volatility.
Knowledge of beta value is essential from a trader’s perspective as many experts believe that about 70% of stock price movements are with respect to market changes. In general it is believed that investing in instruments with high beta is good in rising markets and investing in low beta instruments is good in falling markets. Hence depending on the Upside or Downside situation prevailing in the market, Fu Wang Foods Stocks can be invested in to have a well-diversified portfolio. Fu Wang Foods has a beta of 0.41 which is less than 0.65 beta of Apex Foods Ltd and Chittagong Vegetables. This means its stock price movement varies proportionately less compared to the other to betas although movement is positive by relation.
Advantages & Disadvantages of the Beta for Selected Companies
Advantage of beta to evaluate the Selected Companies’ Systematic Risk & Return:
To followers of CAPM, beta is a useful measure. A stock’s price variability is important to consider when assessing risk.
If risk is thought as the possibility of a stock losing its value, beta has appeal as a proxy for risk.
It’s hard not to think that stock will be riskier than, say, a safe-haven utility industry stock with a low beta. Besides, beta offers a clear, quantifiable measure, which makes it easy to work with.
Sure, there are variations on beta depending on things such as the market index used and the time period measured, but broadly speaking, the notion of beta is fairly straightforward to understand.
It’s a convenient measure that can be used to calculate the costs of equity used in evaluation method that discounts cash flows.
Easy to apply and helpful in finding right trading instruments.
Disadvantages of beta to evaluate the Selected Companies’ Systematic Risk & Return:
Beta doesn’t incorporate new information.
Another troubling factor is that past price movements are very poor predictors of the future.
Betas are merely rear-view mirrors, reflecting very little of what lies ahead.
Furthermore, the beta measure on a single stock tends to flip around over time, which makes it unreliable.
Granted, for traders looking to buy and sell stocks within short time periods, beta is a fairly good risk metric. But for investors with long-term horizons, it’s less useful.
As it is based on historical data there is no guarantee of future returns, not applicable for newly issued stocks,
It does not distinguish bearish and bullish trends and it do not consider the value of the instrument.
Rather than these disadvantages there are some other problems associated with beta (β). The most important forewarning issue for using beta to make investment decisions is that it is totally depended on historical information of a stock’s volatility. Past beta figures or historical volatility does not necessarily predict the future beta or future volatility. In other words, if a stock’s beta is1 right now none can give guarantee that in the next year the beta will be the same.
The second caveat for using beta is that it is a measure of systematic risk, which is the risk that the market as a whole faces. The market index to which a stock is being compared is affected by market-wide risks. So, as beta is found by comparing the volatility of a stock to the index, beta only takes into account the effects of market-wide risks on the stock. The other risks the company faces are firm-specific risks, which are not grasped fully in the beta measure. So, while beta will give investors a good idea about how changes in the market affect the stock, it does not look at all the risks the company alone faces.
Deriving the Security Market Line (SML)
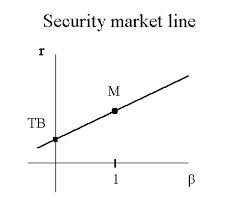
Security Market Line (SML):
Security Market Line (SML) is a line that graphs the systematic, or market, risk versus return of the whole market at a certain time and shows all risky marketable securities. It is also referred to as the “characteristic line”.
The security market line is an important tool to determine whether an asset being considered for a portfolio offers a reasonable expected return for risk. Individual securities are plotted on the SML graph. If the security’s risk versus expected return is plotted above the SML, it is undervalued because the investor can expect a greater return for the inherent risk. A security plotted below the SML is overvalued because the investor would be accepting less return for the amount of risk assumed.
Security Market Line essentially graphs the results from the capital asset pricing model (CAPM) formula. The x-axis represents the risk (beta), and the y-axis represents the expected return. The market risk premium is determined from the slope of the SML.
The relationship between β and required return is plotted on the securities market line (SML) which shows expected return as a function of β. The intercept is the nominal risk-free rate available for the market, while the slope is E(Rm − Rf). The securities market line can be regarded as representing a single-factor model of the asset price, where Beta is exposure to changes in value of the Market. The equation of the SML is thus:
SML: E(Ri) – Rf = βi {E (RM) – Rf)
It is a useful tool in determining if an asset being considered for a portfolio offers a reasonable expected return for risk. Individual securities are plotted on the SML graph. If the security’s risk versus expected return is plotted above the SML,it is undervalued since the investor can expect a greater return for the inherent risk. And a security plotted below the SML is overvalued since the investor would be accepting less return for the amount of risk assumed.
While investing, the general formula for an investor to search for the stocks with strong fundamentals – including earnings, dividends, book value, and cash flow – that are selling at a bargain price. Again another technique for the investor is to sort out the companies which are incorrectly valued (undervalued) by the market. These stocks have the potential to increase in share price when the market corrects its error in valuation. Thus for these stocks there is a possibility to gain more than the overvalued or actual valued stocks.
A risk management technique mixes a wide variety of investments within a portfolio. The rationale behind this technique contends that a portfolio of different kinds of investments will, on average, yield higher returns and pose a lower risk than any individual investment found within the portfolio.
Comparison of expected return and required return in SML:
- Ø Security market line has been drawn by using risk free return, market beta (e.g. 1) and expected market return. Expected market return has been calculated by averaging the sixty-month market return.
- Ø Expected return from the stocks has been depicted to compare with security market line. If expected return from a stock has been found higher than the required return as per security market line, the stock is underpriced and if expected return from a stock has been found lower than the required return as per security market line, the stock is overpriced. In determining the expected return from a stock, the expected price of a stock has been estimated by subjective judgment.
Chart 1: Security Market Line
Valuation of the Selected Companies: Under-priced or Overpriced?
Valuation
While considering investing in capital market then valuation is very important to lessen the risk of the portfolio. We can define valuation as evaluating a security. Valuation entails attempting to measure its intrinsic value by examining related economic, financial and other qualitative and quantitative factors. While calculating valuation it means we are studying everything which possess some effect on the security’s value, including macroeconomic factors. In macroeconomic factors we consider the overall economy and industry conditions. In calculating the value of the stock company-specific factors also play a major role. Company-specific factors include financial conditions of the organization. It also includes the management potential of the organization.
The end goal of performing valuation analysis is to produce a value that an investor can compare with the security’s current price, with the aim of figuring out what sort of position to take with that security.
Under-priced and Overpriced Stocks
Plotting Position Interpretation for Investors:
As the above chart shows, all of the five selected companies from the Food Sector have been plotted above the SML curve. This shows the stocks of these companies are Underpriced relative to the Security Market Line. As a result the stocks are expected to provide a Rate of Return greater than that required, based on its systematic risk. Therefore, investors should tap the opportunity for superior returns and go for investments in these companies. This eventually will drive the demand up increasing the price and thereby bringing down the return until it matches the Security Market Line. When the stocks of these return to the SML, the market equilibrium will again prevail. But the short duration of the instability, as foreseen from plotting the companies’ betas, could be better utilised to achieve a superior return before the market returns to equilibrium.
Chart 2: Security Market Line Graph and the Selected Companies’ positions
Findings on the Selected Companies
- Apex Foods Ltd (Beta=0.65), Chittagong Vegetable (Beta=0.65) & Fu Wang Foods (Beta=0.41) have a Beta greater than one which means the stock price movement surpasses market movement. On the other hand Bangas (Beta=-0.07) and Fine Foods (Beta=-0.23) have Beta Less than one indicating inverse relation to market market movement.
- However, very high beta levels may indicate low liquidity causing increase in volatility.
- Knowledge of beta value is essential from a trader’s perspective as many experts believe that about 70% of stock price movements are with respect to market changes.
- Usually no stock has prolonged negative beta value as most (all) them move with the market. In such case, the Risk of Bangas and Fine Foods Stocks are high, but with calculated move, it may or may not yield a high return. This is an unstable condition and therefore hard to make a concrete decision.
- If risk is thought as the possibility of a stock losing its value, beta has appeal as a proxy for risk.
- It’s a convenient measure that can be used to calculate the costs of equity used in evaluation method that discounts cash flows. It is also easy to apply and helpful in finding right trading instruments.
- The disadvantage of Beta is that it is merely rear-view mirrors, reflecting very little of what lies ahead.
- Another disadvantage is that for traders looking to buy and sell stocks within short time periods, beta is a fairly good risk metric. But for investors with long-term horizons, it’s less useful.
- The SML chart shows, all of the five selected companies from the Food Sector to have been plotted above the SML curve. This shows the stocks of these companies are Underpriced relative to the Security Market Line. As a result the stocks are expected to provide a Rate of Return greater than that required, based on its systematic risk.
- Investors should tap the opportunity for superior returns and go for investments in these companies.
- The investors rush eventually will drive the demand up increasing the price and thereby bringing down the return until it matches the Security Market Line.
- The short duration of the instability, as foreseen from plotting the companies’ betas, could be better utilised to achieve a superior return before the market returns to equilibrium.
Conclusion and Recommendation
As the financial market evolves, knowledge of beta value is essential from a trader’s perspective. This is because many experts believe that about 70% of stock price movements are with respect to market changes. Thereby following the beta with that of the market movement can bring in the relevant Return as appropriate with respect to the Risk Appetite. Apex Foods Ltd (Beta=0.65), Chittagong Vegetable (Beta=0.65) & Fu Wang Foods (Beta=0.41) have a Beta greater than one which means the stock price movement surpasses market movement. On the other hand Bangas (Beta=-0.07) and Fine Foods (Beta=-0.23) have Beta Less than one indicating inverse relation to market movement. Usually no stock has prolonged negative beta value as most (all) them move with the market. In such case, the Risk of Bangas and Fine Foods Stocks are high, but with calculated move, it may or may not yield a high return. This is an unstable condition and therefore hard to make a concrete decision.
Although Beta has its appeal as a proxy for risk assessment, Beta has a disadvantage in that it is merely rear-view mirrors, reflecting very little of what lies ahead. Therefore, investors should probe a little bit deeper in terms of all these five Companies’ financials to have a better risk vs return assessment looking on a longer term horizon for investment purposes. The SML chart shows that all of the five selected companies from the Food Sector to have been plotted above the SML curve. This shows the stocks of these companies are Underpriced relative to the Security Market Line. As a result the stocks are expected to provide a Rate of Return greater than that required, based on its systematic risk. Investors should tap the opportunity for superior returns and go for investments in these companies. All these equips us better to understand the Real Value of a stock which is otherwise deceptively unknown from its price. Therefore, the saying by the renowned Financial Analyst Oscar Wilde rightly goes as given below:
“What is a cynic? A man who knows the price of everything and the value of nothing.”