Introduction:
“Measurement and Evaluation” in education is very significant in the teaching learning process. Through evaluation one can verify that learning objectives of students have been achieved or not. But to have a sharp evaluation, good measurement techniques and knowledge of statistical analysis is very important.
As a part of the Honors degree every student of IER has to go to a school at 7th semester to complete his practicum course. As a student of 7th semester, I was sent to school section of Nilkhet High School, a well reputed school of Dhaka. There I had to teach Social-science in class eight. In the 6th semester we have to complete Microteaching and Simulation course that is in fact a mock up of a real classroom situation. So it was a great opportunity for me to apply my experience of micro-teaching in the practical field.
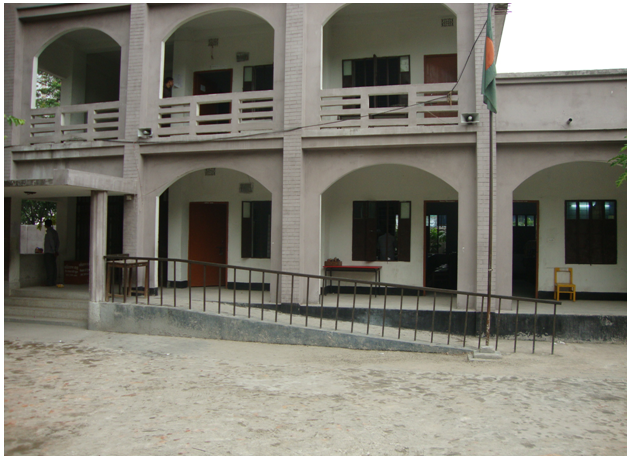
Working as a trainee teacher in NilkhetHigh School from 7/8/’04 to 29-06-2011, I had the opportunity to know about and look through the school’s environment closely. I shall try to picture those observations in this report. This report includes some description of physical and human components of the school, identifies its strengths and weaknesses and then draws some suggestions to overcome the existing problems and further improvement as well.
aim of the report
The primary objective of this report is to fulfill the partial requirement in the Bachelor of Education (B.Ed.) degree. Besides fulfilling the degree requirement, this report intends to cover a comprehensive analysis of school profile, administration and management.
Scope
This practicum report covers almost all aspects of a school in Bangladesh. I have had the opportunity to teach the students of different classes and different subjects. It was a practical exposure of what I learned in my university. I have also come close to school teachers, administration and managing committee and to observe there activities. At the same time I have observed school environment, education system etc. I tried to compile all these in my report.
Limitations
This report may have some incompleteness due to some of the limitations I encountered while completing it, that are mentioned below:
- One major limitation was the time constraint. This report could have been prepared in a much broader and extensive manner with more time and space availability.
- Some essential data could not be gathered because of confidentiality concerns such as budget, summary of different BOG and management committee meetings.
- Another limitation was that the data gathered could not be verified for accuracy.
Address of the School
Name :NilkhetHigh School
Year of establishment : 1975
Address:
Road: Shonargaon Road
Village: DhakaUniversity Area
Post office: G.P.O.
Thana: Ramna
Ward No: 57
District: Dhaka
Division: Dhaka
Phone No.: 8616187

Nilkhet High School,Dhaka.
Location:
Nilkhet High School is situated at the Shonargaon Road of DhakaUniversity area. Dhaka University Campus stands on the east of it, while Dhanmodi Thana, Nilkhet Telephone Exchange, Gausul Azam Market stands and Shonagaon Road lies on the west. Katabon Market and New Elephant Road is situated on the north and University Police Camp, Nilkhet Bazar is situated on the south of the school. Whole land area of the school is allocated by DhakaUniversity.

Brief History of Nilkhet High School
NilkhetHigh School reminds Mohammad Abdul Hakim Mollah, the then Head Teacher of Nilkhet Primary School, with honor as the first promoter of establishing the school. He was the first person to make his colleagues and some local guardians interested to establish a high school through discussing with them about it’s necessity. This body of interested teachers and guardians discussed with Mr. Mokbul Hossain, the then Thana Education Officer of Ramna, and decided to establish a high school mainly for the children of the staffs working at DhakaUniversity. According to the advice of the TEO, on 18.01.1975 Mohammad Abdul Hakim Mollah and the then Assistant Examination Controllers of Dhaka University Mr. Bozlur Rahman, Mr. Rahmatul Alam, Mr. Abul Hossain and Mr. Bodruddin Ahmed went to the then District Education Officer seeking permission for using the land and a room of NilkhetPrimary School for High School. The DEO, with the permission of the then DPI, granted their application and permitted them to use the land and room for one year. On 27.01.1975 the Eleven Member Governing Committee of Nilkhet High School was formed. Assistant Examination Controller Mr. Bozlur Rahman and Mr. Bodruddin Ahmed was respectively the first Chairman and the first Secretary of the school. That Committee appointed Mr. Abdul Hakim Mollah as the Honorary Head Teacher and Mr. Emdad Ahmed and Md. Hanif as the Honorary Assistant Teacher. At last with the assistance of some local philanthropic and the Governing Committee the school was formally established on 07.02.1975. The school started his activity with 13 students and 3 teachers. At first only class six was introduced as the school’s secondary education activity.
In 1976 a tin shade building was established on the eastern side of the primary school. Educational activities of class six and seven were then transferred to that tin shade building. Class eight and nine was introduced in 1977. Four more teachers were then appointed. By the mean time an application was submitted to Dhaka University Authority seeking land and financial assistance for the school. Dhaka University Authority then formed are 3 members sub-committee whose Chairman was Dr. Wadudur Rahman, the then Provost of Haji Mohammad Mohsin Hall. The sub-committee strongly recommended for the prayer. Then Dhaka University Authority allocated 16 Shotangsho land for school considering the convenience for the education of the children of the staffs working in the University.
The first Honorary Head Teacher and two Honorary Assistant Teachers served the school without any salary for two years. Now the school has 27 teachers, 1 accountant, 1 record- keeper and other 4 fourth class staffs.
In 1976-77 financial years Dhaka University Authority granted 10,000 Taka for the development of the school. This was the first grant for the school. Now this grant has increased to about 3,00,000 Taka. By the mean time DU Authority allocated 5 Shotangsho land for the second time and then more 29 shotangsho. As a result the total land area of the school became 50 shotangsho. Later on more 28 shotangsho lands was allocated in 2 installments (13 shotangsho in first installment and then 15 shotangsho more). Now the total land area of the school is 78 shotangsho. However in 1977 the school authority submitted an application at VDPI office shantinagar, to recognize it as junior school but it failed. Then the same application was submitted to Board of Intermediate & Secondary Education. This time their application was granted and from 01.01.78 the school introduced class nine. In 1979, for the first time, 12 students attended the S.S.C. exam from the school and among them 10 passed. In 1980, the school was fully permitted to take part on S.S.C. exam. From 1981 students of science and from 1982 students of science, arts and commerce are attending the S.S.C. exam from the school. DU authority and the government actively help the school as a result. Now the school has 1 three- storied building and 4 tin- shade building.
Classes and Sections
NilkhetHigh School runs its educational activity from class KG to class Ten (10). Class KG – Five and Nine-Ten has no sections. Class Six, Seven and Eight has two sections each (A & B). All students of “A” sections are boys and most students of “B” sections are girls.
Human Resources of Nilkhet High School
a) Profile of students
Table 1
| Class | Section | Boys | Girls | Total |
KG | 27 | 23 | 50 | |
One | 40 | 30 | 70 | |
Two | 24 | 23 | 47 | |
Three | 24 | 21 | 45 | |
Four | 32 | 19 | 51 | |
Five | 33 | 18 | 51 | |
Six | A | 71 | 00 | 138 |
B | 00 | 67 | ||
Seven | A | 75 | 00 | 126 |
B | 00 | 51 | ||
Eight | A | 63 | 00 | 103 |
B | 00 | 40 | ||
Nine | 63 | 46 | 109 | |
Ten | Science | 09 | 02 | 91 |
Arts | 02 | 14 | ||
Commerce | 48 | 16 | ||
Total |
| 511 | 370 | 881 |
From the table above, we get some information as:
a) Total number of students of Nilkhet High School 881.
b) Number of boys is 511.
c) Number of girls is 370.
d) Total number of primary level students is 314.
e) Total number of secondary level students is 567.
f) Class nine has no students of science and arts, all are of commerce.
g) In class ten, out of 91 students only 11 are studying science and 16 are studying arts; rest 64 are studying commerce.
h) Summating nine and ten, a total of 173 students are studying commerce, while 11 are studying science and 16 are studying arts.
i) Boys are studying science and commerce more than girls in number, while girls are studying arts more than boys in number.
These informations are shown below in graphs by proportion of percentage:
Graph – 1
Graph – 2
Graph – 3
Graph – 4
b) Profile of Teachers
The school has a total of 27 teachers among whom 08 are for primary level and 19 are for secondary level.
Head Teachers Table 2
No. | Name | Working Period |
01 | Md.Abdul Hakim Mollah | 7 February, 1975 – 21 September,1993 |
02 | Md.Abdur Rouf | 7 May,1994 – 10 June,1994 |
03 | Md.Mizanur Rahman | 22 september 1996 – Till present |
List of Teachers working at present Table 3
| Level | No. | Name | Subjects they teach |
P R I M
A
R
Y | 01 | Mahmuda Begum | All subjects according to necessity |
02 | Tanzina Islam | All subjects according to necessity | |
03 | Bodrunnahar Begum | All subjects according to necessity | |
04 | Hosne Ara Begum | All subjects according to necessity | |
05 | Hena Yasmin Bithi | All subjects according to necessity | |
06 | Hashima Ferdousi | All subjects according to necessity | |
07 | Fatema Begum | All subjects according to necessity | |
08 | Rokeya Sultana | All subjects according to necessity | |
S E C O N D A R Y | 09 | Md.Mizanur Rahman | English. |
10 | Md.Humayun Kabir | Science, Math | |
11 | Mrs.Nurun Nahar Begum | Beng,Eng,History,Civics,Home Economics | |
12 | Mrs.Ferdous Ara Begum | Eng,Soc,Civics,Beng,Agrculture | |
13 | Nonda Rani Shaha | Bengali | |
14 | Kha.Md.Jahangir | Beng,Eng,History,Soc.Science | |
15 | Afzal Hossain | Math,Beng,Accounting,Bus.Ent,Soc. | |
16 | Md.Badshah Mia | Beng,Science,Bus.Ent,Bus. Int. | |
17 | Md.Harunur Rashid | Math,Science,Geography | |
18 | Mrs.Morsheda Begum | Math,Science,Agriculture | |
19 | Md.Lihas Uddin Khan | Eng, Agriculture | |
20 | Md.Mofizul Islam | Math,Eng,Science | |
21 | Sri Ajoy Kumar Shaha | Beng,Hindu Religion | |
22 | Mrs.Ferdous Ara Luna | Beng,Soc, Hindu Religion | |
23 | Md.Shoriful Islam | English | |
24 | Md.Abu Taher | Islam Religion | |
25 | Mrs.Sultana Yasmin | Beng,Agriculture, Hindu Religion | |
26 | Mrs.Nasrin Ara Begum | Science | |
27 | Mrs.Mahmusa Begum | Math,Science |
Level of Teachers’ Academic & Professional Education
Table 4
AcademicEducation | Professional Education | Sex | |||||
Level | No. | Nil | P.T.I. | B.Ed. | B.Ed & M.Ed. | Male | Female |
Honors | 18 | 0 | 0 | 15 | 3 | 6 | 12 |
Masters | 09 | 0 | 0 | 2 | 7 | 6 | 3 |
Total | 27 | 0 | 0 | 17 | 10 | 12 | 15 |
The structure of the managing committee of Nilkhet High School is given below:
Table 8
No. | Post | Number | Way of availing post |
01 | Chairman | 01 | Nominated by V.C. of DU. |
02 | Secretary | 01 | Head Teacher by virtue of position |
03 | Member | 03 | Nominated by V.C. of DU. |
04 | Guardian Representative | 02 | Elected by direct vote of guardians |
05 | Teacher Representative | 02 | Elected by direct vote of teachers |
06 | Member | 01 | Nominated by Director General of Board of Intermediate & Secondary education |
07 | Member | 01 | Nominated by Chairman of Board of Education, Dhaka |
Total | 11 |
নীলক্ষেত উচ্চ বিদ্যালয়, ঢাকা
1g K¬vk †U÷
৮ম †kªYx
mvgvwRK weÁvb
mgq-30 wgwbU c~Y©gvb-15
m„Rbkxj cÖkœt
ক খ ও গ তিন বন্ধু তারা প্রতি মাসে সাত(৭০০০)হাজার টাকা বেতন পায়। ক খরচ বাবদ প্রতি মাসে এক(১০০০)হাজার টাকা ব্যাংকে জমা রাখে। কিন্তূ খ তার সকল টাকাই বর্তমান ভোগের জন্য ব্যায় করে। আবার গ পাঁচ(৫০০০) হাজার টাকা বর্তমান ভোগের জন্য ব্যায় করলেও দুই(২০০০)হাজার টাকা বাবার কাছে জমা রাখে ।ক এর ১ হাজার টাকা মাসিক সঞ্চয় হলেও গ এর ২ হাজার টাকা মাসিক সঞ্চয় নয়।
- ভোগ বলতে কি বোঝায় ? ১
- ভোগের নির্ধারক গুলো কি কি ? 2
- কেবল আয় ও ব্যায়ের ব্যবধানকে সঞ্চয় বলা হয় না কেন ? 3
- সঞ্চয় কিভাবে অথনৈতিক সচ্ছলতা ফিরিয়ে আনে ব্যাখ্যা কর । ৪
L) UxKv wjLt 2.5 x 2 = 5
- ভোগ ব্যায়
- সঞ্চয় ।
Item Specification
The item specification according to the domains of objectives of the essay type test is shown below:
Lower Learning Skills | Higher Learning Skills | Total mark | |||||||||||
| Objective | Knowledge | Comprehension | Application | Analysis | Synthesis | Evaluation | |||||||
| Percentage | 10% | 20% | 30% | 20% | 00% | 20% | 100% | ||||||
Mark | No. of item | Mark | No. of item | Mark | No. of item | Mark | No. of item | Mark | No. of item | Mark | No. of item |
| |
| Sociology | 1 | 1 | 2 | 1 | 3 | 1 | 4 | 1 | 0 | 0 | 0 | 0 | 10 |
| Geography | 0 | 0 | 2.5 | 1 | 0 | 0 | 2.5 | 1 | 0 | 0 | 0 | 0 | 05 |
| Total | 1/1 | 4.5/2 | 3/1 | 6.5/2 | 0/0 | 0/0 | 15 | ||||||
| |||||||||||||
Item Specification
The item specification according to the domains of objectives of the MCQ type test is shown below:
Lower Learning Skills | Higher Learning Skills | Total mark | |||||||||||
Objective | Knowledge | Comprehension | Application | Analysis | Synthesis | Evaluation | |||||||
Percentage | 10% | 20% | 30% | 20% | 00% | 20% | 100% | ||||||
Mark | No. of item | Mark | No. of item | Mark | No. of item | Mark | No. of item | Mark | No. of item | Mark | No. of item | ||
History | 1 | 1 | 1 | 1 | 1 | 1 | 0 | 0 | 0 | 0 | 0 | 0 | 3 |
Political Science | 2 | 2 | 1 | 1 | 0 | 0 | 2 | 2 | 0 | 0 | 1 | 1 | 6 |
Economics | 1 | 1 | 1 | 1 | 1 | 1 | 0 | 0 | 0 | 0 | 1 | 1 | 4 |
Population Education | 0 | 0 | 1 | 1 | 0 | 0 | 0 | 0 | 0 | 0 | 1 | 1 | 2 |
Total | 4/4 | 4/4 | 2/2 | 2/2 | 0/0 | 3/3 | 15 | ||||||
Test Result Analysis
Analysis of Test-1 results (Essay type test)
Student’s score in Test-1
Total student number of the class is 62 but 56 students appeared at the exam. Here, to make a decent analysis and comparison, only the scores of the students were given who attended.
Roll No. | Name | Obtained Mark (out of 15) |
1 | Tipu Sultan | 14.5 |
2 | Md. Abdur Rahman Shohan | 15 |
4 | Md. Ismail Hossion | 12 |
5 | Remal Mouzumdar | 14.5 |
6 | Md. Shehedull Islam | 12 |
7 | Tanvir Hossion | 12.5 |
8 | Md. Suzan Mahamud | 13 |
9 | Tasmir Ahmad | 13 |
10 | Sazzad Hossion | 15 |
11 | Sourouv Chondro | 15 |
12 | Sahazada | 11 |
13 | Shuvodip Borua | 14 |
14 | Nobina Islam Urmi | 9.5 |
15 | Niloy Sarkar Joy | 12 |
16 | Abir Hossain Zian | 10.5 |
17 | Tahsan Amin Turja | 13 |
18 | Harun-ur-Rashid | 10 |
19 | Tanzil Hossain Tuku | 13 |
20 | Sujit Kumar BIswas | 14 |
21 | Rezuanul Haque | 7 |
22 | Mehedi Hasan Asif | 11 |
23 | Sirajul Islam | 11 |
24 | Zubauer Ahammed | 12 |
25 | Naimul Hasan Sayem | 10.5 |
26 | Hasibul Hasan Siyam | 8.5 |
27 | Nazmul Haque | 9 |
28 | Tariquel Islam | 8.5 |
29 | Eftekher Alam Akash | 5.5 |
30 | Mazarul Islam | 7.5 |
31 | Salman S. Islam | 5.5 |
33 | Tahmidul Alam | 05 |
35 | Nazrul Islam | 12 |
37 | Sayed Md. Ashfaq Hossain | 6 |
38 | Emran Asif | 6.5 |
39 | Laxman Kumar | 6.5 |
40 | Shoaib Ahmed | 1 |
41 | Tanmoy | 8.5 |
42 | Sabrin Rashid | 6.5 |
43 | Md. Naimul Haque | 4 |
45 | KhanMd. Sakib | 5 |
46 | Tariful Islam | 9 |
47 | Ekramul Islam | 6 |
48 | Mahmudul Hasan | 10.5 |
49 | Mamun Hasan | 7 |
50 | Partho Protib Pal | 3 |
51 | Sabrin Rahman | 8 |
52 | Faisal Chowdhury | 7 |
53 | Ayon | 5 |
54 | Md.Habibur Rahman | 8 |
55 | Md. Ahaduzzaman | 3 |
56 | Md. Mehedul Islam | 7.5 |
58 | Md. Tipu Sultan | 7.5 |
59 | Md. Roman Ahmad | 6 |
60 | Md. Billal Hossion | 8 |
61 | Md. Jual hasan Babu | 12.5 |
62 | Humayun Kobir Shuvo | 8 |
Tabulation of scores
* Number of the class = (Range/class Interval) +1
= {(Highest score-Lowest score)/Class Interval}+1
= {(15 – 1)/3} +1
= (14/3) +1
= 4.6+ 1
= 5.6
= 6 (in full number)
Frequency Distribution Table
Class Interval (C.I.) | Tallies | Frequency |
1 – 3 | ||| | 3 |
4 – 6 | |||| |||| || | 12 |
7 – 9 | |||| |||| |||| | | 16 |
10 – 12 | |||| |||| |||| | 14 |
13 – 15 | |||| |||| | | 11 |
N = 56
Measures of Central Tendency
* The Mean
* True Mean = A.M.+(Σfd/N)i
C.I. | Mid point | Frequency (f) | Deviation (d) | Product (fd) |
1 – 3 | 2 | 3 | – 2 | – 6 |
4 – 6 | 5 | 12 | – 1 | – 12 |
7 – 9 | 8 | 16 | 0 | 0 |
10 – 12 | 11 | 14 | + 1 | + 14 |
13 – 15 | 14 | 11 | + 2 | + 22 |
N = 56 Σfd = 18
| Here – |
A.M. = 8
Σfd = 18
N = 56
i= 3
True Mean = A.M. + (Σfd/N)i
= 8 + (18/56)3
= 8 + (0.32)3
= 8 + 0.96
= 8.96
| Mean = 8.96 |
The Median
# Median = L+{(N/2-cfu)/fm}i
C.I. | Lower and upper limit of C.I. | Frequency (f) | Cumulative Frequency (cfu) |
1 – 3 | 0.5 – 3.5 | 3 | 3 |
4 – 6 | 3.5 – 6.5 | 12 | 15 |
7 – 9 | 6.5 – 9.5 | 16 | 31 |
10 – 12 | 9.5 – 12.5 | 14 | 45 |
13 – 15 | 12.5 – 15.5 | 11 | 56 |
| Here- |
L = 6.5
Cfu = 15
fm = 16
i = 3
N = 56
Median = L+ {(N/2-cfu)/fm}i
= 6.5 + {(28 – 15)/16} 3
= 6.5 + (13/16) 3
= 6.5 + (0.8125) 3
= 6.5 +2.4375
=8.9375
= 8.94 (Approx.)
| Median = 8.94 |
4(x).2.c The Mode
Mode = 3 median – 2 mean
= 3 x 8.94 – 2 x 8.96
= 26.82 – 17.92
= 8.90
| Mode = 8.90 |
Comment
The value of mean, median and mode is respectively 8.96, 8.94 and 8.90. The value of mean, median and mode is nearer to each other.. Here 7 – 9 class intervals contain maximum number of frequency and mean, median and mode belong to that class interval.
Measures of Variability
a) The Range
Range = Highest score – Lowest score
= 15 – 1
= 14
| Range = 14 |
b) The Quartile Deviation
# Q1 = L1 + {(N/4-F1)/fq1}I
| Here- |
L1 = 3.5
F1 = 3
fq1 = 12
i = 3
N = 56
Q1 = L1 + {(N/4-F1)/fq1} i
= 3.5 +{(14 – 3)/12} 3
= 3.5 + {11/12} 3
= 3.5 + 2.75
= 6.25
Q1= 13.9 (Approx.)
* Q3 = L3 + {(3N/4 – F3)/fq3} i
| Here- |
L3 = 9.5
F3 = 31
fq3 = 14
i = 3
N = 56
Q3 = L3 + {(3N/4 – F3)/fq3} I
= 9.5 + {(42 – 31)/14} 3
= 9.5 + {11/14} 3
= 9.5 + 2.35
= 11.85
Q3 = 11.85 (Approx.)
Quartile Deviation, Q = ( Q3 – Q1 )/2
= (11.85 – 6.25)/2
= 5.6/2
= 2.8
| Quartile Deviation = 2.8 (Approx.) |
c) Mean Deviation
# Mean Deviation = S|fd| /N
C.I. | Mid point (X) | Mean | f | d = x – M | fd |
1 – 3 | 2 | 8.96 | 3 | – 6.96 | – 20.88 |
4 – 6 | 5 | 8.96 | 12 | – 3.96 | – 47.52 |
7 – 9 | 8 | 8.96 | 16 | – 0.96 | – 15.36 |
10 – 12 | 11 | 8.96 | 14 | + 2.04 | + 28.56 |
13 – 15 | 14 | 8.96 | 11 | + 5.04 | + 55.44 |
S|fd| = 0.24
| Here- |
S|fd| = 0.24
N = 56
Mean Deviation = S|fd| /N
= 0.24/56
= .004
Mean Deviation =.004 (Approx.) |
d) Standard Deviation
# S.D. or s = Ö{Sfd2/N – (Sfd/N)2}I
C.I. | f | Deviation (d) | fd | fd2 |
1 – 3 | 3 | – 2 | – 6 | 12 |
4 – 6 | 12 | – 1 | – 12 | 12 |
7 – 9 | 16 | 0 | 0 | 0 |
10 – 12 | 14 | + 1 | + 14 | 14 |
13 – 15 | 11 | + 2 | + 22 | 44 |
∑fd = 18 ∑fd2 =82
| ∑fd = 18 |
∑fd2 = 82
i =3
N = 56
S.D. or s = Ö{Sfd2/N – (Sfd/N)2}i
= Ö{82/56 – (18/56)2} x 3
= Ö{1.464 – (0.321)2} x 3
= Ö{1.464 – 0.103} x 3
= Ö(1.361) x 3
= 1.166 x 3
= 3.499
| Standard Deviation = 3.50 (Approx.) |
Comment
The value of range is 14, Quartile Deviation is 2.8, Mean Deviation is 0.004 and Standard Deviation is 3.5. As Standard Deviation is the most consistent measure of variability, considering it, it can be said that lower scores are not much dispersed; they remain nearer to the mean. From the analysis of Measures of Central Tendency &Variability, some findings can be noted:
- 27 scores (48%) stand below the mean and 29 scores (52%) stand above the mean. So the distribution is supposed to be normal.
- The mean, median and mode are very near to the same. But Mean>Median>Mode.
- Most scores are near the mean and the further from the mean a score is, the fewer the number of subjects who attained that score.
- Mean ± 1.0 S.D., that is, 12.46 –5.46 contains 7 scores (46.66%)
- Mean ± 2.0 S.D., that is, 15.96 –1.96 contains 14 scores (93.33%).
- Mean ± 2.5 S.D., that is, 17.71 –0.21 contains 17.5 scores (116%).
These findings show that although the distributions of Mean ± 1.0 S.D but the distribution of Mean ± 2.0 S.D. and Mean ± 2.5 S.D. is too far from the normal curve. The distribution is said to be normal and kurtosis.
The distribution is very near to normal but very little positively skewed
Here, Mean > Median > Mode.
Skewness of the distribution = 3 (mean – median) / S.D = 0.01 (Approx).
The value is very low which indicates the distribution is very near to the normal distribution.
The distribution is very near to normal but is very little platykurtic
Leptokurtic – where more scores than normal distribution stand in mean ±2.0 & 3.0S.D.
Measures of Relative Positions
Major measures of relative positions are percentile ranks, Z-score and T-score. I shall determine only Z-score and T-score here as they are more reliable than percentile ranks.
# Standard score (Z – Score), Z = (X – M) / s
# T = 50 + 10Z
Roll No.
| Z –score (Z = (X-M)/ s) | T-score (T = 50 + 10Z) |
1 | (14.5- 8.96) / 3.5 = 1.58 | 65.8 |
2 | (15- 8.96) / 3.5 = 1.72 | 67.2 |
3 | (12- 8.96) / 3.5 = 0.86 | 58.6 |
4 | (14.5- 8.96) / 3.5 = 1.58 | 65.8 |
5 | (12- 8.96) / 3.5 = 0.86 | 58.6 |
6 | (12.5- 8.96) / 3.5 = 1.01 | 60.1 |
7 | (13- 8.96) / 3.5 = 1.15 | 61.5 |
8 | (13- 8.96) / 3.5 = 1.15 | 61.5 |
(15- 8.96) / 3.5 = 1.72 | 67.2 | |
10 | (15- 8.96) / 3.5 = 1.72 | 67.2 |
9 | (11- 8.96) / 3.5 = 0.58 | 55.8 |
12 | (14- 8.96) / 3.5 = 1.44 | 64.4 |
13 | (9.5- 8.96) / 3.5 = 0.54 | 55.4 |
14 | (12- 8.96) / 3.5 = 0.86 | 58.6 |
15 | (10.5- 8.96) / 3.5 = 0.44 | 54.4 |
16 | (13- 8.96) / 3.5 = 1.15 | 61.5 |
17 | (10- 8.96) / 3.5 = 0.29 | 52.9 |
18 | (13- 8.96) / 3.5 = 1.15 | 61.5 |
19 | (14- 8.96) / 3.5 = 1.44 | 64.4 |
20 | (7- 8.96) / 3.5 = – 0.56 | 44.4 |
21 | (11- 8.96) / 3.5 = 0.58 | 55.8 |
22 | (11- 8.96) / 3.5 = 0.58 | 55.8 |
23 | (12- 8.96) / 3.5 = 0.86 | 58.6 |
24 | (10.5- 8.96) / 3.5 =0.44 | 54.4 |
25 | (8.5- 8.96) / 3.5 = – 0.13 | 48.7 |
26 | (9- 8.96) / 3.5 = 0.04 | 50.4 |
27 | (8.5- 8.96) / 3.5 = – 0.13 | 48.7 |
28 | (5.5- 8.96) / 3.5 = – 0.98 | 40.2 |
29 | (7.5- 8.96) / 3.5 = – 0.41 | 45.9 |
30 | (5.5- 8.96) / 3.5 = – 0.98 | 40.2 |
31 | (5- 8.96) / 3.5 = – 1.13 | 38.7 |
32 | (12- 8.96) / 3.5 = 0.86 | 58.6 |
33 | (6- 8.96) / 3.5 = – 0.84 | 41.6 |
34 | (6.5- 8.96) / 3.5 = – 0.70 | 43 |
35 | (6.5- 8.96) / 3.5 = – 0.70 | 43 |
36 | (1- 8.96) / 3.5 = – 2.27 | 27.3 |
37 | (8.5- 8.96) / 3.5 = – 0.13 | 48.7 |
38 | (6.5- 8.96) / 3.5 = – 0.70 | 43 |
39 | (4- 8.96) / 3.5 = – 1.41 | 35.9 |
40 | (5- 8.96) / 3.5 = – 1.13 | 38.7 |
41 | (9- 8.96) / 3.5 = 0.04 | 50.4 |
42 | (6- 8.96) / 3.5 = – 0.84 | 41.6 |
43 | (10.5- 8.96) / 3.5 = 0.44 | 54.4 |
44 | (7- 8.96) / 3.5 = – 0.56 | 44.4 |
45 | (3- 8.96) / 3.5 = – 1.70 | 33 |
46 | (8- 8.96) / 3.5 = – 0.27 | 47.3 |
47 | (7- 8.96) / 3.5 = – 0.56 | 44.4 |
48 | (5- 8.96) / 3.5 = – 1.13 | 38.7 |
49 | (8- 8.96) / 3.5 = – 0.27 | 47.3 |
50 | (3- 8.96) / 3.5 = – 1.70 | 33 |
51 | (7.5- 8.96) / 3.5 = – 0.41 | 45.9 |
52 | (7.5- 8.96) / 3.5 = – 0.41 | 45.9 |
53 | (6- 8.96) / 3.5 = – 0.84 | 41.6 |
54 | (8- 8.96) / 3.5 = – 0.27 | 47.3 |
55 | (12.5- 8.96) / 3.5 = 1.01 | 60.1 |
56 | (8- 8.96) / 3.5 = – 0.27 | 47.3 |
Comment
From this table relative position of any student in comparison to other or whole as a group can easily be made. The T-score shown above itself is a comprehensive presentation of relative position. Scores above 50 are more than average, scores below 50 are less than average.
Grading of Test-1 Results:
Norm of Grading
Number Range (Approx) | Grade | GPA |
13 and above | A+ | 5.00 |
11-12 | A | 4.00 |
9 – 10 | B | 3.00 |
7 – 8 | C | 2.00 |
5 – 6 | D | 1.00 |
0 – 4 | F | —— |
Grading of students:
Roll No. | Obtained Mark | Grade | GPA |
1 | 14.5 | A+ | 5.00 |
2 | 15 | A+ | 5.00 |
3 | 12 | A | 4.00 |
4 | 14.5 | A+ | 5.00 |
5 | 12 | A | 4.00 |
6 | 12.5 | A+ | 5.00 |
7 | 13 | A+ | 5.00 |
8 | 13 | A+ | 5.00 |
9 | 15 | A+ | 5.00 |
10 | 15 | A+ | 5.00 |
11 | 11 | A | 4.00 |
12 | 14 | A+ | 5.00 |
13 | 9.5 | B | 3.00 |
14 | 12 | A | 4.00 |
15 | 10.5 | A | 4.00 |
16 | 13 | A+ | 5.00 |
17 | 10 | B | 3.00 |
18 | 13 | A+ | 5.00 |
19 | 14 | A+ | 5.00 |
20 | 07 | C | 2.00 |
21 | 11 | A | 4.00 |
22 | 11 | A | 4.00 |
23 | 12 | A | 4.00 |
24 | 10.5 | A | 4.00 |
25 | 8.5 | B | 3.00 |
26 | 9 | B | 3.00 |
27 | 8.5 | B | 3.00 |
28 | 5.5 | D | 1.00 |
29 | 7.5 | C | 2.00 |
30 | 5.5 | D | 1.00 |
31 | 05 | D | 1.00 |
32 | 12 | A | 4.00 |
33 | 6 | D | 1.00 |
34 | 6.5 | C | 2.00 |
35 | 6.5 | C | 2.00 |
36 | 1 | F | 00 |
37 | 8.5 | B | 3.00 |
38 | 6.5 | C | 2.00 |
39 | 4 | F | 00 |
40 | 5 | D | 1.00 |
41 | 9 | B | 3.00 |
42 | 6 | D | 1.00 |
43 | 10.5 | A | 4.00 |
44 | 7 | C | 2.00 |
45 | 3 | F | 00 |
46 | 8 | C | 2.00 |
47 | 7 | C | 2.00 |
48 | 5 | D | 1.00 |
49 | 8 | C | 2.00 |
50 | 3 | F | 00 |
51 | 7.5 | C | 2.00 |
52 | 7.5 | C | 2.00 |
53 | 6 | D | 1.00 |
54 | 8 | C | 2.00 |
55 | 12.5 | A+ | 5.00 |
56 | 8 | C | 2.00 |
It is to be noted that this grading was not executed in the school’s test result; it is done only to fulfill the purpose of statistical analysis report.
Percentage of pass and Fail:
P/F | No. of students | Percentage |
Pass | 52 | 98.2% |
Fail | 04 | 1.8% |
Percentage of grading:
Grade | No. of students | Percentage |
A+ | 13 | 20% |
A | 11 | 18% |
B | 07 | 30% |
C | 13 | 34% |
D | 08 | 14% |
F | 04 | 2% |
Analysis of Test-2 results (MCQ & Essay type test)
Student’s score in Test-2
Roll No. | Name | Obtained Mark (out of 15) |
1 | Razia Sarmin | 14.5 |
2 | Farzana Akthar Tonnee | 11.5 |
3 | Sonia Akthar | 9 |
4 | Tohomina | 12.5 |
5 | Morshada Akhtar | 12 |
6 | Shohagi Mim Lza | 11.5 |
7 | Fatama Akhtar | 12.5 |
8 | Sadia Islam | 13 |
9 | Moriam Barek | 13.5 |
10 | Shanta Islam | 12.5 |
11 | Sanjida Jahan | 15 |
12 | Jannatul Naim | 11.5 |
13 | Fatema Tuj Johra | 12.5 |
14 | Fariha Jahan Konok | 10.5 |
15 | Sanjida Begum | 9.5 |
16 | Hajera Sultana | 12 |
17 | Jeba Akter | 12.5 |
18 | Jamim Natia | 11 |
19 | Habiba Akter | 14 |
20 | Afrin Sultana | 7.5 |
21 | Shahid Akter | 12 |
22 | Jannatul Naim | 11.5 |
23 | Modinatul Ferdous | 12.5 |
24 | Usma Akter | 8 |
25 | Rupoma Akter | 8.5 |
26 | Anushi Choudoury | 7 |
27 | Sumaiya Najmunnahar | 6 |
28 | Saika alam | 5.5 |
29 | Jannatul Baki naurin | 2 |
30 | Tanis fahima | 10 |
31 | Salma Akter | 9.5 |
32 | Momo Khanom | 10 |
33 | Trisha Chokroborti | 8 |
34 | Najmunnahar | 11 |
35 | Maliha Tabassum | 8.5 |
36 | Sumona Akter | 2.5 |
37 | Afroja Akter | 8.5 |
38 | Hamida Akter | 7.5 |
39 | Faria Sultana | 5.5 |
40 | Sumona Akter | 11.5 |
41 | Joti Hajra | 8.5 |
42 | Sumaiya Akter | 9 |
43 | Najiba Harun | 11 |
44 | Sumona Haque | 7 |
45 | Jannatul Ferdous | 3 |
46 | Asifa Rahman | 6 |
47 | Marjan Alam | 9 |
48 | Khadija Akter | 5 |
49 | Sadia Afrin | 4 |
50 | Nasrin Akhtar | 3.5 |
51 | Nurnahar Akhtar | 8.5 |
52 | Hasina Akhtar Sume | 12 |
53 | Kawsar Ferdushe | 5.5 |
54 | Sonia Sigma | 10 |
55 | Puza Rani | 10.5 |
56 | Momotaz Akhtar Lotha | 10 |
Tabulation of scores:
# Number of the class = (Range/class Interval) +1
= {(Highest score-Lowest score)/Class Interval} +1
= {(15 – 2)/3} +1
= (13/3) +1
= 4.33 + 1
= 5.33
= 6 (in full number)
Frequency Distribution Table:
Class Interval (C.I.) | Tallies | Frequency |
1 – 3 | ||| | 3 |
4 – 6 | |||| || | 7 |
7 – 9 | |||| |||| |||| |||| | 19 |
10 – 12 | |||| |||| |||| |||| || | 22 |
13 – 15 | |||| | 5 |
N = 56
Measures of Central Tendency:
The Mean
# True Mean = A.M.+(Σfd/N)i
C.I. | Mid point | Frequency (f) | Deviation (d) | Product (fd) |
1 – 3 | 2 | 3 | – 2 | – 6 |
4 – 6 | 5 | 7 | – 1 | – 7 |
7 – 9 | 8 | 19 | 0 | 0 |
10 – 12 | 11 | 22 | + 1 | + 22 |
13 – 15 | 14 | 5 | + 2 | + 10 |
N = 56 Σfd = 19
| Here – |
A.M.= 8
N = 56
Σfd = 19
i = 5
True Mean = A.M.+(Σfd/N)i
= 8 + (19/56) 3
= 8 + (0.339) 3
= 8 + 1.017
= 9.017
| Mean = 9.02 |
The Median
# Median = L+{(N/2-cfu)/fm}I
C.I. | Lower and upper limit of C.I. | Frequency (f) | Cumulative Frequency (cfu) |
1 – 3 | 0.5 – 3.5 | 3 | 3 |
4 – 6 | 3.5 – 6.5 | 7 | 10 |
7 – 9 | 6.5 – 9.5 | 19 | 29 |
10 – 12 | 9.5 – 12.5 | 22 | 51 |
13 – 15 | 12.5 – 15.5 | 5 | 56 |
| Here- |
L = 6.5
Cfu = 10
fm = 19
i = 3
N = 56
Median = L+ {(N/2-cfu)/fm} i
= 6.5 + {(28 – 10)/ 19} 3
= 6.5 + (18/19) 3
= 6.5 + (0.947) 3
= 6.5 + 2.841
= 9.341 (Approx.)
Median = 9.34 |
The Mode
Mode = 3 median – 2 mean
=3 x 9.34 – 2 x 9.02
= 28.02 – 18.04
= 9.98
Mode = 9.98 |
Comment
The value of mean, median and mode is respectively 9.02, 9.34 and 9.98. The values of mean and median and mode are nearer to each other. Here 10 – 12 class intervals contains maximum number of frequency, mode, mean and median belong to that class interval.
Measures of Variability:
The Range
Range = Highest score – Lowest score
= 15 – 2
=13
| Range = 13 |
The Quartile Deviation
# Q1 = L1 + {(N/4-F1)/fq1}I
| Here- |
L1 = 6.5
F1 = 10
fq1 = 19
i = 3
N = 56
Q1 = L1 + {(N/4-F1)/fq1} i
= 6.5 +{(56/4 – 10)/19} 3
= 6.5 + {(14 -10)/19} 3
= 6.5 + (4/19) 3
= 6.5 + 0.631
= 7.131
Q1= 7.13 (Approx.) |
# Q3 = L3 + {(3N/4 – F3)/fq3} i
| Here- |
L3 = 9.5
F3 = 29
fq3 = 22
i = 3
N = 56
Q3 = L3 + {(3N/4 – F3)/fq3} I
= 9.5 + {(42 – 29)/22} 3
= 9.5 + {13/22} 3
= 9.5 + (0.590) 3
= 9.5 + 1.77
= 11.27
| Q3 = 11.27 (Approx.) |
Quartile Deviation, Q = (Q3 – Q1)/2
= (11.27 – 7.13)/2
= 4.14/2
= 2.07
| Quartile Deviation = 2.07 (Approx.) |
Mean Deviation
# Mean Deviation = S|fd| /N
C.I. | Mid point (X) | Mean | f | d = x – M | fd |
1 – 3 | 2 | 9.02 | 3 | – 7.02 | – 21.06 |
4 – 6 | 5 | 9.02 | 7 | – 4.02 | – 28.14 |
7 – 9 | 8 | 9.02 | 19 | – 1.02 | – 19.38 |
10 – 12 | 11 | 9.02 | 22 | +1.98 | + 43.56 |
13 – 15 | 14 | 9.02 | 5 | + 4.98 | + 24.90 |
S|fd| = – 0.88
| Here- |
S|fd| = -0.88
N = 56
Mean Deviation = S|fd| /N
= – 0.88/56
= – 0.01
| Mean Deviation = -0.01 (Approx.) |
Standard Deviation
# S.D. or s = Ö{Sfd2/N – (Sfd/N)2}I
C.I. | f | Deviation (d) | fd | fd2 |
1 – 3 | 3 | – 2 | – 6 | 12 |
4 – 6 | 7 | – 1 | – 7 | 7 |
7 – 9 | 19 | 0 | 0 | 0 |
10 – 12 | 22 | + 1 | + 22 | 22 |
13 – 15 | 5 | + 2 | + 10 | 20 |
∑fd = 19 ∑fd2 = 61
| ∑fd = 19 |
∑fd2 =61
i =3
N = 56
S.D. or s = Ö{Sfd2/N – (Sfd/N)2}i
= Ö{61/56 – (19/56)2} x 3
= Ö{1.089 – (0.339)2} x 3
= Ö{1.089 – 0.114} x 3
= Ö(0.975) x 3
= 0.987 x 3
= 2.961
| Standard Deviation = 2.96 (Approx.) |
Comment
The value of range is 13, Quartile Deviation is 2.07, Mean Deviation is -0.01 and Standard Deviation is 2.96. As Standard Deviation is the most consistent measure of variability, considering it, it can be said that lower scores are not much dispersed; they remain nearer to the mean. From the analysis of Measures of Central Tendency &Variability some findings can be noted:
- 26 scores (46%) stand below the mean and 30 scores (54%) stand above the mean. So the distribution is nearly normal.
- The mean, median and mode are not the same. Mean>Median>Mode.
- Most scores are near the mean and the further from the mean a score is, the fewer the number of subjects who attained that score.
- Mean ± 1.0 S.D., that is, 11.98 – 6.06 contains total 5.92 scores (39.46%).
- Mean ± 2.0 S.D., that is, 14.94 – 3.1 contains total 11.84 scores (78.93%).
- Mean ± 3.0 S.D., that is, 17.9 – 0.14 contains total 17.76 scores (118.4%).
These findings show that although the distributions not so far from the normal distribution and it are a little negatively skewed also.
The distribution is very near to normal & very little negatively skewed.
Here, Mean < Median < Mode.
Skewness of the distribution = 3 (mean – median) / S.D = – 0.32
The value of skewness is very low and therefore ignorable.
The distribution is very nearly normal.
Measures of Relative Positions:
Major measures of relative positions are percentile ranks, Z-score and T-score. I shall determine only Z-score and T-score here as they are more reliable than percentile ranks.
# Standard score (Z – Score), Z = (X – M) / s
# T = 50 + 10Z
Roll No.
| Z –score (Z = (X-M)/ s) | T-score (T = 50 + 10Z) |
1 | ( 14.5- 9.02) / 2.96 = 1.85 | 68.5 |
2 | ( 11.5- 9.02) / 2.96 = 0.83 | 58.3 |
3 | ( 9- 9.02) / 2.96 = -0.00 | 50 |
4 | ( 12.5- 9.02) / 2.96 = 1.17 | 61.7 |
5 | ( 12- 9.02) / 2.96 = 1.00 | 60 |
6 | ( 11.5- 9.02) / 2.96 = 0.83 | 58.3 |
7 | ( 12.5- 9.02) / 2.96 = 1.17 | 61.7 |
8 | ( 13- 9.02) / 2.96 = 1.34 | 63.4 |
9 | ( 13.5- 9.02) / 2.96 = 1.51 | 65.1 |
10 | ( 12.5- 9.02) / 2.96 = 1.17 | 61.7 |
11 | ( 15- 9.02) / 2.96 = 2.02 | 70.2 |
12 | ( 11.5- 9.02) / 2.96 = 0.83 | 58.3 |
13 | ( 12.5- 9.02) / 2.96 = 1.17 | 61.7 |
14 | ( 10.5- 9.02) / 2.96 = 0.5 | 55 |
15 | ( 9.5- 9.02) / 2.96 = 0.16 | 51.6 |
16 | ( 12- 9.02) / 2.96 = 1.00 | 60 |
17 | ( 12.5- 9.02) / 2.96 = 1.17 | 61.7 |
18 | ( 11- 9.02) / 2.96 = 0.66 | 56.6 |
19 | ( 14- 9.02) / 2.96 = 1.68 | 66.8 |
20 | ( 7.5- 9.02) / 2.96 = – 0.51 | 44.9 |
21 | ( 12- 9.02) / 2.96 = 1.00 | 60 |
22 | ( 11.5- 9.02) / 2.96 = 0.83 | 58.3 |
23 | ( 12.5- 9.02) / 2.96 = 1.17 | 61.7 |
24 | ( 8- 9.02) / 2.96 = – 0.34 | 49.66 |
25 | ( 8.5- 9.02) / 2.96 = – 0.17 | 48.3 |
26 | ( 7- 9.02) / 2.96 = – 0.68 | 43.2 |
27 | ( 6- 9.02) / 2.96 = – 1.02 | 39.8 |
28 | ( 5.5- 9.02) / 2.96 = – 1.18 | 38.2 |
29 | ( 2- 9.02) / 2.96 = – 2.37 | 26.3 |
30 | ( 10- 9.02) / 2.96 = 0.33 | 53.3 |
31 | ( 9.5- 9.02) / 2.96 = 0.16 | 51.6 |
32 | ( 10- 9.02) / 2.96 = 0.33 | 53.3 |
33 | ( 8- 9.02) / 2.96 = – 0.34 | 49.66 |
34 | ( 11- 9.02) / 2.96 = 0.66 | 56.6 |
35 | ( 8.5- 9.02) / 2.96 = – 0.17 | 48.3 |
36 | ( 2.5- 9.02) / 2.96 = – 2.20 | 28 |
37 | ( 8.5- 9.02) / 2.96 = – 0.17 | 48.3 |
38 | ( 7.5- 9.02) / 2.96 = – 0.51 | 44.9 |
39 | ( 5.5- 9.02) / 2.96 = – 1.18 | 38.2 |
40 | ( 11.5- 9.02) / 2.96 = 0.83 | 58.3 |
41 | ( 8.5- 9.02) / 2.96 = – 0.17 | 48.3 |
42 | ( 9- 9.02) / 2.96 = -0.00 | 50 |
43 | ( 11- 9.02) / 2.96 = 0.66 | 56.6 |
44 | ( 7- 9.02) / 2.96 = – 0.68 | 43.2 |
45 | ( 3- 9.02) / 2.96 = – 2.03 | 29.7 |
46 | ( 6- 9.02) / 2.96 =- 1.02 | 39.8 |
47 | ( 9- 9.02) / 2.96 = -0.00 | 50 |
48 | ( 5- 9.02) / 2.96 = – 1.35 | 36.5 |
49 | ( 4- 9.02) / 2.96 = – 1.69 | 33.1 |
50 | ( 3.5- 9.02) / 2.96 = – 1.86 | 31.4 |
51 | ( 8.5- 9.02) / 2.96 = – 0.17 | 48.3 |
52 | ( 12- 9.02) / 2.96 = 1.00 | 60 |
53 | ( 5.5- 9.02) / 2.96 = – 1.18 | 38.2 |
54 | ( 10- 9.02) / 2.96 = 0.33 | 53.3 |
55 | ( 10.5- 9.02) / 2.96 = 0.5 | 55 |
56 | ( 10- 9.02) / 2.96 = 0.33 | 53.3 |
Comment
From this table relative position of any student in comparison to other or whole as a group can easily be made. The T-score shown above itself is a comprehensive presentation of relative position. Scores above 50 are more than average, scores below 50 are less than average.
Grading of Test-2 Results:
Norm of Grading
Number Range (Approx) | Grade | GPA |
13 and above | A+ | 5.00 |
11-12 | A | 4.00 |
9 – 10 | B | 3.00 |
7 – 8 | C | 2.00 |
5 – 6 | D | 1.00 |
0 – 4 | F | —— |
Grading of students
Roll No. | Obtained Mark | Grade | GPA |
1 | 14.5 | A+ | 5 |
2 | 11.5 | A | 4 |
3 | 9 | B | 3 |
4 | 12.5 | A+ | 5 |
5 | 12 | A | 4 |
6 | 11.5 | A | 4 |
7 | 12.5 | A+ | 5 |
8 | 13 | A+ | 5 |
9 | 13.5 | A+ | 5 |
10 | 12.5 | A+ | 5 |
11 | 15 | A+ | 5 |
12 | 11.5 | A | 4 |
13 | 12.5 | A+ | 5 |
14 | 10.5 | A | 4 |
15 | 9.5 | B | 3 |
16 | 12 | A | 4 |
17 | 12.5 | A+ | 5 |
18 | 11 | A | 4 |
19 | 14 | A+ | 5 |
20 | 7.5 | C | 2 |
21 | 12 | A | 4 |
22 | 11.5 | A | 4 |
23 | 12.5 | A+ | 5 |
24 | 8 | C | 2 |
25 | 8.5 | B | 3 |
26 | 7 | C | 2 |
27 | 6 | D | 1 |
28 | 5.5 | D | 1 |
29 | 2 | F | 0 |
30 | 10 | B | 3 |
31 | 9.5 | B | 3 |
32 | 10 | B | 3 |
33 | 8 | C | 2 |
34 | 11 | A | 4 |
35 | 8.5 | B | 3 |
36 | 2.5 | F | 0 |
37 | 8.5 | B | 3 |
38 | 7.5 | C | 2 |
39 | 5.5 | D | 1 |
40 | 11.5 | A | 4 |
41 | 8.5 | B | 3 |
42 | 9 | B | 3 |
43 | 11 | A | 4 |
44 | 7 | C | 2 |
45 | 3 | F | 0 |
46 | 6 | D | 1 |
47 | 9 | B | 3 |
48 | 5 | D | 1 |
49 | 4 | F | 0 |
50 | 3.5 | F | 0 |
51 | 8.5 | B | 3 |
52 | 12 | A | 4 |
53 | 5.5 | D | 1 |
54 | 10 | B | 3 |
55 | 10.5 | A | 4 |
56 | 10 | B | 3 |
It is to be noted that this grading was not executed in the school’s test result; it is done only to fulfill the purpose of statistical analysis report.
Percentage of pass and Fail
P/F | No. of students | Percentage |
Pass | 54 | 96% |
Fail | 02 | 4% |
Percentage of grading
Grade | No. of students | Percentage |
A+ | 11 | 27% |
A | 14 | |
B | 14 | 33% |
C | 06 | 23% |
D | 06 | 13% |
F | 05 | 4% |
Conclusion
Considering all the things, it can be said that NilkhetHigh School has more shortcomings than advantages for effective teaching. Two major reasons for this are: insufficient physical, human and monetary resources, and lack of faith of teachers upon students. Improving resource is time consumiong. Especially supply of sufficient money is a pre condition to improve the physical and human resources. Lack of supply of monetary resources can hinder the improvement of quality and quantity development.
But I believe students of NilkhetHigh School have the ability to do well. I have got them very intelligent, curious and participating in the class. They have interests in pleasant studies. Before joining the school since leaving and till now I have heard it many times that the students of Nilkhet High School are very dull, they are not meritorious even not mediocre because of their weak social and economic condition. Of course social and economic background is very important factors, but my quest was if the school authority and teachers were careful enough to help them do good. Are they really as much weak as they are said? My answers are NO and NO. I have experienced them. A little care, a pleasant and participating teaching-learning environment can do much for them to become successful. I am hoping for those days.
Bibliographies
- Gay, L. R. , Educational Research: Competencies for analysis and application, Prentice Hall inc, New Jersey, 1996.
- Audit Report 2001-2002 & other recent documents of Nilkhet High School