1.1 Introduction
Ours is an age of electricity. Electricity is replacing other sources of energy like water, oil and coal, because it is comparably cheap, efficient and useful. Electricity supplies every kind of energy to man to improve his scientific inventions and increase his social amenities. From house-lighting to the running of giant factories, it is the invisible current that flows through the thin copper wire of insignificant dimension. Just switching on of button releases power and man has not failed to avail himself of both the constructive and destructive potentialities of electrical energy.
Consider the constructive side of electricity. It is a source of light, heat and other comforts. Houses, streets, parks, pleasure- houses and places are lighted with electricity. Heating and cooling processes are also carried on by it. Air-conditioning is a feat of modern electrical engineering. Refrigerators not only condition the temperature but also preserve and facilitate man’s food supply. Transport of perishable foods, drugs and drinks, in good condition, from one corner of the globe to another, is made possible by this device. Again, labor in every form in the house, in the office, and in the factory is simplified by the introduction of electrical devices.
Among domestic services, machinery of every type is worked more cheaply and efficiently by electricity. And many a labor-saving and time-saving device using electrical energy has been introduced to minimize drudgery at home and at office Modern communications and transport are rendered safer speedier and more comfortable by the introduction of the wireless telephone and the telegraph, the electric train, tram and motor Recent inventions like the gramophone, the talkie, radio and television are some of the other triumphs that man has achieved by its application. Electricity has also come to play an important part in the treatment of diseases by electrotherapy.
1.2 History of Electricity
No man invented electricity. It is a natural thing. Electricity was discovered by Benjanin Franklin in 1752.Thales of Miletus (630-550 BC) was the first that about 600 BC, knew that amber, when rubbed acquires the power of attraction for some objects. However, it was the Greek philosopher Theophrastus (374-287 BC) the first, that in a treatise written three centuries later, established that other substances have the same power, thus leaving a record of the first scientific study on electricity. In 1600, Queen Elizabeth I ordered the Royal Physical William Gilbert (1544-1603) to study the magnets to improve the accuracy of compasses used in navigation, this work being the main basis for defining the fundamentals of Electrostatics and Magnetism. In 1800 Alessandro Volta invents an electric battery, the first source of DC current. In 1888 Nikola Tesla invents the first practicable AC motor and polyphase power transmission system Westinghouse acquired exclusive rights to Nikola Tesla’s patent for the polyphase system and lured Tesla to join the electric company and continue his work on the AC motor he had developed. In 1888 Oliver B.Shallenberger (1860-1898) invented an induction meter for measuring alternating current, a critical element in the Westinghouse AC system.
1.3 History of Electricity in Bangladesh
Dhaka, the capital city of Bangladesh is an ancient city. There is a public saying that Nawab of Dhaka installed a small generator in his residence “Ahsan Monjil” and started generating power at 5pm on 7th of December 1901, which is considered as the introduction of electricity in the then Dhaka city. Later, in and around 1930, M/S.DEVCO, a subsidiary of M/S. Octavians Steel Company, developed electricity distribution system at 400V level under complete private ownership and brought that for public use. Most probably in the year 1933 a power generating station named “Dhanmondi Power House” was established with two 1500 KW generators each and from there the electricity distribution system was started to sale to the public on commercial basis.
After partition of the Indian sub-continent in the year 1947, power generation, transmission and distribution authority in the then East Pakistan region were confined within some private companies.
The electricity supply in the then 17 districts were limited to the township areas only foray limited time (i.e.; for use during night time only) except Dhaka city area. At that time other than some private companies, power was used to be generated by some isolated industries like tea, sugar, textiles and railway workshops. In aggregate, the generation capacity of this region was about 21 MW at that time.
To cope up with the growing power demand of this region, the then Govt. of Pakistan created Electricity Directorate in 1948 to plan and improve power supply. In 1957 the Govt. took over the private owned companies in Dhaka and placed them under the Electricity Directorate for power generation and distribution.
In 1959, East Pakistan Water and Power Development Authority (EPWAPDA) was established to look after generation, transmission, distribution and sale of electricity throughout the province of the then East Pakistan. After the independence of Bangladesh in 1972, Bangladesh Power Development Board (BPDB) was created to look after the same function. Dhaka Electric Supply, headed by a Chief Engineer under BPDB used to control the electricity distribution and sales in Greater Dhaka District area up to September 1991.
1.4 Current Production
At present only 50% of the people have access to electricity. Per capital generation is 252 kWh which is one of the lowest in the region. Every year the demand is increasing of a rate of 10%. Generation capacity could not be increased accordingly during past years which has resulted increasing power shortage in the country. Present generation capacity is 7663 MW including 2944 MW generation addition since this Government came to power in January, 2009. At present 500-700MW capacity is unable to generation due to gas shortage. About 800MW load shedding was experienced during peak hours of the last summer. Under the above context, with a vision to achieve 8% projected GDP growth by 2013 and beyond, a massive generation expansion program has been adopted in order to maintain sustained electricity supply facilitating establishment of new industries and SMEs, accomplishment of national target of ‘electricity for all’ by 2021 and to build ‘digital Bangladesh’. Existing power generation scenario at a glance has been appended.
1.4.1 Energy Generation
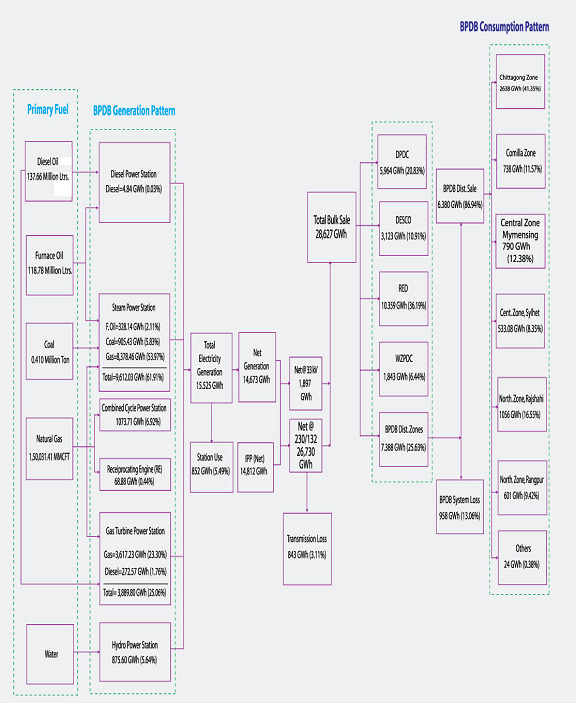
During this Fiscal year 14,673 GWh of net energy was generated in the public sector power plants. In addition about 14,812 GWh of electricity was purchased by BPDB as a single buyer from IPPs (Independent power producer), SIPPS & Rental power plants in the private sector. As a result, the net energy generated by private and public sector power plants stood at 29,485 GWh (Excluding 1871 GWh power purchase by REB from Their IPP), which was 7.33% higher than the previous year’s net generation of 27,470 GWh.
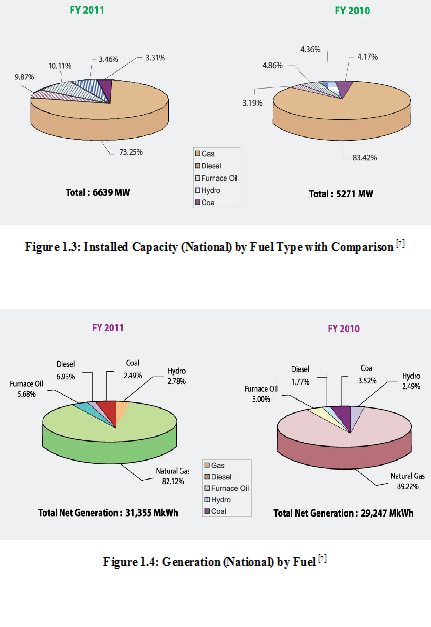
Total net energy generated by the public and private sector power plants (Excluding REB) by type of fuel were as follows:
1.4.2 Overall Efficiency
The overall thermal efficiency of the generators in the public sector in FY 2011 was 31.00% compared to 32.12% in the previous year. The following table shows the units, which were under major maintenance in FY 2011.
1.5 Power Crisis in Bangladesh
Electricity in the modern century is the most important infrastructure which contributes the most for the economic development of a nation. For a developing country like Bangladesh whose per capita electricity consumption (130Kwh/160Kwh per annum) being among the lowest in the neighboring least developed nations amply reflect the economic index of the country. Electricity has contributed largely in generating resources, employment and income. Electricity contributed this process by generating additional employment in agriculture, generating income from new industry, expansion of business and developing the service sector. Thus, in the sector of agriculture, industry, health and education electrification is severely needed. Electrification brings indirect benefits to the unemployed people. When industrial and commercial units flourish, it becomes the centre of attraction for the people of neighboring non-electrified places. There are numerous examples of residents of non-electrified villages having shops in electrified markets in a third world country like Bangladesh. Electrification gives people more scope to work and earn in both urban and rural areas .For the economic emancipation and in order to meet the Millennium Development Goals necessary steps should be taken to meet the electricity demand. That’s why government decided to build power plants in private sector by the Independent Power Producers (IPP). Also the government published a policy named “Private Sector Power Generation Policy of Bangladesh”. And everyday 25%-30% of total electricity is being produced by these Independent Power Producers (IPP). In summer, 2006 during pick hour the daily electricity demand of the country was almost 4500 MW. On the other hand the average production was in between 2500 MW -3000MW. The reason is that government is neither able to provide the finance to install new power plants nor able to give license to new Independent Power Producers (IPP).
According to the power sector growth in Bangladesh, the country needs 450 MW power each year to meet the growing demands. Previously, all the power plants of this third world country were in public sector. But all must bear in mind that the building of this particular infrastructure require large amount of capital and is encountering increasing difficulties to finance the required capacity either through the government budget or even by the international development agencies and financing organizations. But the Government of Bangladesh (GOB) is unable to provide the finance to install new power plants according to the growing demand. That’s why in the year 1996 Government of Bangladesh decided to build power plants in private sector. Instead of taking this step now the country is facing severe power crisis. This paper discusses the problems to privatize power generation sector and prospects of private sector power plants. Necessary recommendations will also be given in this paper for the benefit of the power sector of the country.
1.5.1 Installed Capacity
Total installed capacity is 6639MW including 1231MW IPP, 1,679 MW SIPP/Rental power plant & 226MW in RED. The maximum peak generation was 4890MW which was 6.17% higher than that in the previous year. The reasons for lower actual peak generation were some plants were out of operation for maintenance, rehabilitation & overhauling, capacity of same plants were derated due to aging and gas shortage. The generation capacity mix shown below:
1.6 Causes of Power Crisis
Although the government has taken several initiatives for reducing the crisis of electricity, yet the crisis persists. This is mainly due to the problems associated with high gas dependency, improper privatization policy, lack of satisfactory and timely implementation of allocated money, political reasons, over population etc.
High Gas Dependency
The most important reason at the moment is that the government is unable to ensure the supply of natural gas, the main primary fuel that is used to produce electricity. Shortage of available gas supply creates a struggling situation of electricity generation. Many power plants are idle due to the shortage of gas supply. This has resulted in the lower generation of electricity. On the other hand, unprecedented delay in finalizing a coal policy makes it difficult to generate expected level of electricity. Government remains silent about the exploration and exploitation of coal, which is cheaper and safer in generating electricity.
Inefficient Organizational Management
In view of the fact that BPDB has been in losses, unable to recover its operation cost through sales revenue, the subsidy to REB come from public funds rather than cross-subsidization from BPDB’s other customers (Alam et al., 2004). Alam et al. (2004) argues that, these losses implied that allocation to BPDB by the government could not be fully utilized for capital investment in expanding electricity infrastructure. Also it is likely that this affected the available resources with the government for allocation to the rural electrification program (TIB, 2007).
Improper Privatization Policy
In April 2010, 40 percent electricity was generated by private sector which has increased to 44 percent by April 2011. Rental, quick rental and peaking plants were under taken on a first-track basis to address the nagging power crisis. But mostly, second hand equipments and machineries are used in such plants, which will be less efficient and the tariff will ultimately rise. Additionally, many of them are not in a position to generate electricity till to date. Furthermore, there is a lack of transparency. Tendering persists in that process. Thus, the establishment and timely commencing production of the major segments of the power plant, contracted to be established on ‘quick rental’ basis in the country, are failing gradually. Thus, it is not only causing huge amount of financial loss to the national exchequer but also increasing the suffering of the citizen of the country. Here, the government has to face two types of challenges. One is the higher subsidy due to the costly quick rental power plants and the other is the lower production that is expected.
Lack of Timely Implementation of Allocated Money
The government has given highest priority to the development in power sector which has been reflected in the allocation of annual development programme (ADP). The total allocation in the power sector was Tk. 7145.28 for the fiscal year 2011-12. Over the last few years, there was a significant gap between the allocation and the implementation of ADP in the power sector. Considering the last fiscal year, only 29 percent of the allocated ADP had been implemented during the first eight months of that fiscal year. When a huge amount of allocated money is required to be implemented within a short period of time, there creates corruptions. That is why; the lack of timely implementation has reduced the proper development in the sector of electricity, especially, in the generation of the electricity.
Corruption
Klitgaard (1988) defines corruption as “the abuse of office for personal gain”. In Bangladesh electricity supply industry corruption takes many forms, ranging from grand corruption – the capture of high office of government by elites and the uses of these offices for private gain – to “petty” corruption – the use of bribes or other “facilitating payments” to provide services, bend or break laws (TIB, 2007; Azfar, 2002; Johnston, 1996) .TIB (2007), World Bank(2003), Newbery(2006) & Smith(2004) think Bangladesh electricity supply industry suffers from all sort of malpractices and inefficiencies, particularly ‘corruption‘. Ahmad (2007) argues that, corruption takes place because of inadequacies in existing public management systems as well as in social and cultural role of communal bonds and kinship ties within social framework’.
Insufficient Government Funding
USAID-SARI/Energy (2007) finds that Bangladesh Government had insufficient fund for electricity supply industry since its emergence as electricity generation, transmission and distribution require large financial investment. Bangladesh‘s electricity generation plants have been constantly incapable to meet system demand since 1990s (Newbery, 2005). Newbery (2005) argues that, shortages of government funds for electricity generation plant maintenance and for installation of new plants have created this acute problem in Bangladesh.
Political Reason
In Bangladesh, the governments come and go and the issue of electricity remains a struggling one. In order to win the mind of voters, the politicians are very much interested in covering a lot of areas without thinking the existing generation. This may bear information about the huge coverage of the electricity but in reality, it creates crisis. This type of politics makes the crisis more acute.
Over Population
There has been an increase in the demand for electricity in the recent years as a result of industrial development and population growth. One of the common matters in the country is over population which creates a lot of problem in various development sectors. More population means more consumption of electricity. Population is increasing but the generation of electricity is not increasing as required. After all, there is an improvement in the life style of the citizen in the country. With the improvement of the people’s life standard, the demand for electricity has also increased. As the generation has increased with a slower rate than that of the demand for electricity, the crisis of electricity is on the rise.
1.7 Potential Solution for Developed Country
As the world slouches into the 21st century, one of the global economic realities is that more and more developing nations, much less the “First World,” are competing for fossil fuel resources whose production is rising more slowly than demand.
Complicating the picture are the booming economies of two BRIC nations, India and China, a development that ensures that developed nations will be in increasing competition for global supplies of oil, natural gas and coal, whose production is struggling to keep with increasing demand.
An alternative relentlessly pushed by Western corporate interests is nuclear power, whose proponents never cease to remind their potential audience that nuclear power plants (NPPs), unlike those fired by coal or oil, emit no greenhouse gases, no small consideration in the world community worried about global warming.
But the global nuclear power industry has three strikes against it – cost, catastrophes, whether man-made (Three Mile Island, Chernobyl) or natural (Fukushima Daiichi) and the not inconsiderable problem of disposing of nuclear waste generated by NPPs. Despite civilian nuclear programs dating back to the early 1960s, no country has yet developed an environmentally safe means of disposing of NPP’s nuclear by products, and these three issues are forcing a slow but significant worldwide rethink on the viability of nuclear electrical production.
Needless to say, the well-entrenched world nuclear power generation, with trillions of dollars invested and potentially billions more in the form of new NPP contracts, is fighting a furious rear-guard action, but the ultimate outcome of the titanic struggle is anything but clear, given a number of recent events.
In a rare move, where a country actually heeds the wishes of its citizens, Japan has reversed course-opting to phase out nuclear energy completely and to replace it with renewable energy.
Public aversion to nuclear since the Fukushima accident in March 2011 has proven to be too strong for Japan’s government to ignore.
Japan will have no nuclear power by the end of the 2030s, according to the new energy policy approved by Prime Minister Yoshihiko Noda on September 14. The policy does call for idled reactors to restart during the wind-down period.
The policy calls for boosting renewable energy to 30% of the country’s energy mix through an investment of JPY 38 trillion ($487 billion) in renewable energy and more than double that in energy efficient technologies (JPY 84 trillion) over the next two decades.
Solution for France
A European energy policy must pursue the objective of a sustainable, competitive and secure supply of energy. If the EU continues on its present course, this key objective will not be attained. In January 2007, the European Commission adopted an energy policy for Europe. This was supported by several documents on different aspects of energy and included an action plan to meet the major energy challenges Europe faces. Each European citizen must be informed of these challenges and the role they should play in meeting them. Renewable energies help combat climate change while increasing security of supply.
The electricity sector in France is the main article of electricity in France. Energy in France focuses energy and electricity production, consumption and import in France. Energy policy of France will describe the politics of France related to energy more in detail.
In the year 2009 electricity was produced with nuclear power 76%, renewable sources 14% and fossil fuels 10%. France has the largest share of nuclear electricity in the world in its grid. The French nuclear power sector is almost entirely owned by the French government and the degree of the government subsidy is difficult to ascertain because of a lack of transparencies in the finances of the operation.
The production of the nuclear power in France decreased 12% in 2009 compared to 2004 equivalent to 8% units share less nuclear power. It was almost equal to the 7% drop in electricity export.
Piper HYPERLINK “http://en.wikipedia.org/wiki/Piper_Jaffray”Jaffray expected strong growth in France in 2009 and 2010, partly because of an expected decline in the price of solar panels and partly because of subsidies introduced in 2006 making themselves felt. France should be a key driver for solar together with Italy during 2009-2010. Piper Jaffray believes that France would add 500 megawatts of capacity in both 2009 and 2010. France has just 50 megawatts of solar power capacity now.
Hydroelectric dams in France include EguzonHYPERLINK “http://en.wikipedia.org/wiki/Eguzon_dam” dam, ÉtangHYPERLINK “http://en.wikipedia.org/wiki/%C3%89tang_de_Soulcem” de HYPERLINK “http://en.wikipedia.org/wiki/%C3%89tang_de_Soulcem”Soulcem, and Lac de HYPERLINK “http://en.wikipedia.org/wiki/Lac_de_Vouglans”Vouglans.
On January 25, 2011, President Nicolas HYPERLINK “http://en.wikipedia.org/wiki/Nicolas_Sarkozy”Sarkozy confirmed the tendering process to build France’s first five offshore wind farms, expected to have a capacity of 3GW and to be sited off the Atlantic coast between Saint-Nazaire and Dieppe/Le HYPERLINK “http://en.wikipedia.org/wiki/Le_Tr%C3%A9port”Tréport. Tender documents were to be sent out on April 1, with the winning bid announced in early 2012. A second round of bidding to provide a further 3GW of capacity is expected in 2012.
1.7.1Tidal Energy in Developed Country
Canada
The harnessing of the tidal energy resource in the Minas Passage is one of the commitments the Government of Nova Scotia made in response to the Strategic Environmental Assessment for offshore renewable energy in the Bay of Fundy. The Fundy Tidal Institute has been established to facilitate the work of the three companies appointed by the Government of Nova Scotia, allowing them to test their respective technologies and to share costs, potential impact and testing conditions.
The province of New Brunswick which borders the landward side of the Bay of Fundy also conducted a Strategic Environmental Assessment of In-Stream Energy Generation Development during 2008. At the present time a tidal energy development policy is being considered.
Verdant Power of the USA has announced its Cornwall Ontario River Energy (CORE) scheme on the St Lawrence River. Phase 1 – Demonstration Pilot (2009-2010) will be followed by Phase 2 – Commercial Field Build-Out. The project could ultimately generate up to 15 MW of electricity.
France
It was announced during 2008 that EDF, the leading electricity producer in France, plans a pilot tidal turbine system off the coast of Brittany. The project, consisting of 4 to 10 turbines, with a total capacity of between 2 and 4 MW will be sited at Paimpol-Bréhat (Côtes d’Armor). In October 2008, EDF stated that the company had appointed Open Hydro of Ireland to equip the demonstration tidal farm, which is scheduled to be connected to the grid from 2011 onwards.
United Kingdom
The UK’s Energy Act 2008 became law in November 2008 and will implement the legislative aspects of the 2007 Energy White Paper: Meeting the Energy Challenge. In part, the Act will strengthen the Renewables Obligation to drive greater and more rapid deployment of renewable energy in the UK. In December 2008 a draft Renewables Obligation Order 2009 was published.
In October 2007 the Sustainable Development Commission (SDC), on behalf of the Government, published the results of a year-long study looking at the full range of tidal power technologies available. The Commission was charged with examining the sustainable use of the UK’s tidal resource, in particular how the power of the Severn Estuary, with its British and European legal conservation protection, could be used. It will be necessary for any ensuing development to first clear the hurdles of the many environmental concerns.
In late January 2009 the Government announced that it was halfway through a feasibility study looking at all aspects of a tidal plant in the Severn Estuary. After studying 10 possible schemes there will now be a three-month consultation period studying a short list of five proposals using a range of options: three using a barrage scheme and two, a lagoon.
2008 saw the first UK grid-connected 250 kW tidal turbines. In May, the Irish company Open Hydro began producing electricity for national consumption at its European Marine Energy Centre (EMEC) site off the southwestern coast of the island of Eday, Orkney. Later in the year, also at EMEC, Open Hydro installed the world’s first specialist barge for deployment of full-scale seabed-mounted tidal turbines.
Early in 2008, MCT joined in partnership with npower renewables to develop a tidal stream project under the management of a newly-created company, SeaGen Wales. The plan is for a 10.5 MW farm to be located in The Skerries, off the northwest coast of Anglesey. Evaluation of the site during 2008 is expected to be followed by an application for planning permission during 2009 and a completion date in 2011/2012. The electricity generated would feed into the national grid.
Another venture for MCT, announced in November 2008, is a tidal scheme for the Pentland Firth, Scotland. The company will apply for a lease from the Crown Estate and, subject to finance and gaining consent, plans a 50 MW plant by 2015.
United States of America
Phase 2 (2006-2008) of Verdant Power’s Roosevelt Island Tidal Energy Project (RITE) encountered some unexpected problems when both the first and second set of turbine blades were destroyed by the strong tides of New York City’s East River. In early September 2008, a third and stronger set of blades was installed. The project is presently being tested, and also monitored for its effect on fish and water birds. The electricity produced is being supplied to two consumers on Roosevelt Island. It is intended that Phase 3 (2009-2012) will represent commercial development.
Preliminary Permits have been obtained by ORPC (Ocean Renewable Power Company) from the Federal Energy Regulatory Commission (FERC) for proposed tidal energy projects in offshore waters in Maine (Western Passage or CobscookBay, near the mouth of the Bay of Fundy), Alaska (Cook Inlet, near Anchorage) and Florida (Florida Current or Gulf Stream off the east coast). It is planned that following demonstration and testing of pilot plants; prototype commercial-scale OCGen™ turbines will be installed.
1.8 Potential Solution for Bangladesh
1.8.1 Short Term Solutions
Shutting down of all the government owned urea plants. This the only immediate source of additional gas to be used for power generation. Most of these fertilizer factories use old fuel inefficient processes which already have outlived their effective economic life.
Going for long term agreements to import urea right now as international price of urea is low. The availability of urea must be assured but the price should be appropriate; a subsidy is possible but undesirable. At least the subsidy should be linked to the price of rice.
More Rental Power Plants need to be installed to overcome the short term power crisis.
Reducing system loss in the power sector should be a priority as a reduction of 1% system loss can save around 45 MW of power. The government should implement the merchant power policy immediately.
The government can set up some small coal fired power plants and can import coal from India on a temporary basis before developing our own coal mines.
Several large barge mounted power plants can be contracted on short term basis which can supply additional 600 MW by the end of the year. This will ease the power crisis for a few years while other fuel sources are developed and the required power plants constructed.
Captive power generation by the private sector is around 1800-2000 MW; 20-25% of this capacity remains unutilized which can be added to the national gridline. Provide incentive to the standby captive generators to run their machine without taking power from grid. The improvement of the gas pipelines and installation of compressors to increase pipeline pressure – should be implemented immediately.
Daylight energy saving. Changing the office timetable to 8 am – 2 pm can save more electricity for using in the evening peak hours. 350 MW at Dhaka and Chittagong can be saved daily .Using energy efficient appliances and immediate removal of taxes on them.
Importing Liquefied Natural Gas (LNG) from gas exporting countries like Indonesia, Qatar to meet urgent need.
1.8.2 Mid to Long Term Solution
Accelerate the exploration for gas. The recoverable proven remaining reserve of gas is will start depleting after 2012. The maritime boundary dispute with India and Myanmar was a major barrier to offshore gas exploration, and should be resolved as soon as possible.
Petrobangla and EMRD must do everything possible to support Bapex to make it a self reliant exploration company.
Install new urea plants that are more gas efficient. As coal fired power plants come on line in five years the gas can be sold to the urea factories enabling imports of urea to be curtailed.
Fast-track the development of Phulbari and other coal deposits and simultaneously build large-scale coal-fired power stations. Gradually remove coal imports (currently about 5 mill MT) and supply ultimately 18 MMT to the power plants [enough for 6000 MWs]. Contract for 3 coal fired power plants each for 1000 MWs in about 4-5 years. When these plants are available gas is switched to new efficient urea plants and peaking plants for the power sector and for direct industrial use.
Public private partnership should be highly encouraged. If needed, energy bond or levies should be charged to raise funds.
Government must encourage expansion of Solar, wind and bio fuel energy generation. Efforts to use solar power on tall buildings, factories, rural areas should be promoted with low cost loans while removing taxes on solar equipment. Full potential of mini micro hydro generation must also be explored. Energy from solid municipal waste in major cities can be possibility also.
Nuclear energy is a long term solution with huge cost involvement of billion dollar per 1000 MW plant, but essentially this would become a vital source with highest durability and low unit cost of production.
Many power plants set up in Ashuganj, Ghorashal, Shajibazar have outlived their effective economic life. Further investment in those will be waste of money and efforts. There has been considerable drainage of national resources in maintenance of some plants. These can be replaced with fuel efficient modern plants.
A more efficient and faster procurement and tendering process should be adopted for quicker implementation of any project.
Renewable energy is an ideal solution as it can provide grid less power and is totally clean in terms of pollution and health hazards. Such as solar and wind, it saves money on constructing electricity transmission lines, it’s economical as well. Little wonder that solar energy is becoming popular in Bangladesh.
CHAPTER 2
Renewable Energy
2.1 Introduction
Renewable energy (RE) resources are becoming increasingly important in the government’s thrust to reduce dependence on fossil fuels and harmful emissions that affect health and the environment. RE includes biomass, geothermal, hydro, wind, solar and ocean energy which can be converted into more useful energy like electricity. These sources of energy are renewable on a regular basis and their renewal rates are relatively rapid to consider their availability over an indefinite period of time. The utilization of RE contributes to the government’s strategy to attain a 60 percent self-sufficiency level for total primary energy by 2010. At present, geothermal, hydro and biomass resources provide a combined 42 percent share. On the other hand, wind, solar and micro-hydro resources are getting wide-scale use, particularly for electrification in remote areas.
2.2 Renewable Energy Source
Renewable energy sources are often considered alternative sources because, in general, most industrialized countries do not rely on them as their main energy source. Instead, they tend to rely on non-renewable sources such as fossil fuels or nuclear power. Because the energy crisis in the United States during the 1970s, dwindling supplies of fossil fuels and hazards associated with nuclear power, usage of renewable energy sources such as solar energy, hydroelectric, wind, biomass, and geothermal has grown. Renewable energy comes from the sun (considered an “unlimited” supply) or other sources that can theoretically be renewed at least as quickly as they are consumed. If used at a sustainable rate, these sources will be available for consumption for thousands of years or longer. Unfortunately, some potentially renewable energy sources, such as biomass and geothermal, are actually being depleted in some areas because the usage rate exceeds the renewal rate.
2.2.1 Soar Energy
Solar energy is the ultimate energy source driving the earth. Though only one billionth of the energy that leaves the sun actually reaches the earth’s surface, this is more than enough to meet the world’s energy requirements. In fact, all other sources of energy, renewable and non-renewable, are actually stored forms of solar energy. The process of directly converting solar energy to heat or electricity is considered a renewable energy source. Solar energy represents an essentially unlimited supply of energy as the sun will long outlast human civilization on earth. The difficulties lie in harnessing the energy. Solar energy has been used for centuries to heat homes and water, and modern technology (photovoltaic cells) has provided a way to produce electricity from sunlight.
2.2.2 Hydroelectric Energy
Hydroelectric power is generated by using the energy of flowing water to power generating turbines for producing electricity. Most hydroelectric power is generated by dams across large-flow Rivers. A dam built across river creates a reservoir behind it. The height of the water behind the dam is greater than that below the dam, representing stored potential energy. When water flows down through the penstock of the dam, driving the turbines, some of this potential energy is converted into electricity. Hydroelectric power, like other alternative sources, is clean and relatively cheap over the long term even with initial construction costs and upkeep. But because the river’s normal flow rate is reduced by the dam, sediments normally carried downstream by the water are instead deposited in the reservoir.
2.2.3 Wind Power
Wind is the result of the sun’s uneven heating of the atmosphere. Warm air expands rises and cool air contracts and sinks. This movement of the air is called wind. Wind has been used as an energy source for millennia. It has been used to pump water, to power ships, and to mill grains. Areas with constant and strong winds can be used by wind turbines to generate electricity. In the United States, the state of California has about 20,000 wind turbines, and produces the most wind-generated electricity. Wind energy does not produce air pollution, can be virtually limitless, and is relatively inexpensive to produce. There is an initial cost of manufacturing the wind turbine and the costs associated with upkeep and repairs, but the wind itself is free.
2.2.4 Biomass Energy
Biomass energy is the oldest energy source used by humans. Biomass is the organic matter that composes the tissues of plants and animals. Until the Industrial Revolution prompted a shift to fossil fuels in the mid 18th century, it was the world’s dominant fuel source. Biomass can be burned for heating and cooking, and even generating electricity. The most common source of biomass energy is from the burning of wood, but energy can also be generated by burning animal manure (dung), herbaceous plant material (non-wood), peat (partially decomposed plant and animal tissues), or converted biomass such as charcoal (wood that has been partially burned to produce a coal-like substance). Biomass can also be converted into a liquid bio-fuel such as ethanol or methanol. Currently, about 15 percent of the world’s energy comes from biomass. Biomass is a potentially renewable energy source.
2.2.5 Geothermal Energy
Geothermal energy uses heat from the earth’s internal geologic processes in order to produce electricity or provide heating. One source of geothermal energy is steam. Groundwater percolates down though cracks in the subsurface rocks until it reaches rocks heated by underlying magma, and the heat converts the water to steam. Sometimes this steam makes its way back to the surface in the form of a geyser or hot spring. Wells can be dug to tap the steam reservoir and bring it to the surface, to drive generating turbines and produce electricity. Hot water can be circulated to heat buildings. Regions near tectonic plate boundaries have the best potential for geothermal activity.
2.3 Renewable Energy Use
2.3.1 Strategy Developed to Use Renewable Energy
The ultimate goal of Cradle to Cradle® Design is to have all energy inputs come from what we term “current solar income”. Forms of current solar income include geothermal, wind, biomass, hydro (in certain circumstances to be determined on a case-by- case basis) and, of course, photovoltaic. Once the manufacturing/assembly energy has been quantified, applicant shall present a strategy to supply that energy via current solar income. The strategy should contain a timeline as well as measurable goals and milestones.
2.3.2 Use of Renewable Energy for Manufacture
Applicant shall demonstrate the strategy developed has been implemented. Percent of the energy required for manufacture/final assembly of the product must come from current solar income. For the purposes of this certification program, final manufacture/assembly is defined as the assembly of homogeneous materials or assemblies into the finished product. This occurs at the client’s facility or at a contract facility and is typically the last step before the product is sold to the customer. While the exact definition of “final manufacture/assembly” may vary from industry to industry, the idea is to have a consistent definition across each specific industry to “level the playing field” for those manufacturers that have different levels of vertical integration. This may be accomplished through the active use of energy sources derived from current solar income (as listed above) or through the purchase of Green-e certified renewable energy certificates to offset the energy used to manufacture/assemble the product. Examples of organizations offering Green-e certified renewable energy certificates include: Native Energy, Sterling Planet, Wind Current, Bonneville Environmental Foundation, 3 Phases Energy Services, Community Energy, Renewable Choice Energy, and EAD Environmental.
2.3.3 Use of Renewable Energy for Entire Product
Applicant shall demonstrate that at least fifty (50) percent of the energy required to manufacture the entire product (i.e. total energy footprint of the product, not including transportation) comes from current solar income. This includes not only the energy used to manufacture/assemble the final product, but the energy used to manufacture the components as well. In addition, the energy required for final manufacture/assembly must come entirely from current solar income.
2.4 Benefits of Renewable Energy Use
Renewable energy can supply a significant proportion of the United States’ energy needs, creating many public benefits for the nation and for states and regions, including environmental improvement, increased fuel diversity and national security, and regional economic development benefits.
Environmental Benefits
Using fossil fuels-coal, oil and natural gas-to make electricity dirties the nation’s air, consumes and pollutes water, hurts plants and animal life, creates toxic wastes, and causes global warming. Using nuclear fuels poses serious safety risks. Renewable energy resources can provide many immediate environmental benefits by avoiding these impacts and risks and can help conserve fossil resources for future generations. Of course, renewable energy also has environmental impacts. For example, biomass plants produce some emissions, and fuel can be harvested at unsustainable rates. Wind farms change the landscape, and some have harmed birds. Hydro projects, if their impacts are not mitigated, can greatly affect wildlife and ecosystems.
Air Pollution
Clean air is essential to life and good health. Air pollution aggravates asthma, the number one children’s health problem. Air pollution also causes disease and even premature death among vulnerable populations, including children, the elderly, and people with lung disease. A 1996 analysis by the Natural Resources Defense Council of studies by the American Cancer Society and HarvardMedicalSchool suggests that small particles in the air may be responsible for as many as 64,000 deaths each year from heart and lung disease. As the figure below shows, air pollution is responsible for more deaths than motor vehicle accidents, and ranks higher than many other serious health threats.
Water, Land, and Thermal Pollution
Energy production and use also have profound impacts on water and land. There are direct impacts, such as oil spills and coal mining, and indirect impacts from air emissions settling out on land and water. Land and water damage can occur throughout the life cycle of fossil fuels, from mining, drilling, and refining, to shipping, use, and disposal.
Coal mining contributes to land and water pollution. New mining practices sometimes level mountains. Toxic chemicals brought to the surface during the mining process can leach into water supplies. Railroad and barge transportation of coal releases coal dust and is vulnerable to accidents. Finally, after the coal is burned, ash is left as a waste product.
Drilling for oil and natural gas can also pollute the immediate environment. Oil spills kill plants and animals, often leaving waterways and the surrounding shores uninhabitable.
Fossil fuels produce heat energy when burned, some of which is used to generate electricity. Because the process is inefficient, about two-thirds of the heat is released to the atmosphere or to water used as a coolant. Heated water, once returned to rivers or lakes, can upset the aquatic ecosystem. And water intake, out-flow, and cooling systems can trap and kill fish and fish larvae.
Economic Benefits of Reducing Environmental Impacts
The many environmental impacts described above result in real costs to society and to individuals. When such costs are not included in energy prices, they are referred to as “externalities.” During the 1990s, efforts have been made to calculate the dollar costs of such externalities and, in some cases, to include them in energy planning decisions. In 1998, the Minnesota Supreme Court upheld a state law requiring that utility planning considers externalities.
The largest external costs from pollution are probably human health costs, in the form of health treatment costs, higher health insurance rates, missed work, and lost life. However, unless policies are adopted so that utility rates account for these societal and environmental costs, customers may ignore them when deregulation enables customers to choose their generating sources. Such policies might include pollution taxes
or placing total limits on each emission for the geographic area affected by the emission.
Even without considering externalities, both industry and individuals stand to gain from increased reliance on renewable energy. Because renewables produce little or no pollution, they can reduce regional pollution and thereby reduce the costs for neighboring industry to comply with environmental regulations.
Nuclear Risks
Although nuclear power plants avoid many of the air emissions associated with fossil fuel plants, they create unique environmental risks. A combination of human and mechanical error could result in an accident killing several thousand people, injuring several hundred thousand others, contaminating large areas of land, and costing billions of dollars. While the odds of such an accident are low, the Chernobyl accident in 1986 showed that they can occur.
In addition to safety issues, nuclear plants continue to be problematic because of their spent fuel rods and other radioactive waste. By 1995, US nuclear plants had produced almost 32,000 metric tons of high-level radioactive waste. Finding a way to keep this waste out of the environment for the thousands of years it remains radioactive has proven difficult. Problems such as groundwater contamination led to four of the six commercial facilities that store low-level radioactive waste being closed. And, despite years of research, the permanent repository the government hopes to build at YuccaMountain still has unresolved issues.
But regardless of the environmental issues, it is economics that is most hurting the nuclear industry. In 1998, about 40 percent of the nuclear plants in the United States were producing power at prices above the short-term market rate. A study by the Washington International Energy Group concludes that about 37 percent of the combined nuclear capacity of the United States and Canada could be retired as a result of competition. If fossil fuels are the only replacement option, early nuclear retirements will raise the cost for the country to comply with emission-reduction goals. Most of the planned increases in US natural gas capacity could be needed to replace these retiring nuclear plants, which means that little new capacity would be available to displace coal generation. Even if the nuclear plants were to operate until the end of their license periods, abundant low-emission replacement options would be needed. The availability of significant renewable generation could help to mitigate these nuclear-replacement problems, lowering the costs of regulatory compliance for industry as well as utilities and avoiding the risks inherent in nuclear power generation.
Other Nontraditional Benefits
Because some renewable technologies are small and modular, they can be sited in or near buildings where energy is used. These distributed generation technologies offer some benefits that utilities have usually not considered.
Perhaps most importantly, distributed generation technologies can avoid costly expenditures on transmission and distribution. For example, a utility putting distributed generation in a new neighborhood might be able to use smaller transformers or reduce the size or number of power lines going to the neighborhood. Distributed generation reduces the wear and tear on existing distribution equipment, thereby delaying the need to replace or upgrade the equipment. And distributed generation reduces power losses through the transmission system, so that less electricity needs to be produced in the first place.
2.5 Growth of Renewable Energy
Renewable energy accounted for approximately half of the estimated 194 GW of new electric capacity added globally during 2010. Existing renewable power capacity worldwide reached an estimated 1,320 GW in 2010, up almost 8% from 2009. Renewable capacity now comprises about a quarter of total global power generating capacity (estimated at 4,950 GW in 2010) and supplies close to 20% of global electricity, with most of this provided by hydropower. When hydropower is not included, renewables reached a total of 312 GW, a 25% increase over 2009 (250 GW). Among all renewables, global wind power capacity increased the most in 2010, by 39 GW .Hydropower capacity increased by about 30 GW during 2010 and solar PV capacity increased by almost 17 GW.
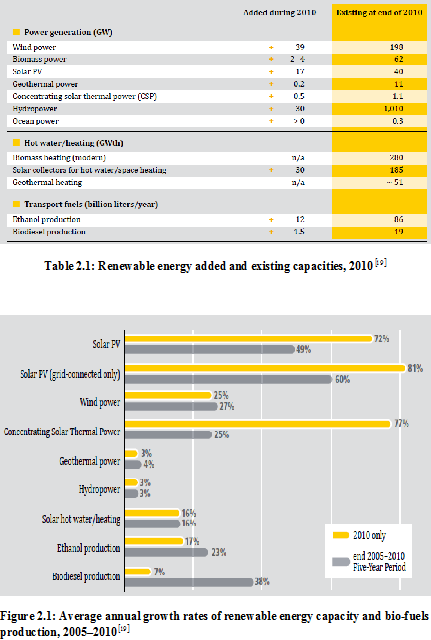
countries for non-hydro renewable power capacity were the United States, China, Germany, Spain, and India. Including hydropower, China, the United States, Canada, Brazil, and India tied with Germany, were the top countries for total installed renewable energy capacity by the end of 2010. Data are not readily available to provide a global ranking for categories such as increased share of electricity from renewables or per capita consumption, although these would be valuable measurements of progress.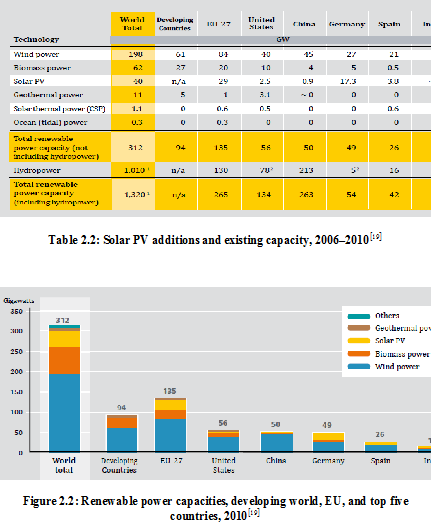
In the United States, renewable energy accounted for an estimated 25% of electric capacity additions in 2010 and 11.6% of existing electric capacity at year‘s end; during the year, renewables provided just over 10.3% of total domestic electricity. Further, renewables accounted for about 10.9% of U.S. domestic primary energy production (compared with nuclear 11.3% share), an increase of 5.6% relative to 2009. China led the world in the installation of wind turbines and solar thermal systems and was the top hydropower producer in 2010. The country added an estimated 29 GW of grid-connected renewable capacity, for a total of 263 GW, an increase of 12% compared with 2009.11 Renewables accounted for about 26% of China‘s total installed electric capacity in 2010, 18% of generation, and more than 9% of final energy consumption. In the European Union, renewables accounted for an estimated 41% of newly installed electric capacity in 2010, with PV accounting for more than half of the total. Although the share was significantly lower than the more than 60% of total capacity added in 2009, more renewable power capacity was added in Europe than ever before (22.6 GW), with total installations up 31% over the previous year (17.5 GW). Renewable energy‘s share of total electricity generation in the EU was nearly 20% in 2009 (42% of which was non-hydropower); the share of total gross inland energy consumption increased from 5.4% in 1999 to 9% in 2009. In 2010, Germany met 11% of its total final energy consumption with renewable sources, which accounted for 16.8% of electricity consumption, 9.8% of heat production (mostly from biomass), and 5.8% of transport fuel consumption. The share of electricity generation from renewables was up from 16.3% in 2009, despite a 4.3% increase in Germany‘s total electricity consumption in 2010. Wind power (102 terawatt-hours, TWh) accounted for nearly 36% of renewable generation, followed by biomass, hydropower, and PV. In Spain, renewables accounted for 13.2% of final energy production and generated 32.3% of electricity, up from 9.3% and 26%, respectively, in 2009. India added an estimated 2.7 GW of grid-connected renewable power capacity during 2010 – mainly from wind but also from biomass, small hydropower, and solar capacity – for a total of nearly 19 GW by January 2011. Significant off-grid renewable capacity was added as well. Large hydropower generated about one-quarter of India‘s electricity in 2010, with other renewables accounting for just over 4% of generation.
CHAPTER 3
Hybrid System
3.1 Hybrid System
Hybrid power systems are designed for the generation of electrical power. They are generally independent of large centralized electric grids and are used in remote areas. Hybrid systems by definition contain a number of power generation devices such as wind turbines, photovoltaic, micro-hydro and/or fossil fuel generators. Hybrid power systems range from small systems designed for one or several homes to very large ones for remote island grids or large communities.
Hybrid power systems are seen as a way to provide power to the many remote communities in the developing world where the costs for large scale expansion of electrical grids are prohibitive and the transportation costs of diesel fuel are also very high.
The use of renewable power generation systems reduces the use of expensive fuels, allows for the cleaner generation of electrical power and also improves the standard of living for many people in remote areas.
Technological Configurations for Hybrid Systems
A typical hybrid system combines two or more energy sources, from renewable energy technologies, such as photovoltaic panels, wind or small hydro turbines; and from conventional technologies, usually diesel or LPG gensets (though biomass fed gensets are also a feasible option, if locally available). In addition, it includes power electronics and electricity storage batteries. The hybrid system can be designed following different configurations to effectively use the locally available renewable energy sources and to serve ALL power appliances (requiring DC or AC electricity).The technological configurations can be classified according to the voltage they are coupled with; this is, using DC, AC and mixed (DC and AC) bus lines.
Example of load profile: village electrification
Hybrid systems with a backup genset run with minimal fuel consumption because the genset is brought on line only to assist in periods of high loads or low renewable power availability. This results in a large reduction in fuel consumption as compared to a genset only powered system.
3.2 Solar Photovoltaic
3.2.1 Historical Background
The term “photovoltaic” comes from the Greek φῶς (phōs) meaning “light”, and “voltaic”, from the name of the Italian physicist Volta, after whom a unit of electro-motive force, the volt, is named. The term “photo-voltaic” has been in use in English since 1849.
The photovoltaic effect was first recognized in 1839 by French physicist A. E. Becquerel. However, it was not until 1883 that the first photovoltaic cell was built, by Charles Fritts, who coated the semiconductor selenium with an extremely thin layer of gold to form the junctions. The device was only around 1% efficient. In 1888 Russian physicist Aleksandr Stoletov built the first photoelectric cell based on the outer photoelectric effect discovered by Heinrich Hertz earlier in 1887.
Albert Einstein explained the photoelectric effect in 1905 for which he received the Nobel Prize in Physics in 1921. Russell Ohl patented the modern junction semiconductor solar cell in 1946, which was discovered while working on the series of advances that would lead to the transistor.
3.2.2 First Practical Cell
The modern photovoltaic cell was developed in 1954 at Bell Laboratories. The highly efficient solar cell was first developed by Daryl Chapin, Calvin Souther Fuller and Gerald Pearson in 1954 using a diffused silicon p-n junction. At first, cells were developed for toys and other minor uses, as the cost of the electricity they produced was very high; in relative terms, a cell that produced 1 watt of electrical power in bright sunlight cost about $250, comparing to $2 to $3 for a coal plant.
Solar cells were rescued from obscurity by the suggestion to add them to the Vanguard I satellite, launched in 1958. In the original plans, the satellite would be powered only by battery, and last a short time while this ran down. By adding cells to the outside of the body, the mission time could be extended with no major changes to the spacecraft or its power systems. There was some skepticism at first, but in practice the cells proved to be a huge success, and solar cells were quickly designed into many new satellites, notably Bell’s own Telstra.
Improvements were slow over the next two decades, and the only widespread use was in space applications where their power-to-weight ratio was higher than any competing technology. However, this success was also the reason for slow progress; space users were willing to pay anything for the best possible cells, there was no reason to invest in lower-cost solutions if this would reduce efficiency. Instead, the price of cells was determined largely by the semiconductor industry; their move to integrated circuits in the 1960s led to the availability of larger boules at lower relative prices. As their price fell, the price of the resulting cells did as well. However these effects were limited, and by 1971 cell costs were estimated to be $100 per watt.
3.2.3 Berman’s Price Reductions
In the late 1960s, Elliot Berman was investigating a new method for producing the silicon feedstock in a ribbon process. However, he found little interest in the project and was unable to gain the funding needed to develop it. In a chance encounter, he was later introduced to a team at Exxon who were looking for projects 30 years in the future. The group had concluded that electrical power would be much more expensive by 2000, and felt that this increase in price would make new alternative energy sources more attractive, and solar was the most interesting among these. In 1969, Berman joined the Linden, New Jersey Exxon lab, Solar Power Corporation (SPC).
His first major effort was to canvas the potential market to see what possible uses for a new product were, and they quickly found that if the price per watt were reduced from then-current $100/watt to about $20/watt there would be significant demand. Knowing that his ribbon concept would take years to develop, the team started looking for ways to hit the $20 price point using existing materials.
The first improvement was the realization that the existing cells were based on standard semiconductor manufacturing process, even though that was not ideal. This started with the boucle, cutting it into disks called wafers, polishing the wafers, and then, for cell use, coating them with an anti-reflective layer. Berman noted that the rough-sawn wafers already had a perfectly suitable anti-reflective front surface, and by printing the electrodes directly on this surface, two major steps in the cell processing were eliminated. The team also explored ways to improve the mounting of the cells into arrays, eliminating the expensive materials and hand wiring used in space applications. Their solution was to use a printed circuit board on the back, acrylic plastic on the front, and silicone glue between the two, potting the cells. The largest improvement in price point was Berman’s realization that existing silicon was effectively “too good” for solar cell use; the minor imperfections that would ruin a boucle (or individual wafer) for electronics would have little effect in the solar application. Solar cells could be made using cast-off material from the electronics market.
Putting all of these changes into practice, the company started buying up “reject” silicon from existing manufacturers at very low cost. By using the largest wafers available, thereby reducing the amount of wiring for a given panel area, and packaging them into panels using their new methods, by 1973 SPC was producing panels at $10 per watt and selling them at $20 per watt, a fivefold decrease in prices in two years.
3.3 How PV Cell Work
A typical silicon PV cell is composed of a thin wafer consisting of an ultra-thin layer of phosphorus-doped (N-type) silicon on top of a thicker layer of boron-doped (P-type) silicon. An electrical field is created near the top surface of the cell where these two materials are in contact, called the P-N junction. When sunlight strikes the surface of a PV cell, this electrical field provides momentum and direction to light-stimulated electrons, resulting in a flow of current when the solar cell is connected to an electrical load
Regardless of size, a typical silicon PV cell produces about 0.5 – 0.6 volt DC under open-circuit, no-load conditions. The current (and power) output of a PV cell depends on its efficiency and size (surface area), and is proportional to the intensity of sunlight striking the surface of the cell. For example, under peak sunlight conditions, a typical commercial PV cell with a surface area of 160 cm^2 (~25 in^2) will produce about 2 watts peak power. If the sunlight intensity were 40 percent of peak, this cell would produce about 0.8 watts.
A number of solar cells electrically connected to each other and mounted in a support structure or frame is called a photovoltaic module. Modules are designed to supply electricity at a certain voltage, such as a common 12 volts system. The current produced is directly dependent on how much light strikes the module.
Multiple modules can be wired together to form an array. In general, the larger the area of a module or array, the more electricity that will be produced. Photovoltaic modules and arrays produce direct-current (dc) electricity. They can be connected in both series and parallel electrical arrangements to produce any required voltage and current combination.
Today’s most common PV devices use a single junction, or interface, to create an electric field within a semiconductor such as a PV cell. In a single-junction PV cell, only photons whose energy is equal to or greater than the band gap of the cell material can free an electron for an electric circuit. In other words, the photovoltaic response of single-junction cells is limited to the portion of the sun’s spectrum whose energy is above the band gap of the absorbing material, and lower-energy photons are not used.
One way to get around this limitation is to use two (or more) different cells, with more than one band gap and more than one junction, to generate a voltage. These are referred to as “multijunction” cells (also called “cascade” or “tandem” cells). Multijunction devices can achieve higher total conversion efficiency because they can convert more of the energy spectrum of light to electricity.
As shown below, a multijunction device is a stack of individual single-junction cells in descending order of band gap (Eg). The top cell captures the high-energy photons and passes the rest of the photons on to be absorbed by lower-band-gap cells.
Much of today’s research in multijunction cells focuses on gallium arsenide as one (or all) of the component cells. Such cells have reached efficiencies of around 35% under concentrated sunlight. Other materials studied for multijunction devices have been amorphous silicon and copper indium diselenide.
As an example, the multijunction device below uses a top cell of gallium indium phosphide, “a tunnel junction,” to aid the flow of electrons between the cells, and a bottom cell of gallium arsenide.
3.4 Mathematical Model of PV Cell
3.4.1 Simple PV Module
A simple PV cell is essentially an ideal current source in parallel with a diode. The current source represents the current generated by the PV cell due to photons received by it, and is constant under constant irradiance and temperature. The two key parameters most often used to characterize a PV cell are its short-circuit current and its open circuit voltage. Generally, these values are provided on the manufacturer’s datasheet.
From the equivalent circuit, the output current from the simple PV cell can be found by the following equation.
I=I–I … … (1)
Where I is the light generated current or short circuit current that is equal to the photon generated current, and I is the current shunted through the intrinsic diode. The current through the diode can be represented by the Shockley’s diode equation.
… … (2)
Therefore, equation (1) can be written as,
… … (3)
Where q is the charge of an electron (Joule), k is the Boltzman constant (Joule/ K), is the cell temperature (K), I is the diode reverse saturation current (Ampere), R is the cell series resistance, R is the cell shunt resistance, and V is cell output voltage (volts).
3.4.2 More Accurate Model
We can assume a more accurate model by the equivalent circuit of figure below. The simple PV cell model neglects to account for a few things. In order to create a more accurate model, series resistance, parallel resistance, and recombination must be factored into the simple PV cell equation. Series resistance accounts for any resistance in the current path through the semiconductor materials, metal grid, and current collecting bus. The value of the series resistance is multiplied by the number of series connected cells. Parallel resistance or shunt resistance is a loss component with a slight leakage current through a parallel resistive path to the device. It is not as significant as series resistance because the effects are minimal unless a number of PV modules are connected in parallel for a large system.
From the equivalent circuit it is evident that the current produced by the solar cell is equal to that produced by the current source, minus that which flows through the diode, minus that which flows through the shunt resistor.
I=I- I-I … … … (4)
Where,
I= … … … (5)
Therefore the equation (4) can be written as,
I=I-I{exp[]-1}- … … (6)
Where,
I = reverse saturation current (amperes)
n = diode ideality factor (1 for an ideal diode)
q = elementary charge
k = Boltzmann’s constant
T = absolute temperature
I= output current (amperes)
I= photo generated current (amperes)
V= voltage across the output terminal (volts)
R= series resistance (Ω)
R= shunt resistance (Ω)
Recombination in the depletion region PV cells provides a non-resistive current path in parallel with the intrinsic PV cell, and can be represented by a second diode in the equivalent circuit.
Taking into account the additional element, the equation (6) becomes,
I=I-I(e-1)-I(e-1)- … … (7)
The two diodes can be combined to simplify the equation is,
I=I-I(e-1)-
Where, I=I+I
& η is known as identity factor and takes a value between one and two. Since a single PV cell produces an output voltage less than 1 volt, it is necessary to string together a number of PV cells in series to achieve a desired output voltage. Generally, 36 cells in series will provide a large enough voltage to charge a 12-volt battery, and 72 cells would be suitable for a 24 volt battery. However, voltage can be adjusted with a dc/dc converter so that either type of battery can be charged.
In the similar way, the equivalent circuit of a PV cell is consists of three diodes is given by:
Taking into account the additional element, the equation (7) becomes,
I=I-I(e-1)-I(e-1)-I(e-1)-
The three diodes can be combined to simplify the equation is,
I=I-I(e-1)-
3.4.3 Typical Characteristics
I-V curve of an illuminated PV cell has the shape shown in Figure 3.8 as the voltage across the measuring load is swept from zero to V, and many performance parameters for the cell can be determined from this data, as described in the sections below.
3.4.4 Short Circuit Current (I)
The short circuit current I corresponds to the short circuit condition when the impedance is low and is calculated when the voltage equals 0.
I (at V=0) = I
I occur at the beginning of the forward-bias sweep and I the maximum current value in the power quadrant. For an ideal cell, this maximum current value is the total current produced in the solar cell by photon excitation.
I = I = I for forward-bias power quadrant
3.4.5 Open Circuit Voltage (V)
The open circuit voltage (V) occurs when there is no current passing through the cell.
V (at I=0) = V
V is also the maximum voltage difference across the cell for a forward-bias sweep in the power quadrant.
V= V for forward-bias power quadrant
3.4.6 Maximum Power (P), Current at P (I), Voltage at P (V)
The power produced by the cell in Watts can be easily calculated along the I-V sweep by the equation P=IV. At I and V points, the power will be zero and the maximum value for power will occur between the two. The voltage and current at this maximum power point are denoted as V and I respectively.
3.4.7 Fill Factor (FF)
The Fill factor (FF) is essentially a measure of quality of the solar cell. It is calculated by comparing the maximum power to the theoretical power (P) that would be output at both the open circuit voltage and short circuit current together. FF can also be interpreted graphically as the ratio of the rectangular areas depicted in Figure 3.10.
A larger fill factor is desirable, and corresponds to an I-V sweep that is more square-like. Typical fill factors range from 0.5 to 0.82. Fill factor is also often represented as a percentage.
3.4.8 Efficiency (η)
Efficiency is the ratio of the electrical power output P, compared to the solar power input, P, into the PV cell. P can be taken to be P since the solar cell can be operated up to its maximum power output to get the maximum efficiency.
P is taken as the product of the irradiance of the incident light, measured in W/ m or in suns (1000 W/ m), with the surface area of the solar cell [m]. The maximum efficiency (η) found from a light test is not only an indication of the performance of the device under test, but, like all of the I-V parameters, can also be affected by ambient conditions such as temperature and the intensity and spectrum of the incident light. For this reason, it is recommended to test and compare PV cells using similar lighting and temperature conditions.
3.4.9 Shunt Resistance (R) and Series Resistance (R)
During operation, the efficiency of solar cells is reduced by the dissipation of power across internal resistances. These parasitic resistances can be modeled as a parallel shunt resistance (R) and series resistance (R), as depicted in Figure 3.4.
For an ideal cell, R would be infinite and would not provide an alternate path for current to flow, while R would be zero, resulting in no further voltage drop before the load.
Decreasing R and increasing R will decrease the fill factor (FF) and P as shown in Figure 3.8. If R is decreased too much, V will drop, while increasing R excessively can cause I to drop instead.
It is possible to approximate the series and shunt resistances, R and R, from the slopes of the I-V curve at Vand I, respectively. The resistance at V, however, is at best proportional to the series resistance but it is larger than the series resistance. R is represented by the slope at I. Typically, the resistances at I and at V will be measured and noted, as shown in Figure 3.9.
l, the I-V curve shown in Figure 3.10 can be obtained. This I-V curve is simply a reflection of the-No Light curve from Figure 1 about the V-axis. The slope of the linear region of the curve in the third quadrant (reverse-bias) is a continuation of the linear region in the first quadrant, which is the same linear region used to calculate R in Figure 3.9. It follows that R can be derived from the I-V plot obtained with or without providing light excitation, even when power is sourced to the cell. It is important to note, however, that for real cells, these resistances are often a function of the light level, and can differ in value between the light and dark tests.
3.4.10 Temperature Measurement Considerations
The crystals used to make PV cells, like all semiconductors, are sensitive to temperature. Figure 3.11 depicts the effect of temperature on an I-V curve. When a PV cell is exposed to higher temperatures, I increase slightly, while V decreases more significantly.
For a specified set of ambient conditions, higher temperatures result in a decrease in the maximum power output P. Since the I-V curve will vary according to temperature, it is beneficial to record the conditions under which the I-V sweep was conducted. Temperature can be measured using sensors such as RTDs, thermistors or thermocouples.
3.4.11 I-V Curves for Modules
For a module or array of PV cells, the shape of the I-V curve does not change. However, it is scaled based on the number of cells connected in series and in parallel. When n is the number of cells connected in series and m is the number of cells connected in parallel and I and V are values for individual cells, the I-V curve shown in Figure 3.12 is produced.
3.5 Effectiveness of Solar Energy in Hybrid System
The major benefit of solar is avoiding green house gases that fossil fuels produce. The first and foremost advantage of solar energy is that it does not emit any green house gases.
3.5.1 Infinite Free Energy
Another advantage of using solar energy is that beyond initial installation and maintenance, solar energy is one hundred percent free.
Solar doesn’t require expensive and ongoing raw materials like oil or coal, and requires significantly lower operational labor than conventional power production.
Lower costs are direct as well as indirect–less staff working at the power plant as the sun and the solar semi conductors do all the work, as well as no raw materials that have to be extracted, refined, and transported to the power plant.
3.5.2 Decentralization of Power
Solar energy offers decentralization in most (sunny) locations, meaning self-reliant societies.
Oil, coal, and gas used to produce conventional electricity is often transported cross-country or internationally. This transportation has a myriad of additional costs, including monetary costs, pollution costs of transport, and roading wear and tear costs, all of which is avoided with solar.
Of course, decentralization has its limits as some locations get more sunlight than others.
Example of solar energy
3.5.3 Solar Jobs
A particularly relevant and advantageous feature of solar energy production is that it creates jobs.
The EIAA states that Europe’s solar industry has created 100,000 jobs so far.
Solar jobs come in many forms, from manufacturing, installing, monitoring and maintaining solar panels, to research and design, development, cultural integration, and policy jobs.
The book Natural Capitalism has a very appropriate view of the employment benefits of green design and a prudent approach to using resources.
The book proposes that while green technology and increased employment cost alot of money, much greater money can be saved through simple but drastically improved resource efficiency.
With solar energy currently contributing only an estimated 4% of the world’s electricity, and an economic-model where raw materials don’t have to be indefinitely purchased and transported, it’s reasonable so assume solar jobs are sustainable if the solar industry can survive the recession.
3.5.4 Saving Eco-systems and Livelihoods
Because solar doesn’t rely on constantly mining raw materials, it doesn’t result in the destruction of forests and eco-systems that occurs with most fossil fuel operations. Destruction can come in many forms, from destruction through accepted extraction methods, to more irresponsible practices in vulnerable areas, to accidents. Major examples include Canada’s tar sands mining which involves the systematic destruction of the Boreal Forest (which accounts for 25% of the world’s intact forest land), and creates toxic by-product ponds large enough to see from space .The Niger Delta is an example where excessive and irresponsible oil extraction practices have poisoned fishing deltas previously used by villagers as the main source of food and employment, creating extremely desperate poverty and essentially decimating villages. A more widely known, but arguably lower human-cost incident is the 2010 BP oil spill in the Gulf of Mexico. It killed 11 people and spilled 780 thousand cubic meters of crude oil into the sea.
3.5.5 The Best is Yet to Come
Solar technology is currently improving in leaps and bounds. Across the world, and particularly in Europe, savvy clean technology researchers are making enormous developments in solar technology. What was expensive, bulky, and inefficient yesterday is becoming cheaper, more accessible, and vastly more efficient each week.
3.6 Wind Turbine\
A wind turbine is a device that converts kinetic energy from the wind into mechanical energy. If the mechanical energy is used to produce electricity, the device may be called a wind generator or wind charger. Wind turbines are designed to exploit the wind energy that exists at a location. Aerodynamic HYPERLINK “http://en.wikipedia.org/wiki/Wind_turbine_aerodynamics”modeling is used to determine the optimum tower height, control systems, number of blades and blade shape. Wind turbines convert wind energy to electricity for distribution.
Horizontal-axis wind turbines (HAWT) have the main rotor shaft and electrical generator at the top of a tower, and must be pointed into the wind. Small turbines are pointed by a simple wind vane, while large turbines generally use a wind sensor coupled with a servo motor. Most have a gearbox, which turns the slow rotation of the blades into a quicker rotation that is more suitable to drive an electrical generator.
Conventional horizontal axis turbines can be divided into three components:
- The rotor component, which is approximately 20% of the wind turbine cost, includes the blades for converting wind energy to low speed rotational energy.
- The generator component, which is approximately 34% of the wind turbine cost, includes the electrical generator, the control electronics, and most likely a gearbox (e.g. planetary gearbox, adjustable-speed drive or continuously) component for converting the low speed incoming rotation to high speed rotation suitable for generating electricity.
- The structural support component, which is approximately 15% of the wind turbine cost, includes the tower and rotor yaw mechanism.
3.7 The History of Wind Energy
As early as 5000 B.C. people traveled along the NileRiver with boats propelled by wind energy. By 200 B.C., water was being pumped by simple windmills in China, while grain was being grinded by vertical-axis windmills with woven reed sails in Persia and the Middle East. Windmills were being used extensively in the Middle East for food production by the 11th century, which then influenced merchants and crusaders to carry this idea back to Europe.
The Dutch adapted a new method of the windmill and used it to drain lakes and marshes in the Rhine River Delta. In the late 19th century, this technology was brought to the New World by settlers who then pumped water to farms and ranches and later generated electricity for homes and industry. In Europe and later in America, industrialization led a steady decline in the use of windmills. However, it also sparked the development of larger windmills in order to generate electricity. These windmills became known as wind turbines which appeared in Denmark as early as 1890.
Popularity of wind energy usage has always fluctuated with the price of fossil fuels. Interest in wind turbines waned after World War II when fuel prices fell. But by the 1970s, when price of oil escalated, the interest in wind turbine generators rose proportionately. For many years to come, the fastest growing energy source of wind energy will power industry, business and homes with clean renewable electricity.
While the wind industry grew substantially from the early 2000’s on, it suffered from a bout of boom-and-bust cycles due to the on-again, off-again nature of federal tax incentives. In 2006, a period of uninterrupted federal support for wind began, which has led to several years of record growth.
Installed capacity of wind power in the UK reaches 2gW, with the opening of the Braes O’Doune wind farm, in Scotland, which produces 72mW of power. The UKannounced plans for thousands of new offshore wind turbines which could power every home in Britain by 2020.
The EU sets the UK government a target to increase the contribution of renewables to UK electricity to 20% by 2020 as part of efforts to dramatically reduce greenhouse gas emissions and enhance energy security.
There are currently 186 operational wind farms in the UK (both onshore and offshore) with 2,120 turbines creating enough energy to power the equivalent of 1,523,052 homes and saving 6,156,175 tones of carbon. There are 42 in construction, with a further 134 consented and 268 in planning.
In other parts of the world, particularly in Europe, wind has had more consistent, long-term support. As a result, European countries are currently capable of meeting more of their electricity demands through wind power with much less land area and resource potential compared with the United States. Denmark, for example, already meets about 20 percent of its electricity demand from wind power. Wind generation also accounts for about 13 percent of the national power needs in Spain, and 8 percent in Germany. Serious commitments to reducing global warming emissions, local development, and the determination to avoid fuel imports have been the primary drivers of wind power development in Europe.
3.7.1 How Wind Energy Works
Wind is a form of solar energy. It is caused by the uneven heating of the irregularities of the earth’s surface, and rotation of the earth.
Modern wind turbines work much like traditional windmills. The wind turns the blades, which spin a shaft connected to a generator that makes electricity. Turbines start generating electricity when wind speeds reach 7-8 miles per hour.
The electricity is sent through transmission and distribution lines to consumers. It is no coincidence that wind farms are often built near existing power stations—such as the Kincaid Power Station—where the necessary infrastructure to deliver the electricity to consumers already exists.
Wind turbines are safe, have no impact on livestock, do not create excess levels of noise and are compatible with an agricultural community. Crops can be planted to within a few feet of the base of the turbine and animals may graze there.
3.8 Considerations for Building Wind Power Plant
There are few considerations which should be taken care of while developing wind power plant.
- To produce more electricity, increased number wind turbines are required in wind farm.
- Bigger blade size can also help in increasing the electricity generation capacity; therefore always choose to have bigger blades.
- Only those places are suitable for building up wind power plants where strong and steady winds are present in most of the time in a day, remember more wind cross through propellers, more rotation it will take hence produce more electricity.
- Coastal areas, higher areas, top of the mountain are best areas for developing wind power plant as it will encounter more wind at such altitudes.
- To receive satisfactory performance from wind power plants it should be located where it face about minimum of 25 Km/p wind speed. This speed has shown reliability in past projects. Lower wind speed can also provide electricity how ever performance with consistency may suffer.
- Caravans, and boats can also install small wind power generators to keep their batteries power alive.
- Grid should not be build far from wind far, as this will increase costs of wire to provide electricity produced by wind grid station. Keep wind plant closer to grid station for cost effectiveness.
3.9 Types of Wind Turbines and Associated Advantages
Wind is caused by uneven heating of the earth from the sun making wind a renewable and free source of energy. Wind turbines are an alternate source of energy that harnesses this renewable wind power to make electricity. Since wind turbines run solely on wind, they cause no pollution making them environmentally friendly. Basically, wind turns blades that are connected to a generator; the generator then makes electricity (more on this later). There are two main types of wind turbines, horizontal and vertical axis. A wind turbine applicable for urban settings was also studied. All three types of wind turbines have varying designs, and different advantages and disadvantages.
3.9.1 Horizontal Axis
Horizontal-axis wind turbines (HAWT) have the main rotor shaft and electrical generator at the top of a tower, and are usually pointed into the wind. Most small turbines are pointed by a simple wind vane, although there are now a number of more modern designs which are classed as down wind machines and which require no tail vane. Large turbines generally use a wind sensor coupled with a servo motor. Most have a gearbox, which turns the slow rotation of the blades into a quicker rotation that is more suitable to drive an electrical generator.
Since a tower produces turbulence behind it, the turbine is usually pointed upwind of the tower. Turbine blades are made stiff to prevent the blades from being pushed into the tower by high winds. Additionally, the blades are placed a considerable distance in front of the tower and are sometimes tilted up a small amount.
Figure 3.19: Horizontal Axis
Downwind machines have been built, despite the problem of turbulence (mast wake), because they don’t need an additional mechanism to keep them in line with the wind, and because in high winds the blades can be allowed to bend which reduces their swept area and thus their wind resistance. Since cyclic (that is repetitive) turbulence may lead to fatigue failures most large HAWTs are upwind machines.
3.9.2 HAWT Subtypes
12th century windmills
These squat structures, typically (at least) four bladed, usually with wooden shutters or fabric sails, were developed in Europe. These windmills were pointed into the wind manually or via a tail-fan and were typically used to grind grain. In the Netherlands they were also used to pump water from low-lying land, and were instrumental in keeping its polders dry.
In Schiedam, the Netherlands, a traditional style windmill (the Noletmolen) was built in 2005 to generate electricity. The mill is one of the tallest Tower mills in the world, being some 42.5 meters (139 ft) tall.
19th century windmills
The Eclipse windmill factory was set up around 1866 inBeloit, Wisconsin and soon became successful building mills for pumping water on farms and for filling railroad tanks. Other firms like Star, Dempster, and Aeromotor also entered the market. Hundreds of thousands of these mills were produced before rural electrification and small numbers continue to be made. They typically had many blades, operated at tip speed ratios not better than one, and had good starting torque. Some had small direct-current generators used to charge storage batteries, to provide power to lights, or to operate a radio receiver. The American rural electrification connected many farms to centrally-generated power and replaced individual windmills as a primary source of farm power by the 1950s. They were also produced in other countries like South Africa and Australia (where an American design was copied in 1876). Such devices are still used in locations where it is too costly to bring in commercial power.
3.9.3 Modern Wind Turbines
Turbines used in wind farms for commercial production of electric power are usually three-bladed and pointed into the wind by computer-controlled motors. These have high tip speeds of up to six times the wind speed, high efficiency, and low torque ripple, which contribute to good reliability. The blades are usually colored light gray to blend in with the clouds and range in length from 20 to 40 meters (65 to 130 ft) or more. The tubular steel towers range from 200 to 300 feet (60 to 90 meters) tall. The blades rotate at 10-22 revolutions per minute. A gear box is commonly used to step up the speed of the generator, although designs may also use direct drive of an annular generator. Some models operate at constant speed, but more energy can be collected by variable-speed turbines which use a solid-state power converter to interface to the transmission system.
All turbines are equipped with control systems. These systems employ anemometers and wind vanes to determine wind speed and direction. Based on this information, the turbine yaw drive will turn the blade face into the wind, and the blade pitch can be altered to maximize output. In very high wind speed conditions, the control system will shut the turbine down to avoid damage.
Advantages
• Blades are to the side of the turbines center of gravity, helping stability
• Ability to wing warp, which gives the turbine blades the best angle of attack
• Ability to pitch the rotor blades in a storm to minimize damage
• Tall tower allows access to stronger wind in sites with wind shear
• Tall tower allows placement on uneven land or in offshore locations
• Can be sited in forest above tree-line
• Most are self-starting
Disadvantages
• Difficulty operating in near ground winds
• Difficult to transport (20% of equipment costs)
• Difficult to install (require tall cranes and skilled operators)
• Effect radar in proximity
• Local opposition to aesthetics
• Difficult maintenance
3.9.4 Vertical Axis
Vertical axis wind turbines, as shortened to VAWTs, have the main rotor shaft arranged vertically. The main advantage of this arrangement is that the wind turbine does not need to be pointed into the wind. This is an advantage on sites where the wind direction is highly variable or has turbulent winds.
With a vertical axis, the generator and other primary components can be placed near the ground, so the tower does not need to support it, also makes maintenance easier. The main drawback of a VAWT generally creates drag when rotating into the wind.
Figure 3.20: Vertical-axis
It is difficult to mount vertical-axis turbines on towers, meaning they are often installed nearer to the base on which they rest, such as the ground or a building rooftop. The wind speed is slower at a lower altitude, so less wind energy is available for a given size turbine. Air flow near the ground and other objects can create turbulent flow, which can introduce issues of vibration, including noise and bearing wear which may increase the maintenance or shorten its service life. However, when a turbine is mounted on a rooftop, the building generally redirects wind over the roof and this cans double the wind speed at the turbine. If the height of the rooftop mounted turbine tower is approximately 50% of the building height, this is near the optimum for maximum wind energy and minimum wind turbulence.
3.9.5 VAWT Subtypes
Darrieus wind turbine
Darrieus wind turbines are commonly called “Eggbeater” turbines, because they look like a giant eggbeater. They have good efficiency, but produce large torque ripple and cyclic stress on the tower, which contributes to poor reliability. Also, they generally require some external power source, or an additional Savonius rotor, to start turning, because the starting torque is very low. The torque ripple is reduced by using three or more blades which results in a higher solidity for the rotor. Solidity is measured by blade area over the rotor area. Newer Darrieus type turbines are not held up by guy-wires but have an external superstructure connected to the top bearing.
Giromill
A subtype of Darrieus turbine with straight, as opposed to curved, blades. The cycloturbine variety has variable pitch to reduce the torque pulsation and is self-starting. The advantages of variable pitch are: high starting torque; a wide, relatively flat torque curve; a lower blade speed ratio; a higher coefficient of performance; more efficient operation in turbulent winds; and a lower blade speed ratio which lowers blade bending stresses. Straight, V, or curved blades may be used.
Savonius wind Turbine
These are drag-type devices with two (or more) scoops that are used in anemometers, Flettner vents (commonly seen on bus and van roofs), and in some high-reliability low-efficiency power turbines. They are always self-starting if there are at least three scoops. They sometimes have long helical scoops to give a smooth torque.
VAWT Advantages
- No yaw mechanisms is needed.
- A VAWT can be located nearer the ground, making it easier to maintain the moving parts.
- VAWTs have lower wind startup speeds than the typical the HAWTs.
- VAWTs may be built at locations where taller structures are prohibited.
- VAWTs situated close to the ground can take advantage of locations where rooftops, mesas, hilltops, ridgelines, and passes funnel the wind and increase wind velocity.
VAWT Disadvantages
- Most VAWTs have a average decreased efficiency from a common HAWT, mainly because of the additional drag that they have as their blades rotate into the wind. Versions that reduce drag produce more energy, especially those that funnel wind into the collector area.
- Having rotors located close to the grounds where wind speeds are lower due and do not take advantage of higher wind speeds above.
- Because VAWTs are not commonly deployed due mainly to the serious disadvantages mentioned above, they appear novel to those not familiar with the wind industry. This has often made them the subject of wild claims and investment scams over the last 50 years.
3.10 Wind Turbine Construction and Parameter Measurement
3.10.1 Blades
The rotor takes the wind and aerodynamically converts its energy into mechanical energy through a connected shaft. The rotor consists of blades which vary from turbine to turbine with respect to design, count and materials. Wind turbine blades are shaped to generate the maximum power from the wind at the minimum cost. Primarily the design is driven by the aerodynamic requirements, but economics mean that the blade shape is a compromise to keep the cost of construction reasonable. In particular, the blade tends to be thicker than the aerodynamic optimum close to the root, where the stresses due to bending are greatest.
3.10.2 Blade Design
The ration between the speed of the blade tips and the speed of the wind is called tip speed ration. High efficiency 3-blade-turbines have ratios of 6 to 7.
Modern wind turbines are designed to spin at varying speeds. Use of aluminum and composite materials in their blades has contributed to low rotational inertia, which means that newer wind turbines can accelerate quickly. If the winds pick up, keeping the tip speed ration more nearly constant. Operating closer to their optimal tip speed ration during energetic gusts of wind allows wind turbines to improve energy capture from sudden gusts that are typical in urban settings.
In contrast, older style wind turbines were designed with heavier steel blades, which have higher inertia, and rotated at speeds governed by the AC frequency of the power lines. The high inertia buffered the changes in rotation speed and thus made power output more stable.
The speed and torque at which a wind turbine rotates must be controlled for several reasons:
- To optimize the aerodynamic efficiency of the rotor in light winds.
- To keep the generator within its speed and torque limits.
- To keep the rotor and hub within their centripetal force limits. The centripetal force from the spinning rotors increases as the square of the rotation speed, which makes this structure sensitive to over speed.
- To keep the rotor and tower within their strength limits. Because the power of the wind increases as the cube of the wind speed, turbines have to be built to survive much higher wind loads (such as gusts of wind) than those from which they can practically generate power. Since the blades generate more downwind force (and thus put far greater stress on the tower) when they are producing torque, most wind turbines have ways of reducing torque in high winds.
- To enable maintenance; because it is dangerous to have people working on a wind turbine while it is active, it is sometimes necessary to bring a turbine to a full stop.
- To reduce noise as a rule of thumb, the noise from a wind turbine increases with the fifth power of the relative wind speed (as seen from the moving tip of the blades). In noise-sensitive environments, the tip speed can be limited to approximately 60 m/s (200 ft/s).
3.10.3 Number of Blades
The limitation on the available power in the wind means that the more blades there are the less power each can extract. A consequence of this is that each blade must also be narrower to maintain aerodynamic efficiency. The total blade area as a fraction of the total swept disc area is called the solidity, and aerodynamically there is an optimum solidity for a given tip speed; the higher the number of blades, the narrower each one must be. In practice the optimum solidity is low (only a few percent) which means that even with only three blades, each one must be very narrow. To slip through the air easily the blades must be thin relative to their width, so the limited solidity also limits the thickness of the blades. Furthermore, it becomes difficult to build the blades strong enough if they are too thin or the cost per blade increases significantly as more expensive materials are required. For this reason, most large machines do not have more than three blades. The other factor influencing the number of blades is aesthetics: it is generally accepted that three-bladed turbines are less visually disturbing than one- or two-bladed designs.
3.10.4 Blade Materials
Wood and canvas sails were used on early windmills due to their low price, availability, and ease of manufacture. Smaller blades can be made from light metals such as aluminum. These materials, however, require frequent maintenance. Wood and canvas construction limits the airfoil shape to a flat plate, which has a relatively high ratio of drag to force captured (low aerodynamic efficiency) compared to solid airfoils. Construction of solid airfoil designs requires inflexible materials such as metals or composites. Some blades also have incorporated lightning conductors.
3.11 Tower
- The towers are required to be strong enough to support the weight of the blades and generator/nacelles.
- They must also withstand fluctuating wind loading and loading resulting from turbine blade rotation.
- This means that the towers must be stiff and strong. They do not need to be particularly light if positioned on shore, although all foundations will be cheaper if the turbine weight is low.
- Transport to location is an issue and it will help if the tower can be made from sections and assembled to ease transport issues. Again weight will be an issue but it is secondary to other considerations.
- If a turbine is placed off-shore, then the weight becomes of greater importance. In terms of the costs of foundations and the cranes necessary to install the turbine.
3.12 Generator
For large, commercial size horizontal-axis wind turbines, the generator is mounted in a nacelle at the top of a tower, behind the hub of the turbine rotor. Typically wind turbines generate electricity through asynchronous that are directly connected with the electricity grid. Usually the rotational speed of the wind turbine is slower than the equivalent rotation speed of the electrical network – typical rotation speeds for a wind generators are 5-20 rpm while a directly connected machine will have an electrical speed between 750-3600 rpm. Therefore, a gearbox is inserted between the rotor hub and the generator. This also reduces the generator cost and weight. Older style wind generators rotate at a constant speed, to match power line frequency, which allowed the use of less costly induction generators. Newer wind turbines often turn at whatever speed generates electricity most efficiently. This can be solved using multiple technologies such as doubly fed induction generators or full-effect converters where the variable frequency current produced is converted to DC and then back to AC, matching the line frequency and voltage. Although such alternatives require costly equipment and cause power loss, the turbine can capture a significantly larger fraction of the wind energy. In some cases, especially when turbines are sited offshore, the DC energy will be transmitted from the turbine to a central (onshore) inverter for connection to the grid.
3.13 Wind Turbine Construction
3.13.1 The Generator Used in Our Wind Turbine Has the Following Specifications
- Permanent magnetDC generator
- 36 volt ; 5 A
- 1024 rpm
- 180 watt
- 2 pole
- 2 kg.
3.13.2 Blade Specifications
- Number of blade : three
- Material used : Aluminium
- Radius of blade : 3 feet
- Pitch angle: 17°
- Weight: 4 Kg
3.13.3 Parameter Measurement
A wind turbine captures energy from moving air and converts it into electricity. The available power extracted by the wind turbine from wind energy is given by the following equation:
Where,
=aerodynamic power, watt
= air density, kg/m3
=rotor swept area, m2
= power co-efficient
V= wind velocity, m/s
Again,
Where,
And
Tip
R= rotor radius
= rotor-blade angle (pitch angle)
Experimental Measured Value:
T=60 s
N=40
wm= = =4.19 radian per sec
R=3 feet=.91m
v=4 ms-1
λ= = =.953
Height difference between the two located points (mm, ft or in) =.98 m=3.86 inch
Measured angle () =79°
=17
and
| V(ms-1) | λ | |||
| 1 | 4 | .953 | 2.31 | .0022 |
| 2 | 5 | 1.14 | 2.5 | .0039 |
| 3 | 6 | 1.27 | 2.65 | .0053 |
Table 3.1: Cp measurements fixing α varying wind speed
In this table blade angle α is fixed and we just varied the wind speed. It was not possible for us to change blade angle as pitch variation was not used. Here we can see that power coefficient is very low. We have thought of some probable reasons:
- Small blade angle
- Laboratory set up
- Faulty blade construction
- Low wind speed
Another table is given below. Here α is varied and wind speed is fixed. We did not do it experimentally rather just done mathematically using equations.
| V(ms-1) | Λ | α | |||
| 1 | 4 | .953 | 2.31 | 17 | .0022 |
| 2 | 4 | .953 | 3.35 | 30 | .0167 |
| 3 | 4 | .953 | 4.55 | 45 | .02 |
| 4 | 4 | .953 | 5.75 | 60 | -.114 (not possible) |
| 5 | 4 | .953 | 8.15 | 90 | -1.107 (not possible) |
Table 3.2: Cp measurements fixing wind speed and varying α
3.14 Effectiveness of Wind Energy in Hybrid System
Wind turbines of all sizes have become a familiar sight around the world for a wide variety of reasons, including their economic, environmental, and social benefits. The potential for wind energy is immense, and experts suggest wind power can supply up to 20% of U.S. and world electricity. Nevertheless, the United States currently produces less than 3% of our electricity from wind. The advantages and disadvantages of wind energy are detailed here to help you decide what the future of wind should be in the United States.
3.14.1 Economic Advantages
· Revitalizes Rural Economies: Wind energy can diversify the economies of rural communities, adding to the tax base and providing new types of income. Wind turbines can add a new source of property taxes in rural areas that otherwise have a hard time attracting new industry. Each 100 MW of wind development in southwest Minnesota has generated about $1 million per year in property tax revenue and about $250,000 per year in direct lease payments to landowners.
· Fewer Subsidies: All energy systems are subsidized, and wind is no exception. However, wind receives considerably less than other forms of energy. According to Renewable Energy World magazine, conventional energy receives US$300 billion in subsidies per year, while renewable energy has received less than US$20 billion of tax-payers money in the last 30 years.
· Free Fuel: Unlike other forms of electrical generation where fuel is shipped to a processing plant, wind energy generates electricity at the source of fuel. Wind is a native fuel that does not need to be mined or transported, taking two expensive aspects out of long-term energy costs.
· Price Stability: The price of electricity from fossil fuels and nuclear power can fluctuate greatly due to highly variable mining and transportation costs. Wind can help buffer these costs because the price of fuel is fixed and free.
· Promotes Cost-Effective Energy Production: The cost of wind-generated electricity has fallen from nearly 40¢ per kWh in the early 1980s to 2.5-5¢ per kWh today depending on wind speed and project size.
· Creates Jobs: Wind energy projects create new short and long term jobs. Related employment ranges from meteorologists and surveyors to structural engineers, assembly workers, lawyers, bankers, and technicians. Wind energy creates 30% more jobs than a coal plant and 66% more than a nuclear power plant per unit of energy generated.
3.14.2 Social Advantages
· National Security/Energy Independence: Wind turbines diversify our energy portfolio and reduce our dependence on foreign fossil fuel. Wind energy is homegrown electricity, and can help control spikes in fossil fuel cost. Distributed generation facilities, like many community wind projects, provide a safeguard against potential terrorist threats to power plants.
· Supports Agriculture: It is not often a new crop emerges from thin air. Wind turbines can be installed amid cropland without interfering with people, livestock, or production.
· Local Ownership: A significant contribution to the worldwide energy mix can be made by small clusters of turbines or even single turbines, operated by local landowners and small businesses. Developing local sources of electricity means we import less fuel from other states, regions, and nations. It also means our energy dollars are plowed back into the local economy.
3.14.3 Environmental Advantages
· Clean Water: Turbines produce no particulate emissions that contribute to mercury contamination in our lakes and streams. Wind energy also conserves water resources. For example, producing the same amount of electricity can take about 600 times more water with nuclear power than wind, and about 500 times more water with coal than wind.
· Clean Air: Other sources of electricity produce harmful particulate emissions which contribute to global climate change and acid rain. Wind energy is pollution free.
· Mining & Transportation: Harvesting the wind preserves our resources because there no need for destructive resource mining or fuel transportation to a processing facility.
· Land Preservation: Wind farms are spaced over a large geographic area, but their actual “footprint” covers only a small portion of the land resulting in a minimum impact on crop production or livestock grazing. Large buildings cannot be built near the turbine, thus wind farms preserve open space.
CHAPTER 5
Discussion and Conclusion
5.1 Discussion and Conclusion
In this time, electricity is very necessary element in our country not only Bangladesh but also all over the world. But electricity crisis is a major problem in our country which abstracted in economic development of our nation. Insufficient fuel lacking of efficient management and lack of timely implementation of allocated money are the major problems of power crisis in our country. Developed country using nuclear power plant and renewable energy to solve their power crisis.
The radioactive material which created by nuclear energy is very harmful for whole world. As a result the develop country go to nuclear energy to renewable energy.
Recent projects for PV implementation in Bangladesh
The increasing energy demand and the radiation of the limited availability of fossil energy promoted us to find out alternative energy sources. As an alternative energy source, solar energy is the most promising in Bangladesh.
The power division of Bangladesh is likely to finalize a $2.76 b plan to generate 500 MW of solar power by 2015 through both commercial and social projects. According to the plan, around $1.77 b investment will be required for generating 340 MW power in commercial projects and $1.0 b will be required for generating 160 MW in social projects.
The commercial ventures solar plants which will provide 150 MW of power for irrigation, solar parks which will supply 145 MW of power to the national grid, and a solar power mini grid which will provide 25 MW of power to rural consumers. In addition, 30 MW will be generated in commercial and residential buildings and industries.
In the social projects, a total of 50 MW of power will be generated in the rural health centers by the health ministry , 40 Mw will be generated in remote educational institutions by the education ministry,41 MW of power in government offices by the public works department, 12 MW of power in religious establishments by the religious affairs ministry, 10 MW of power at remote railway stations by the railway department and 7 MW of power at union information centers under the local government division.
The plan will be placed before the ministry of power, energy and mineral resource for approval. The government will implement the projects involving different funding agencies and routes including private entrepreneurs.
| PROJECTS | Production (MW) |
| Commercial projects: 1. Solar plant for irrigation 2. Solar parks for supplying to the national grid 3. Solar power mini grid for supplying to rural consumers 4. Commercial and residential buildings and industries Total | 150 145 25 30 350 |
| Social projects:
1. Rural health centres 2. Remote educational institution 3. Government offices 4. Religious establishments 5. Remote railway stations Total | 50 40 41 12 10 153 |
Table 5.1: Recent projects for PV implementation in Bangladesh
We can solve our electricity crisis by using renewable (Soar Energy, Hydroelectric Energy, Wind Power, Biomass Energy, Geothermal Energy) Solar and wind are suitable for our country climates. Form our research result, if we apply solar and wind in remote and hills area where impossible transmission of electricity, we can electrified this area ( Bandarban, Ruma, Boga lake, Keokradong, darjeelingpara, Passing Para, Jadipai para).
Applying this project result above this seven area the electricity condition is very much improved and get potential result in those area. As a result they can develop Agriculture and industries and get more facilities in health and Education. Electrification gives people more scope to work and earn in both urban and rural areas. The people of those area develop their life style by using this project that is why they develop their economy and finally act to growth our national economy.
Further development of our project
Further development of our project can be made by-
1. Innovation of new components to reduce the cost & prolong the life of different equipment.
2. More research work on inverter to increase lifetime.
3. Hybrid PV system with energy storage options (Compressed air or pump hydro).
4. Micro grids for better grid quality & reliability.
5. More research to improve the efficiency of PV cell.
6. Use of solar tracker. But at present solar tracker is costly.
7. Producing low cost but more efficient wind turbine.
8. Improved estimates of “loss factor”.
9. The use of remote sensing techniques to measure wind speed.
10. Reducing diesel price.


![Report on Overall activity on AB Bank ltd [part-2]](https://assignmentpoint.com/wp-content/uploads/2013/04/ab-bank2-200x100.jpg)