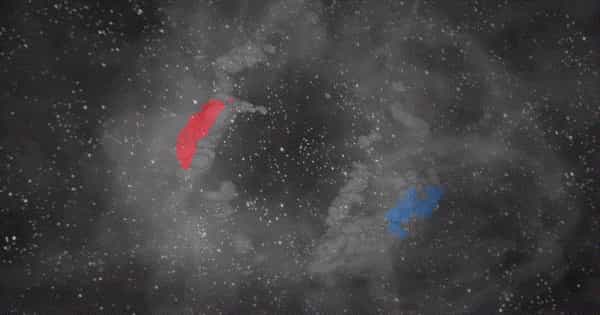
While mapping interstellar dust, astronomers discovered a massive cavity in space. The sphere-shaped phenomenon could explain how supernovae give rise to star formation. Astronomers studying 3D maps of the shapes and sizes of nearby molecular clouds discovered a massive space cavity.
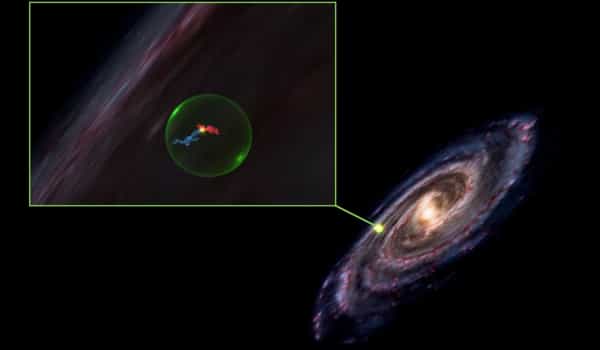
The sphere-shaped void, described today in the Astrophysical Journal Letters, spans approximately 150 parsecs (nearly 500 light-years) and is located in the sky between the constellations Perseus and Taurus. The research team at the Center for Astrophysics | Harvard & Smithsonian believes the cavity was formed by ancient supernovae that exploded 10 million years ago.
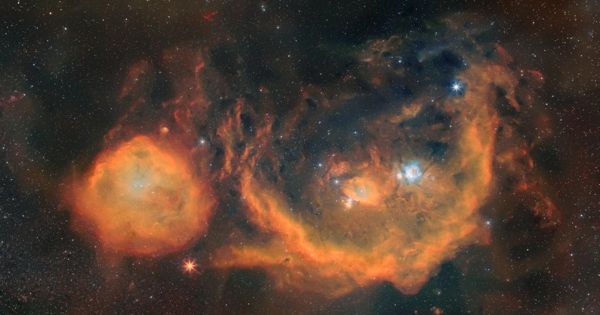
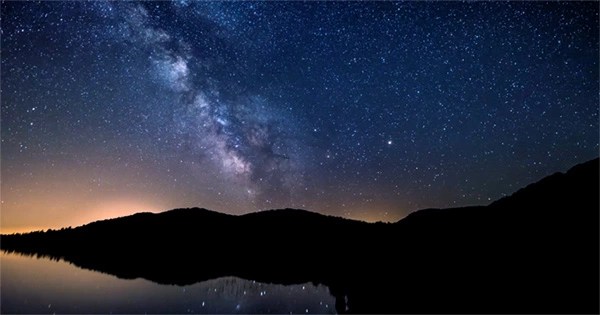
The enigmatic cavity is surrounded by the Perseus and Taurus molecular clouds, which are regions of space where stars form. “Hundreds of stars are forming or already exist at the surface of this giant bubble,” says Shmuel Bialy, the study’s lead author and postdoctoral researcher at the Institute for Theory and Computation (ITC) at the Center for Astrophysics (CfA). “We have two theories: either one supernova went off at the core of this bubble and pushed gas outward, forming what we now call the ‘Perseus-Taurus Supershell,’ or it was created over time by a series of supernovae.”
Astronomers have discovered an enormous cavity in space while mapping interstellar dust. The sphere-shaped phenomenon may explain how supernovae lead to star formation.
The discovery implies that the Perseus and Taurus molecular clouds are not separate structures in space. They formed together, however, from the same supernova shockwave. “This shows that when a star dies, its supernova generates a chain of events that may eventually lead to the birth of new stars,” Bialy says.
Mapping Stellar Nurseries
The 3D map of the bubble and surrounding clouds was created using new data from Gaia, the European Space Agency’s space-based observatory (ESA). A separate study published today in the Astrophysical Journal describes how 3D maps of the Perseus and Taurus molecular clouds, as well as other nearby clouds, were analyzed (ApJ). Both studies make use of a dust reconstruction developed by researchers at Germany’s Max Planck Institute for Astronomy.
The maps are the first time molecular clouds have been charted in three dimensions. Previous images of clouds were only in two dimensions. “For decades, we’ve been able to see these clouds, but we’ve never known their true shape, depth, or thickness. We also didn’t know how far away the clouds were “says Catherine Zucker, the CfA postdoctoral researcher who led the ApJ study. “With only 1% uncertainty, we now know where they are, allowing us to discern this void between them.”
But why map clouds in the first place?
“There are a lot of theories about how gas rearranges itself to form stars,” Zucker says. “Astronomers have previously tested these theoretical ideas using simulations, but this is the first time we can compare theory to observation and evaluate which theories work best.”
The Universe at Your Fingertips
The new study is the first time that astronomy visualizations in augmented reality have been published in American Astronomical Society (AAS) journals. By scanning a QR code in the paper with their smartphone, scientists and the general public can interact with the visualization of the cavity and its surrounding molecular clouds.
“You can literally make the universe float over your kitchen table,” says Alyssa Goodman, a co-author on both studies and the founder of glue, the data visualization software used to create the molecular cloud maps.
Goodman refers to the new publications as “future papers” and sees them as significant steps toward the interactivity and reproducibility of science, which the AAS committed to in 2015 as part of their effort to modernize publications.
“We need more detailed records of scientific discovery,” says Goodman. “And recent scholarly papers could fare much better. All of the data in these papers is available online at Harvard’s Dataverse, allowing anyone to build on our findings.”
Goodman envisions future scientific articles that include audio, video, and enhanced visuals on a regular basis, making it easier for all readers to understand the research presented. “It’s 3D visualizations like these that can help both scientists and the general public understand what’s going on in space and the powerful effects of supernovae,” she says.