Tree effect
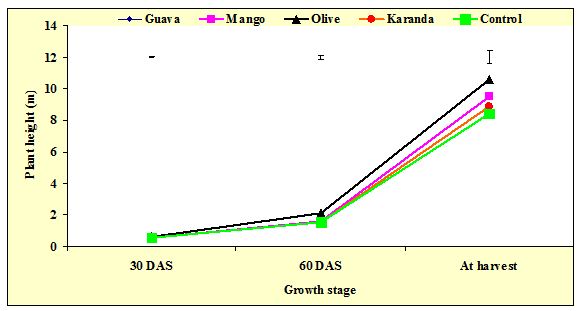
Significant variation was observed in respect of plant height of country bean due to upperstorey trees (P. guajava, M. indica, O. europea and C. acuminata) at different days after sowing. Plant height under P. guajava, M. indica, O. europea, C. acuminata and control was almost similar at 30 days after sowing (DAS). At 60 day after sowing plant height exhibited distinct differences regarding upperstorey tree effect. At that time, the highest (2.10 m) plant height was recorded under O. europea based agroforestry system and the lowest plant height (1.57 m) was observed under control treatment. Plant height of country bean was recorded highest (10.60 m) at harvest time under O. europea based agroforestry system and the lowest (8.43 cm) under control treatment at the same time. Under reduced sunlight the increase in the individual internode length resulted total length. This was probably due to higher apical dominance under shade condition (Hillman, 1984).
Distance effect
Distance had significant influence on the plant height of country bean at 30 days after sowing (Fig. 36.2). At that time, the highest plant height (0.61 m) of country bean was recorded at D1 distance and D2 distance produced the lowest plant (0.57 m) height. Shade was the highest beneath the tree and apart from the tree, shade was reduced correspondingly. Under the tree, shade induced apical dominance which increases plant height.
Combined effect between associated tree species and distance from tree base
Plant height of country bean at different day after sowing (DAS) was significantly influenced by tree species and distance from tree base (Table 13). The highest plant height (0.68 m) was recorded at D1 distance under O. europea species and the lowest was (0.54 m) was recorded at D1 distance under control treatment. On the other hand, the highest plant height (2.43 m and 10.84 m) was recorded at D1 distance at 60 DAS and at harvest time under O. europea based agroforestry system, while the lowest by 1.47 m and 7.74 m was recorded at 60 DAS and harvest time at D2 distance under no tree control. Crops grown under shade intended to harvest more light for photosynthesis and increases its apical part by cell division. That’s why crop under shade increases its height than crops under sunlight.
Table 13: Combined effect of tree species and distance from tree base on plant height of country bean
| Tree species | Distance from tree base (m) | Plant Height (m) | ||
30 DAS | 60 DAS | At harvest | ||
| P. guajava | D1 (0.5) | 0.58 cd | 1.60 bc | 9.12 b |
D2 (2.0) | 0.58 cd | 1.56 bc | 9.50 b | |
| M. indica | D1(0.5) | 0.61 bc | 1.68 bc | 9.76 b |
D2(2.0) | 0.59 b-d | 1.57 bc | 9.28 b | |
| O. europea | D1(0.5) | 0.68 a | 2.43 a | 10.84 a |
D2(2.0) | 0.62 b | 1.77 b | 9.96 b | |
| C. acuminata | D1(0.5) | 0.57 cde | 1.59 bc | 9.54 b |
D2(2.0) | 0.57 de | 1.57 bc | 8.28 c | |
| Control | D1(0.5) | 0.54 e | 1.54 bc | 8.30 c |
D2(2.0) | 0.56 de | 1.47 c | 7.74 c | |
| CV (%) | – | 3.52 | 7.75 | 4.89 |
| LSD | – | 0.04 | 0.22 | 0.78 |
Plant duration
Tree effect
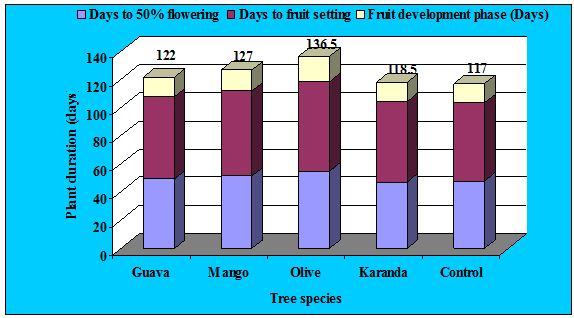
Different upperstorey tree had significant influence on plant duration of country bean. Plant duration of country bean increased significantly with reducing light condition (Fig. 37.1). The highest day to 50% flowering (55.17 days) was recorded under O. europea based agroforestry system and the lowest (47.33 days) was observed under full sunlight. Day to fruit setting was significantly influenced by different upperstorey tree species. The highest day to fruit setting (63.50 days) was recorded under O. europea based agroforestry system while the lowest (55.67 days) was observed under control treatment. Similarly, the highest fruit development phase (17.83 days) and total crop duration (136.50 days) were observed under O. europea based agroforestry system while the lowest fruit development phase (13.50 days) and total crop duration (117.00 days) was resulted under control treatment. Shade decreases the photosynthesis rate of crops grown under tree and increase the time of producing final products (carbohydrate) and that’s why crops grown under shade complete life cycle later as compared to crops under full sunlight.
Distance effect
Distance from tree base had no or little effect on plant duration of country bean (Fig. 37.2). Days to 50% flowering, fruit development phase and total crop duration had no significant influence when country bean cultivation at D1 and D2 distance from tree base. But day to fruit setting was influenced significantly. The highest day to fruit setting (60.80 days) was observed at D1 distance while the lowest (58.53 days) was recorded at D2 distance.
Combined effect between associated tree species and distance from tree base
Plant duration of country bean was significantly influenced by the combined effect of tree species and distance from tree base (Table 14). Days to 50% flowering were the highest (55.33 days) at D1 distance under O. europea species and the lowest (47.00 days) was recorded at D2 distance under control treatment. Similar trend was recorded on other parameters. Under O. europea based agroforestry system the highest day to fruit setting (66.00 days), fruit development phase (18.00 days) and total crop duration (138.3 days) were recorded at D1 distance. In case of control treatment, D2 distance produced the lowest (55.33 days) days to fruit setting, fruit development phase ( 13.33 days) and total crop duration (117.00 days).
Table 14: Combined effect of tree species X distance from tree base on plant duration of country bean
| Tree species | Distance from tree base (m) | Plant Duration (days) | |||
Days to 50% flowering | Days to fruit setting | Fruit development phase (Days) | Total crop duration (days) | ||
| P. guajava | D1(0.5) | 48.00 c-e | 59.33 cd | 14.67 cd | 120.7 de |
D2(2.0) | 50.33 b-d | 58.00 de | 15.67 c | 119.0 e | |
| M. indica | D1(0.5) | 51.00 bc | 61.33 bc | 13.67 de | 129.0 bc |
D2(2.0) | 51.00 bc | 59.33 cd | 13.33 e | 125.0 cd | |
| O. europea | D1(0.5) | 55.33 a | 66.00 a | 18.00 a | 138.3 a |
D2(2.0) | 52.00 b | 63.00 b | 16.67 b | 132.7 b | |
| C. acuminata | D1(0.5) | 47.67 de | 57.33 d-f | 14.33 de | 121.3 de |
D2(2.0) | 48.67 c-e | 57.00 d-f | 13.67 de | 119.7 e | |
| Control | D1(0.5) | 47.67 de | 56.00 ef | 13.33 e | 117.0 e |
D2(2.0) | 47.00 e | 55.33 f | 13.33 e | 117.0 e | |
| CV (%) | – | 3.34 | 2.14 | 4.27 | 2.05 |
| LSD | – | 2.89 | 2.19 | 1.10 | 4.37 |
SPAD value (Soil Plant Analysis Development)
Tree effect
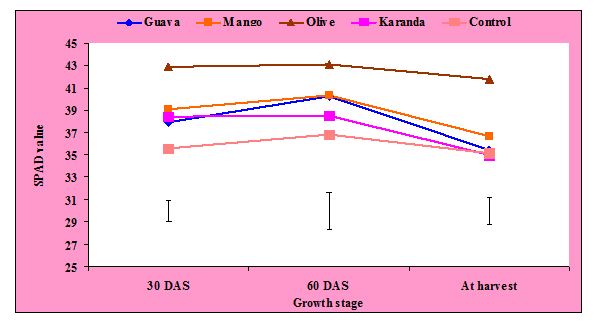
Different upperstorey tree had significant influence on SPAD value of country bean (Fig. 38.1). Country bean grown under O. europea based agroforestry system resulted the highest SPAD value (42.88) followed by M. indica (39.12), P. guajava (37.93) and C. acuminata (38.43) where the lowest (35.58) SPAD value was obtained from the control treatment (Fig. 5.1) at 30 days after sowing (DAS). Similarly at 60 DAS, the highest (43.08) SPAD value was recorded under O. europea based agroforestry system and the lowest (36.81) was resulted under control treatment. At harvest time of country bean, SPAD value showed the similar trend as like 30 and 60 DAS.
Distance effect
SPAD value varied significantly due to distance from tree base. SPAD value at 30 DAS (39.87), 60 DAS (41.08) and at harvest time (38.11) were the highest at D1 distance while the lowest (37.71, 38.54 and 35.53 respectively) at D2 distance. Under tree, shade influence to produce higher chlorophyll to harvest more light resulting the greenness and higher SPAD value under shade compared to control.
Combined effect between associated tree species and distance from tree base
SPAD value of country bean was significantly influenced by different tree species and distance from tree base. Significantly the highest SPAD value (46.43) was recorded at D1 distance under O. europea based agroforestry system and the lowest SPAD value (35.23) was recorded at D1 distance under full sunlight at 30 DAS. At 60 DAS, the highest SPAD value (48.44) was recorded at D1 distance under O. europea based agroforestry system and the lowest (40.33) SPAD value was recorded at D1 distance under control treatment. Similar trend of SPAD value i.e. highest (45.20) SPAD value was recorded under O. europea based agroforestry system at D1 distance and the lowest (34.73) was observed at the same distance under control treatment (Table 15).
Table 15. Combined effect of tree species X distance from tree base on SPAD value of country bean
| Tree species | Distance from tree base (m) | SPAD value (30 DAS) | SPAD value (60 DAS) | SPAD value (at harvest) |
| P. guajava | D1(0.5) | 38.67 b-d | 39.31 b | 35.57 cd |
D2(2.0) | 37.20 de | 37.71 b | 34.50 d | |
| M. indica | D1(0.5) | 39.33 bc | 37.75 b | 37.77 bc |
D2(2.0) | 38.40 b-d | 40.29 b | 36.40 b-d | |
| O. europea | D1(0.5) | 46.43 a | 48.44 a | 45.20 a |
D2(2.0) | 39.83 b | 40.24 b | 38.40 b | |
| C. acuminata | D1(0.5) | 39.20 b-d | 36.92 b | 35.53 cd |
D2(2.0) | 37.67 c-e | 36.70 b | 34.43 d | |
| Control | D1(0.5) | 35.23 f | 40.33 b | 35.63 cd |
D2(2.0) | 35.93 ef | 40.39 b | 34.73 d | |
| CV (%) | – | 2.82 | 6.72 | 3.88 |
| LSD | – | 1.88 | 3.23 | 2.45 |
Stem diameter
Tree effect
Stem diameter of country bean increased significantly with increasing light intensity .The highest (11.60 mm) stem diameter of country bean was recorded under control treatment while the lowest (7.14 mm) was observed under O. europea based agroforestry system (Fig. 39.1) Stem diameter under P. guajava ( 7.95 mm), M. indica ( 8.23 mm) and C. acuminata ( 9.26 mm) was the intermediate.
Distance effect
No significant variation was observed when country bean grown at various distance from tree base. However, the highest stem diameter (8.95 mm) was recorded at D2 distance while the lowest (8.72 mm) was observed at D1 distance (Fig 39.2)
Internode length
Tree effect
Country bean plant exhibited significantly the higher internode length under shade (Fig. 40.1). The longest internode length (17.68 cm) was observed under O. europea based agroforestry system and the shortest (12.02 cm) was resulted under control treatment. Under reduced sunlight, the increase in internode length resulted increased main stem length (Hillman, 1984).
Distance effect
There is no significant variation was observed of internode length of country bean as a function of distance from tree base (Fig. 40.2). The highest internode length (15.48 cm) was recorded at D1 distance while the lowest (13. 54 cm) was observed at D2 distance.
Tree effect
Upperstorey tree had significant influence on the fruit number per plant (Fig. 41.1).The highest (87.00 fruits/plant) number of fruits per plant was observed under control treatment and the lowest (62.67 fruits/plant) number of fruits per plant was recorded under O. europea based agrogorestry system followed by P. guajava (64.67 fruits/plant), M. indica (67.83 fruits/plant) and C. acuminata (65.17 fruits/plant) based agroforestry system.
Distance effect
Distance from tree base had significant influence on fruit number per plant (Fig. 41.2). The lowest fruits number per plant (67.93 fruits/plant) was observed at D1 distance while the D2 distance produced the highest (83.00 fruits/plant).
Fruit length
Tree effect
Different upperstorey tree had significant influence on the fruit length of country bean (Fig. 42.1). Country bean grown under control treatment resulted the highest (65.30 mm) fruit length whereas the lowest fruit length was recorded (60.07 mm) under O. europea based agroforestry system which was statistically similar to P. guajava (60.79 mm), M. indica (60.14 mm) and C. acuminata ( 65.52 mm) based agroforestry system.
Distance effect
No significant variation was observed of fruit length of country bean grown as a function of distance from tree base. The highest fruit length (64.49 mm) was observed at D2 distance whereas the lowest (60.64 mm) was observed at D1 distance .
Combined effect of associated tree species and distance from tree base
Yield contributing characters of country bean was significantly influenced by the combined effect of tree species and distance from tree base (Table 16). Stem diameter (6.38 mm), fruits number per plant (47.00 fruits/plant) and fruit length (57.09 mm) were the lowest while internode length (18.10 cm) was the highest under O. europea based agroforestry system. On the contrary, the highest stem diameter (11.35 mm), fruits number per plant (106.3 fruits/plant) and fruit length (69.41 mm) whereas the lowest internode length (11.66 cm) were recorded at D1 distance under control treatment.
Table 16: Combined effect of tree species and distance from tree base on yield contributing characteristics of country bean
| Tree species | Distance from tree base (m) | Stem diameter (mm) | Internode length (cm) | Fruit number plant-1 | Fruit length (mm) |
| P. guajava | D1(0.5) | 8.33 cd | 15.13 b | 70.33 de | 60.44 bc |
D2(2.0) | 8.13 d | 15.37 b | 66.33 ef | 64.09 b | |
| M. indica | D1(0.5) | 7.90 d | 14.27 bc | 65.33 ef | 60.55 bc |
D2(2.0) | 8.23 d | 13.67 bc | 64.00 f | 60.94 bc | |
| O. europea | D1(0.5) | 6.38 e | 18.10 a | 47.00 h | 57.09 c |
D2(2.0) | 7.67 d | 15.37 b | 56.67 g | 59.73 bc | |
| C. acuminata | D1(0.5) | 9.22 bc | 12.40 c | 72.67 d | 58.19 c |
D2(2.0) | 9.30 bc | 13.40 bc | 78.33 c | 63.05 b | |
Control
D1(0.5)
11.35 a
11.66 c
106.3 a
69.41 a
D2(2.0)
9.85 b
12.77 bc
101.7 b
61.14 bc
CV (%)
–
4.45
5.58
10.14
5.43
LSD
–
0.93
2.43
5.33
3.97
Fruit diameter
Tree effect
Different upperstorey tree had significant influence on fruit diameter of country bean . Country bean grown under control treatment recorded the highest (20.54 mm) fruit diameter whereas the lowest (17.42 mm) was obtained from the O. europea based agroforestry system . Upper ground competition for light and below ground competition for moisture and nutrient resulted minimum fruit diameter under agroforestry system.
Distance effect
Fruit diameter of country bean did not affected significantly due to distance from tree base ). However, the highest fruit diameter (18.54 mm) was recorded at D2 distance whereas the lowest (17.53 mm) diameter was observed at D1 distance from tree base.
Single fruit weight
Tree effect
Significant variation of single fruit weight was observed due to the effect of agroforestry system. Country bean cultivated under O. europea species produced the lowest (6.63 g) single fruit weight, whereas the highest (10.97) single fruit weight was recorded under control treatment. Diffuse light promotes the lower translocation of carbohydrates to the fruit resulted lower fruit weight under shade.
Distance effect
No significant variation was observed of single fruit weight of country bean as a function of distance from tree base. The highest value (8.83 g) was recorded at D2 distance while the lowest (8.16 g) was observed at D1 distance from tree base
Yield (t/ha)
Tree effect
Significant variation in yield of country bean among the treatments was resulted from the shade effect . Country bean grown under P. guajava (556 µmm-2s-1), M. indica, (477.5 µmm-2s-1), O. europea (482 µmm-2s-1) and C. acuminata (847.5 µm m-2s-1) based agroforestry systems received less sunlight compared with solely grown bean plant (1107 µmm-2s-1) resulting taller height, less number of fruit per plant, less single fruit weight which decreased yield of country bean finally. Significantly, the lowest yield of country bean (2.66 t/ha) was recorded under O. europea based agroforestry system and the highest yield (4.65 t/ha) was recorded under control treatment. Haque (2001) obtained similar yield of yardlong bean under 75-100% PAR level. Similar trends in rice yield decline under shaded condition were also reported by many others (Roy et. al., 1998, Vityakon et al., 1993). Diffuse light promotes the development of vegetative structures while intense light favors the development of flowers, fruits and seeds (Weaver and Clements, 1973). Light intensity also influences the translocation of carbohydrates from source to sink. Under reduced light condition, translocation in poor which reduced grain yield significantly (Murty and Murty, 1981).
Distance effect
Distance from tree base also influenced significantly on the yield of country bean. The lowest country bean yield (3.28 t/ha) was recorded at D1 distance whereas the highest (3.83 t/ha) yield was recorded at D2 distance.
Combined effect between associated tree species and distance from tree base
Fruit diameter, single fruit weight and yield of country bean were significantly affected by the combined effect of tree species and distance from tree base. Under O. europea based agroforestry system, the lowest (16.10 mm) fruit diameter was recorded at D1 distance whereas the highest fruit diameter (19.86 mm) was recorded at D1 distance under control treatment. Single fruit weight and yield of country bean showed the same trend like fruit diameter. Under control system, the highest single fruit weight (11.70 g) and yield (4.57 t/ha) were recorded at D1 distance while the lowest single fruit weight (6.53 g) and yield (2.64 t/ha) were observed at D1 distance under O. europea based agroforestry system (Table 17).
Table 17: Combined effect of tree species and distance from tree base on fruit diameter, single fruit weight and yield of country bean
| Tree species | Distance from tree base (m) | Fruit diameter (mm) | Single fruit weight (g) | Yield (tha-1) |
| P. guajava | D1(0.5) | 17.41 b | 8.37 b-d | 2.88 e |
D2(2.0) | 17.94 b | 8.23 b-d | 3.92 cd | |
| M. indica | D1(0.5) | 17.67 b | 7.73 c-e | 2.52 e |
D2(2.0) | 17.86 b | 7.33 de | 3.55 d | |
| O. europea | D1(0.5) | 16.10 c | 6.53 e | 2.64 e |
D2(2.0) | 16.91 bc | 6.73 e | 2.69 e | |
| C. acuminata | D1(0.5) | 17.87 b | 8.93 bc | 3.79 d |
D2(2.0) | 17.54 b | 9.23 b | 4.27 bc | |
| Control | D1(0.5) | 19.86 a | 11.70 a | 4.57 ab |
D2(2.0) | 18.22 b | 9.17 b | 4.72 a | |
| CV (%) | – | 3.66 | 2.82 | 6.11 |
| LSD | – | 1.19 | 1.27 | 0.37 |
Light intensity
Tree effect
The relationship between light intensity and day after measurement was studied under different agroforestry systems. The significant effect of light intensity and day after measurement was observed as a function of associated tree species.
The slight variation of light intensity was observed with the increase of day after measurement. At the initial stage, the light intensities were a little lower which was increasing up to 60 days after measurement. After then, light intensely were decreased significantly for all the agroforestry systems with the increasing of day after measurement.
Considering the tree species, the maximum light intensities were observed under control treatment throughout the growing period of country bean. On the other hand the minimum light intensities were recorded under O. europea based agroforestry system. This was followed by M. indica, P. guajava and C. acuminata based agroforestry system. As a result, the trend of light intensities throughout the growing period of country bean were control > C. acuminata> P. guajava> M. indica > O. europea.
Distance effect
Upperstorey tree canopy had significantly influenced the light intensity as a function of distance from tree base country bean grown at D1 distance under the tree experienced the minimum (591.8 m m-2s-1) light intensity whereas the maximum (689.3 m m-2s-1) light intensity was recorded at D2 distance.
Soil moisture
Tree effect
The relationship between day after measurement and soil moisture was studied in the field of country bean intercropped with different tree species. The significant effect between soil moisture and day after measurement was observed as a function of associated tree species .
At the initial stage of country bean growing period, soil moisture was lower which was increasing gradually with the increased of day after measurement.
When agroforestry systems takes into consideration, the maximum soil moisture was observed under O. europea based agroforestry system which was followed by M. indica, P. guajava and control. The lowest soil moisture was recorded under C. acuminata based agroforestry system. Beneath the O. europea, P. guajava and M. indica species, the air temperature was lower and decomposing leaf and other litters increased the soil moisture by capturing water and then increased moisture. On the contrary, the C. acuminata species was bushy and shallow root system which uptake water and nutrient from upper soil layer. So, under C. acuminata air temperature was the same as compared to control. That’s why; soil moisture under C. acuminata based agroforestry system was lower. So, the trend of soil moisture throughout the country bean growing season was O. europea > M. indica> P. guajava> control> C. acuminata.
Distance effect
Distance from tree base had no significant effect on soil moisture content. Under different agroforestry experimentation, the lowest (16.54 %) soil moisture was recorded at D2 distance whereas the highest (17.45 %) soil moisture was observed at D1 distance.
Soil Temperature
Tree effect
Soil temperature under different agroforestry systems and no tree control was recorded at 10 days interval and observed decreasing trend from initial growing stage of country bean up to harvest time. On the other hand when tree species takes into consideration the maximum soil temperature was recorded under control treatment which was followed by C. acuminata, P. guajava and M. indica based agroforestry system. The minimum soil temperature was observed under O. europea based agroforestry system.
In the agroforestry field, light penetration usually reduced by the canopy of tree species. Decomposing litter of the upper ground of the soil contains much moisture which decreases soil temperature beneath the tree. Control plot covered with country bean plant that gradually exhausted and finally died at the harvest stage and hence increased the soil temperature. As a result, the trend of soil moisture throughout the growing period of country bean was control > C. acuminata > P. guajava> M. indica> O. europea.
Distance effect
No significant influence of soil temperature was resulted as function of distance from tree base. The lowest (33.84 oC) soil temperature was recorded at D1 distance whereas the highest (35.60 oC) was observed at D2 distance.
The presence of tree may have both positive and negative over all effects on the water budget of the soil and the crops growing in between or beneath the tree. The higher soil moisture under Erythrina sp may have been partly due to lower evaporative water losses as a function of lower soil temperature (Bronstein, 1984). So under tree, soil temperature was low and apart from the tree soil temperature was high.
Combined effect between associated tree species and distance from tree base
Light intensity, soil moisture and soil temperature were significantly influenced by the combined effect of tree species and distance from tree base. The highest light intensity (997.1 mm-2s-1) was recorded at D2 distance under no tree control while the lowest (345.7 mm-2s-1) was observed at D1 distance under O. europea based agroforestry system (Table 18).
The canopy of O. europea (3.48 m2) and M. indica (3.58 m2) tree were dense and spreading which reduced light penetration to the soil layer resulting insufficient light under this tree. P. guajava (4.54 m2) and C. acuminata (1.70 m2) had also spreading but light canopy coverage which usually allows moderate light to the ground.
Soil moisture under agroforestry system was higher as compared to control. But when distance take into consideration the highest soil moisture (22.44%) was recorded beneath the tree (D1) under O. europea based agroforestry system and apart from the tree soil moisture was lower. Significantly the lowest soil moisture (13.99%) recorded at D1 distance under control treatment.
Soil temperature was significantly decreased with increasing canopy coverage. The lowest soil temperature (30.47 oC) was observed at D1 distance under O. europea species and the highest soil temperature (39.70 oC) was recorded at D1 distance under no tree control.
Table 18. Effect of interaction between associated tree species and distance from tree base on climatic parameters of country bean
| Tree species | Distance from tree base (m) | Light intensity (μ molm-2s-1) | Soil moisture (%) | Soil temperature (0C) |
| P. guajava | D1(0.5) | 508.70 c | 19.03 b | 32.13 def |
D2(2.0) | 516.70 c | 17.05 c | 37.46 b | |
| M. indica | D1(0.5) | 432.70 cd | 15.44 cd | 32.80 cde |
D2(2.0) | 522.30 c | 15.14 cd | 37.48 b | |
| O. europea | D1(0.5) | 345.70 d | 22.44 a | 30.47 f |
D2(2.0) | 476.30 c | 19.40 b | 31.89 ef | |
| C. acuminata | D1(0.5) | 818.30 b | 15.96 cd | 34.01 cd |
D2(2.0) | 901.70 b | 14.82 d | 34.58 c | |
| Control | D1(0.5) | 886.00b | 13.99 d | 39.70 a |
D2(2.0) | 997.10 a | 14.64 d | 34.71 c | |
| CV (%) | – | 8.17 | 6.99 | 1.77 |
| LSD | – | 89.77 | 1.84 | 1.96 |
Correlation between light intensity (m m-2S-1) and yield (tha-1) of country bean
There existed a linear relationship between light intensity and yield of cucumber intercropped with different tree species. Under P. guajava, M. indica, O. europea and C. acuminata species increasing light intensity increased the yield of cucumber.
In case of P. guajava, the linear relationship between light intensity and yield of cucumber estimated as Y = 0.0053 x + 1. 2128 (R2 = 0.8996) where R2 value was significant. This equation also stated that yield of cucumber increased at the rate of 0.0053 t/ha for per unit changing of light intensity. C. acuminata also showed the positive and significant relationship (R2 =0.7225) and cucumber yield increased under this tree at the rate of 0.0028 t/ha for per unit changing of light intensity.
In case of M. indica, linear relationship was observed and estimated as Y= 0.0078 x -0.6687, where R2 (0.8725) value was significant and positive. It was recorded that, under M. indica species, 0.0078 t/ha yield of cucumber was increased for per unit changing of light intensity. In the same way, O. europea showed positive and significant relationship (R2 = 0.9929) and yield of cucumber under this tree suddenly increased by 0.0061 t/ha for per unit changing of light intensity.
Correlation between soil moisture (%) and yield (tha-1) of country bean
The correlation between soil moisture and yield of cucumber showed a linear relationship which was negative and significant. On the other hand, increasing soil moisture in the all agroforestry system decreased the yield of cucumber .
In the P. guajava based agroforestry system, the relationship was negative and significant and estimated as Y = – 0.3198 x + 9.2508 (R2 =0.9535). The R2 value indicated that, about 95 percent of the contribution to the yield of cucumber can be explained by the soil moisture and 0.3198 t/ha yield of country bean decreased by per unit changing of soil moisture.
There was a negative but significant relationship between soil moisture and yield of cucumber under M. indica based agroforestry system and estimated at Y = -0.4901 x + 10.529 (R2 = 0.6666) and every unit changing of soil moisture, yield of country bean was reduced by 0.0.4901 t/ha.
In the C. acuminata based agroforestry system, the relationship between soil moisture and yield was the same as like M. indica based system and under this field country bean yield was reduced by 0.2024 t/ha for per unit changing of soil moisture. Same relationship was recorded under O. europea based agroforestry system and yield reduction was estimated by 0.2735 t/ha for every unit changing of soil moisture.
Correlation between soil temperature (oC) and yield (tha-1) of country bean
The relationship between soil temperature and yield of country bean under P. guajava species showed a linear equation and estimated as Y = 0.2577x – 5.2637 (R2 = 0.6035), where R2 value was positive and significant . This relation indicated that increasing soil temperature increase the yield of country bean. This equation also stated that yield of country bean was maximum, i.e., 2.73 t/ha at 32 oC soil temperature and beyond this soil temperature yield of country bean increased by 0.2577 t/ha for per unit changing of soil moisture.
Under M. indica, O. europea and C. acuminata based agroforestry system, yield of country bean also increased with the increase of soil temperature. In case of M. indica based agroforestry system yield of country bean increased by 0.1727 t/ha, incase of O. europea, yield increased by 0.1684 t/ha and incase of C. acuminata, it was 0.1927 t/ha for per unit changing of soil temperature .
Correlation between canopy volume (m2) and yield (tha-1) of tomato
The relationship between canopy spread and yield of country bean under P. guajava species showed a linear equation and estimated as Y = -2.9133 x + 18.252 (R2 = 0.6779), where R2 value is negative and significant . The R2 value indicated that about 68 percent of the contribution to the yield of country bean could be explained by canopy spread. This equation also stated that yield of country bean was maximum, i.e., 3.82 t/ha at 4.32 m2 canopy volume of P. guajava, and beyond this canopy yield decreased at the rate of 2.9133 t/ha for per unit changing of canopy spread.
The relation between canopy spread and yield of country bean under M. indica (R2 = 0.8143), O. europea (0.6083) and C. acuminata ( 0.5379) was negative and significant and increasing canopy spread of these trees, decrease the yield of country bean.