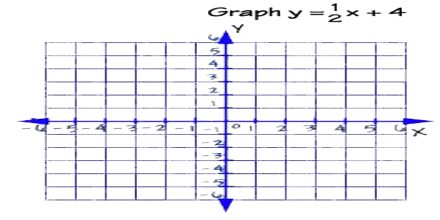
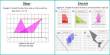
The aim of this lecture is to present on Graphing Linear Equations. Linear Equations can be graphed on a Cartesian Coordinate system. All points on a graph are plotted by first finding the x-coordinate and then the y-coordinate. You always graph a point starting from the Origin. All points are written in the form ( x , y). To graph a linear equation, here use the slope and y-intercept. Locate the y-intercept on the graph and plot the point. From this point, use the slope to find a second point and plot it. Draw the line that connects the two points.
Graphing Linear Equations