Statistical Range
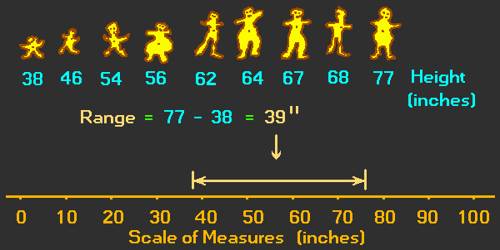
The statistical range is the difference between the lowest and highest valued numbers in a set of numbers. The formula for a range is the maximum value minus the minimum value in the dataset, which provides statisticians with a better understanding of how varied the data set is.
To find the range of a group of numbers:
- Arrange the numbers in order by size
- Subtract the smallest number from the largest number.
The range is the difference between the highest and lowest values within a set of numbers. To calculate range, subtract the smallest number from the largest number in the set. If a six-server rack includes 90 W, 98 W, 100 W, 102 W, 105 W and 110 W, the power consumption range is 110 W – 90 W = 20 W.
Example: A marathon race was completed by 5 participants. What is the range of times given in hours below?
2.7 hr, 8.3 hr, 3.5 hr, 5.1 hr, 4.9 hr
Solution: Ordering the data from least to greatest, we get:
2.7, 3.5, 4.9, 5.1, 8.3
highest – lowest = 8.3 hr – 2.7 hr = 5.6 hr
Answer: The range of swim times is 5.6 hr.
LIMITATIONS OF RANGE
The range is a very crude measurement of the spread of data because it is extremely sensitive to outliers, and as a result, there are certain limitations to the utility of a true range of a data set to statisticians because a single data value can greatly affect the value of the range.
For example, consider the set of data 1, 2, 3, 4, 6, 7, 7, 8. The maximum value is 8, the minimum is 1 and the range is 7. Then consider the same set of data, only with the value 100 included. The range now becomes 100-1 = 99 wherein the addition of a single extra data point greatly affected the value of the range.
The range also tells us nothing about the internal features of our data set. For example, we consider the data set 1, 1, 2, 3, 4, 5, 5, 6, 7, 8, 8, 10 where the range for this data set is 10-1 = 9.
If we then compare this to the data set of 1, 1, 1, 2, 9, 9, 9, 10. Here the range is, yet again, nine, however, for this second set and unlike the first set, the data is clustered around the minimum and maximum. Other statistics, such as the first and third quartile, would need to be used to detect some of this internal structure.
Information Source: