Limitation of the Study:
1. It was good if the study compare other hospital in a wide perspective.
2. Due to time and cost constraint the study only conducted in one
hospital.
3. The limitation of the study was the sample size. It only used limited
respondents which is not enough to generalize the findings.
Research Question:
What is the status of knowledge among the mothers having under-five year’s children about diarrhea in Shahid Suhrawardi Hospital in Bangladesh?
General objective:
To assess the status of knowledge among the mothers having under-five year’s children about diarrhea in Shahid Suhrawardi Hospital, Bangladesh.
Specific objectives:
- To explore the impact of socio demographic factors on the knowledge of the mothers having under-five year’s children attending in the upazila health complexes under Dhaka districts of Shahid Suhrawardi Hospital Bangladesh.knowledge of mother
- To determine the knowledge of diarrhea among the mothers having under-five year’s children attending in the upazila health complexes under Dhaka districts of Shahid Suhrawardi Hospital Bangladesh.
- To find out the knowledge of the mothers having under-five year’s children about the relation of diarrhea and malnutrition of children who attending in the upazila health complexes under Dhaka districts of Shahid Suhrawardi Hospital Bangladesh.
- To explore the knowledge of the mothers having under-five year’s children about vitamin A capsule supplementation to the children after diarrhea.

Type of study:
A cross sectional hospital based descriptive study was conducted in the upazila health complexes under Dhaka districts.
Sampling technique:
The sample size calculation follows the following formula:
Z2 x pq
d 2
Where:
n = Sample size estimate
Z = Z for level of significance alpha (at 0.05 level of significance value of Z is 1.96)
p= 50%
q= 1-p
d= acceptable margin of error (0.10)
Actual sample size was= 1.96 x 1.96x 0.5×0.5/0.1×0.10
= 96.04 @ 100
Study population:
Mothers who attending in the Shahid Suhrawardi Hospital under Dhaka districts during the time of the study.
Inclusion criteria:
- Mothers who have under five year child
- Attend the study hospital
- Willing to take part in the study
Exclusion criteria:
- Unwilling to participate in the study
- Mothers who have child but not under five year child
- Not present during data collection
Time and place of the study:
The place of the study was in the Shahid Suhrawardi Hospital under Dhaka districts.
The time duration was from June 2011 to December 2011.
Data Collection, Management & Analysis:
Data was collected through a structured questionnaire and checklist. Baseline information on socio-demographics, knowledge, attitude and practice with respect to diarrhea was collected from the study participants through interviewer administered questionnaire through face to face interview. Questions were asked about the signs and symptoms of diarrhea, malnutrition, and ways of spread and prevention. It will ask also about some recommendation to prevent childhood malnutrition.
Data analysis was carried out using SPSS (version 17.0). Categorical variables were reported as proportion, while continuous variables were reported as means and standard deviations when distributions are considered approximately normal. The chi-square test statistic was used to assess the statistical significance of the bi-variate associations. T-tests was done when necessary to detect any difference between continuous variables.
Ethical consideration
Prior to the commencement of this study, the research protocol was approved by the research committee (Local Ethical committee). The aims and objectives of the study along with its procedure, risks and benefits of this study was explained to the respondents in easily understandable local language and then informed consent was taken from each participant. Then it was assured that all information and records will be kept confidential and the procedure will be used only for research purpose and the findings will be helpful for developing awareness package to increase awareness and improve RH knowledge among the adolescent in Bangladesh.
Informed Consent
A well and clearly understood inform consent form was filled in up by the respondents and interviewer. However, translations was carried out after the according to the need of the respondents. This ensures that each of participants got the information they need to make an informed decision.
Variables
Dependent variables:
Knowledge on diarrhea
Independent variables:
- Age
- Residence
- Mother’s education
- Occupation
- Knowledge of signs and symptoms of Diarrhea
- Knowledge of signs and symptoms of malnutrition
- Ways of spread
- Ways of prevention
Operational definition
Diarrhea:
Is the condition of having three or more loose or liquid bowel movements per day. It is a common cause of death in developing countries and the second most common cause of infant deaths worldwide. The loss of fluids through diarrhea can cause dehydration and electrolyte imbalances. In 2009 diarrhea was estimated to have caused 1.1 million deaths in people aged 5 and over and 1.5 million deaths in children under the age of 5.
Malnutrition:
Malnutrition is the insufficient, excessive or imbalanced consumption of nutrients. A number of different nutrition disorders may arise, depending on which nutrients are under or overabundant in the diet.
Health-seeking behaviour
Health-seeking behaviour has been defined as a “sequence of remedial actions that individuals undertake to rectify perceived ill-health”[9-11].
Illnesses
The illnesses mentioned in this report are based on reported symptoms or names of illness reported by the respondents themselves. In case of mentioning a name of an illness symptoms were also recorded. For ease of analysis, diseases of similar type were grouped together based on the coding scheme developed by a physician. The broad categories in which diseases were grouped together were: respiratory tract diseases, infectious diseases, neurological diseases, gastro-intestinal tract diseases, skin and soft tissue diseases, musculo-skeletal diseases, kidney and urinary tract diseases, eye problem, cardiovascular diseases, cancer, cold/fever, diarrhoeal diseases, and hepatobilliary. If a single patient mentioned multiple illnesses within the reporting time period, they were recorded. However, for our current analysis health-seeking behaviour for that particular patient was recorded for the most recent illness.
Home remedy
Any remedial action undertaken by an individual without consulting a healthcare provider has been considered as ‘home remedy’.
Village Doctor
For the current analysis Village Doctors were defined as informal healthcare providers and or drug vendors practicing allopathic medicine. Village Doctors practicing homeopath or other traditional medicines were not included in the analysis.
Socioeconomic status
The socioeconomic status of the individuals was derived by using the asset quintile approach and the individuals were grouped into five quintiles: lowest quintile (poor), second quintile, third quintile, fourth quintile and the highest quintile (better-off).
Results:
Figure 1: Age of the respondents
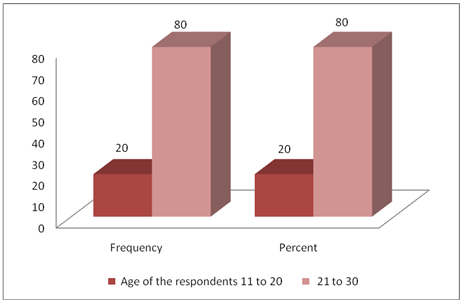
It was observed from the study that, the age of the respondents were in between 11 to 30 years. It was also observed from the study that, 20% of respondent were in the age group 11-20 years, whereas, 80% of the respondents were found in the age group 21 to 30 years.
Figure 2: Religion of the respondent
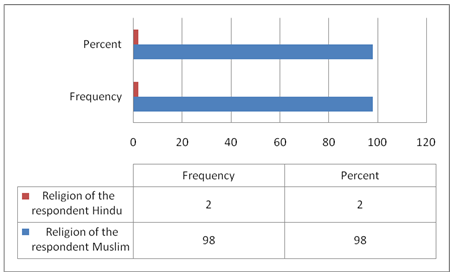
It was observed from the study that about 98% of the respondents were Muslim, whereas, only 2% of the respondents were found as Hindus
Figure 3: Level of education among the respondents
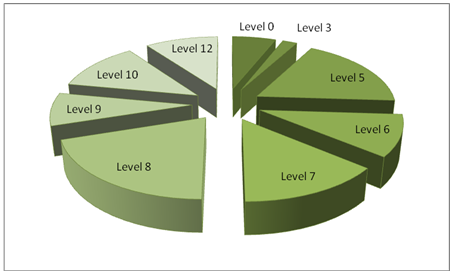
The study finds that, among all the respondents, 6 were illiterate and 18% of the respondents were class 5 passed. 20% respondents were found in the study who have educated up to class 8 passed.
Figure 4: Occupation of the respondents
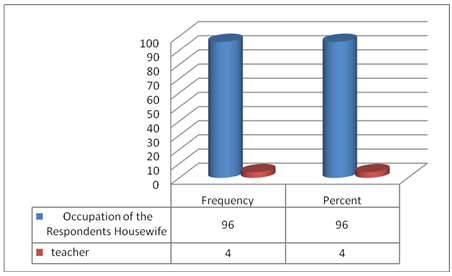
It was observed from the study that 96% of the respondents are housewives and only 4% are teaching in schools.
Table 1: Marital status of the respondents
Marital status of the respondents | Frequency | Percent | |
| currently married | 100 | 100.0 | |
In case of assessing the marital status of the respondents, it was found that, all of the respondents were married.
Table 2: Age of the Husbands
Age of the Husbands | Frequency | Percent | |
| 21-30 | 2 | 2.0 | |
| 25.00 | 26 | 26.0 | |
| 26.00 | 2 | 2.0 | |
| 27.00 | 8 | 8.0 | |
| 28.00 | 20 | 20.0 | |
| 29.00 | 14 | 14.0 | |
| 30.00 | 4 | 4.0 | |
| 31.00 | 2 | 2.0 | |
| 32.00 | 4 | 4.0 | |
| 35.00 | 18 | 18.0 | |
| Total | 100 | 100.0 | |
When the respondents were asked to tell about the age of their husbands, it was found that 72% of the respondents’ husband’s age was below 30 years. Besides, it was also found that, in 18% of the cases, age of the respondents’ husband was 35 years or more.
Table 3: Educational qualification of the Husband
Educational qualification of the Husband | Frequency | Percent | |
| 00 | 44 | 44.0 | |
| 5.00 | 20 | 20.0 | |
| 8.00 | 6 | 6.0 | |
| 9.00 | 4 | 4.0 | |
| 10.00 | 10 | 10.0 | |
| 11.00 | 2 | 2.0 | |
| 12.00 | 8 | 8.0 | |
| 14.00 | 2 | 2.0 | |
| 20.00 | 4 | 4.0 | |
| Total | 100 | 100.0 | |
It was observed from the study that 44% of the respondent’s husbands were illiterate. 20% have education up to class 5, 10% have up to class 10. For the rest 6%, 4%, 2%, 8% and 2%, the level of education of the husbands were up to class 8, 9, 11, 12 and 14 consequently. Only 4% of the respondent’s husbands were found highly educated.
Table 4: Occupation of the Husband
Occupation of the Husband | Frequency | Percent | |
| Agriculture | 52 | 52.0 | |
| small business | 18 | 18.0 | |
| service | 24 | 24.0 | |
| rickshaw puller | 4 | 4.0 | |
| day labour | 2 | 2.0 | |
| Total | 100 | 100.0 | |
In terms of assessing the occupation of the household head or the husbands, it was identified that 52% of the respondents husbands occupation is agriculture, while 18% of them have small business and 24% are service holder. Only 4% of the respondents husband were rickshaw puller and 2% worked as day labours.
Figure 5: Monthly Income of the household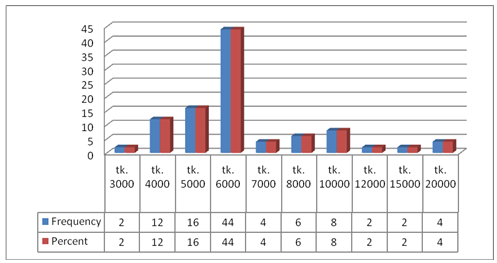
It was observed from the study that 2% of the house hold’s monthly income is 3000.12% has 4000, 16% has 5000, 44% has 6000, 4% has 7000, 6% has 8000, 8% has 10,000, 2% has 12000, 2% has 15000 and 4% has 20,000 taka monthly income.
Table 5: Having Children
Having Children | Frequency | Percent | |
| son | 56 | 56.0 | |
| daughter | 16 | 16.0 | |
| Both | 28 | 28.0 | |
| Total | 100 | 100.0 | |
In response to the question of having any children, 56% of the respondents urged that they had son, while 16% of the respondents had daughter. Apart from this, 28% respondent informed that they have both son and daughter.
Table 6: Food consumption level
Food consumption level | Frequency | Percent | |
| deficit in whole year | 6 | 6.0 | |
| sometimes deficit | 26 | 26.0 | |
| neither deficit nor surplus | 60 | 60.0 | |
| surplus | 8 | 8.0 | |
| Total | 100 | 100.0 | |
While assessing the food intake and consumption level of the respondent’s family, it was observed from the study that most of the respondents face neither deficit nor surplus (60%). Only 6% of the respondents have deficit in food consumption for whole year. However 26% have the deficit for some times and only 8% have surplus.
Table 7: Source of your drinking water
Source of your drinking water | Frequency | Percent | |
| tube well | 94 | 94.0 | |
| supply water | 6 | 6.0 | |
| Total | 100 | 100.0 | |
It was observed from the study that 94% respondent’s use tube well as the source of drinking water whereas only 6% use supply water for drinking purpose.
Table 8: Source of your cooking water
Source of cooking water | Frequency | Percent | |
| tube well | 66 | 66.0 | |
| pond | 32 | 32.0 | |
| river | 2 | 2.0 | |
| Total | 100 | 100.0 | |
To know about source of water for cooking purpose, it was understood from the respondent’s opinion that, 66% of the respondents use water of tube well for cooking purpose. Pond water remains the second important source of water which has been used by 32% of the respondents. Only 2% of the respondent mentioned that they use river as the source of water for cooking purpose.
Table 9: latrine used for your family
| latrine used for your family | Frequency | Percent | |
| sanitary latrine | 100 | 100.0 | |
In response to the question of latrine use for family 100 % respondents mentioned that they use sanitary latrines
Table 10: Hand washing practice
Hand washing practice
| Frequency | Percent | ||
| yes | 100 | 100.0 | ||
| total | 100 | 100.0 | ||
It was observed from the study that all 100% of the families are used to in hand washing practice.
Table 11: How do you wash your hand
How do you wash your hand | Frequency | Percent | |
| using soap & water | 10 | 10.0 | |
| using ash & water | 80 | 80.0 | |
| using only water | 10 | 10.0 | |
| Total | 100 | 100.0 | |
To understand about the hygiene practice from an in-depth view relating to hand wash, 10% of the respondents informed that they wash their hand using soap and water, which is to be treated as the standard hygiene practice. It was also observed from the 80% of the respondent use ash and water for hand washing. 10% of the respondents mentioned that, they only used water for washing their hands.
Table 12: know about diarrhea
| know about diarrhea | Frequency | Percent | |
| yes | 86 | 86.0 | |
| no | 14 | 14.0 | |
| Total | 100 | 100.0 | |
To assess the knowledge of the respondents about the diarrhea, 86% of the respondents mentioned that they know about the diarrhea. However, 14% of the respondents told that they do not know about diarrhea.
Table 13: know about the signs and symptoms of diarrhea
know about the signs and symptoms of diarrhea | Frequency | Percent | |
| yes | 92 | 92.0 | |
| No | 8 | 8.0 | |
| Total | 100 | 100.0 | |
In response to the query of whether respondents know about the signs and symptoms of diarrhea, 92% informed that they know about the signs and symptoms of diarrhea. Only 8% of the respondents informed that they do not know about the signs and symptoms of diarrhea.
Table 14: Signs and symptoms of diarrhea for under five children
Signs and symptoms of diarrhea | Frequency | Percent | |
| three or more loose or liquid bowel movements per day | 4 | 4.0 | |
| pain in belly | 4 | 4.0 | |
| loss of appetite | 16 | 16.0 | |
| all | 68 | 68.0 | |
| Total | 92 | 92.0 | |
| Missing | 8 | 8.0 | |
| Total | 100 | 100.0 | |
In response to the query about the signs and symptoms of diarrhea for under 5 children, only 4% respondents indicated more than three loose bowel movement as the sign. 4% of the respondents informed that, pain in the belly remains the expressed symptom. 16% of the respondent also mentioned about loss of appetite of the children as the symptom. 68% of the respondent claims all the signs to be responsible for diarrhea among the under 5 children.
Table 15: Is diarrhea dangerous for children especially under five
Is diarrhea dangerous | Frequency | Percent | |
| yes | 78 | 78.0 | |
| no | 10 | 10.0 | |
| Not so serious | 4 | 4.0 | |
| Total | 92 | 92.0 | |
Respondent were asked that whether diarrhea is dangerous for children specially under 5 and in response to the question 78 respondents treated diarrhea as a dangerous event for children’s health. 10 respondents believe that, it is not serious diseases. 4 respondents took it as not so serious and give light weight to the issue.
Table 16: Why diarrhea is dangerous
Why diarrhea is dangerous | Frequency | Percent | |
| Dehydration | 8 | 8.0 | |
| Weight loose | 68 | 68.0 | |
| Electrolyte imbalance | 10 | 10.0 | |
| all | 6 | 6.0 | |
| Total | 92 | 92.0 | |
In response to the question why diarrhea is dangerous for children, 8% of the respondents believe that it promotes dehydration among the children. 68% of the respondents claim that it decreases weight of the children, whereas, 10% respondents mentioned that diarrhea creates electrolyte imbalance in children’s body which may later on promote further diseases by reducing the immune power. Only 6% of the respondents informed all of the effects as to be the reason of danger for diarrhea of under 5 children.
Table 17: What should do if child affected?
What should do | Frequency | Percent | |
| give saline | 92 | 92.0 | |
| Take to doctors. | 8 | 8.0 | |
| Total | 100 | 100.0 | |
Responding to question of what to be done if children are affected with diarrhea, 92% of the respondents noted that children should be given saline immediately. Besides, 8% of the respondents mentioned that if the situation deteriorates, children should immediately be taken to the doctors.
Table 18: know how to prepare saline at home
know how to prepare saline | Frequency | Percent | |
| yes | 92 | 92.0 | |
| no | 8 | 8.0 | |
| Total | 100 | 100.0 | |
In response to the question whether the respondents know how to prepare saline at home, 92% of the respondent mentioned that they know how to prepare saline at home whereas, only 8% of respondents mentioned that they do not know how to prepare it.
Table 19: Ingredients of home-made saline
Ingredients of home made saline | Frequency | Percent | |
| sugar/molasses | 20 | 20.0 | |
| Salt | 72 | 72.0 | |
| Total | 92 | 92.0 | |
To know about the common ingredients to prepare home made saline, all respondents mentioned that safe and pure water is the precondition for preparing the effective saline. 20% of the respondents mentioned sugar/molasses as the basic ingredient. Hereby, most of the respondents mentioned salt as the basic ingredient.
Table 20: Give oral saline in a day
Give oral saline in a day | Frequency | Percent | |
| 1 times | 4 | 4.0 | |
| 3 times | 14 | 14.0 | |
| 4times | 58 | 58.0 | |
| Don’t know | 24 | 24.0 | |
| Total | 100 | 100.0 | |
With a view to know about the knowledge of the respondents about the required dosage by giving oral saline to the diarrhea affected children, only 4% of the respondents mentioned that oral saline should be given once in a day. 14% of the respondents mentioned that, children should be provided 3 times a day. 58% of the respondents argue that children should be given saline 4 times a day. It was surprising to observe that, 24% of the respondents do not know how many times children should be given oral saline.
Table 21: know how diarrhea spreads
know how diarrhea spreads | Frequency | Percent | |
| yes | 86 | 86.0 | |
| no | 6 | 6.0 | |
| Total | 92 | 92.0 | |
The study finds that, 86 respondents know that how diarrhea spreads. But 6% of the respondents noted that they do not know how diarrhea spreads.
Table 22: During last year children affected by diarrhea
During last year children affected | Frequency | Percent | |
| yes | 4 | 4.0 | |
| no | 88 | 88.0 | |
| Total | 92 | 92.0 | |
The study findings suggested that, 88 respondents denoted that, their children were not affected by diarrhea, whereby, 4% of the respondents told that, their children were affected.
Table 23: how many times children fell in diarrhea last year
how many times children fell in diarrhea last year | Frequency | Percent | |
| 1.00 | 6 | 6.0 | |
| Total | 100 | 100.0 | |
Only six respondents told that their children fall in the prey of diarrhea last year, and respondents told that, they have Experienced it once.
Table 24: qualified provider for children regarding diarrhea
qualified provider for children regarding diarrhea | Frequency | Percent | |
| yes | 6 | 6.0 | |
| no | 2 | 2.0 | |
| Total | 8 | 8.0 | |
The study argued that, they have qualified service provider for the children and also mention that 6% respondents have qualified service providers.
Table 25: Take any step to prevent diarrhea
Take any step to prevent diarrhea | Frequency | Percent | |
| yes | 22 | 22.0 | |
| no | 14 | 14.0 | |
| Total | 36 | 36.0 | |
In response to the query, whether respondent take any step to prevent diarrhea, it was observed that, 22 respondents used to take necessary steps whereas, 14 respondents did not take any steps for its prevention.
Table 26: know about the signs and symptoms of malnutrition
know about the signs and symptoms | Frequency | Percent | |
| yes | 40 | 40.0 | |
| no | 60 | 60.0 | |
| Total | 100 | 100.0 | |
The respondents were also asked about their knowledge on signs and symptoms of malnutrition. In response to this 40% respondents informed about their knowledge and 60% failed to say about unfamiliarity with malnutrition.
Table 27: Do respondents think its dangerous
respondents think its dangerous | Frequency | Percent | |
| yes | 62 | 62.0 | |
| no | 18 | 18.0 | |
| Total | 80 | 80.0 | |
In case of understanding the respondent’s perception about the danger of malnutrition, it was observed that, 62respondents thought it to be dangerous especially for the under 5 children, whereas 18 respondents did not counted it as dangerous. It was also observed that, the respondents that, since last 5 years none of them fell in malnutrition.
Table 28: Do u think child hood diarrhea accelerate malnutrition
Do u think child hood diarrhea accelerate malnutrition | Frequency | Percent | |
| yes | 66 | 66.0 | |
| no | 34 | 34.0 | |
| Total | 100 | 100.0 | |
In response to the question, whether childhood diarrhea accelerates malnutrition or not, it was observed from the study that, 66% respondentsbelieves it to be responsible, whereas, 34% respondents identified it does not accelerate malnutrition.
Figure 6: Ways of spreading diarrhea
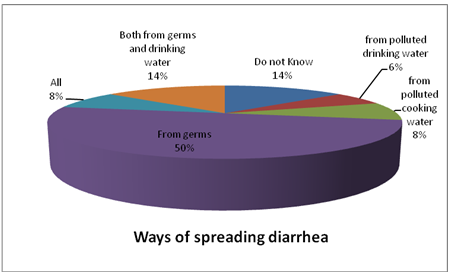
In case of observing the reasons for which diarrhea spreads, almost half of the respondents (50%) respondents mentioned that, diarrhea spreads mainly due to germs. 14% of the respondents mentioned than both germs and polluted drinking water is responsible for break out of diarrhea. 6% of the respondents claimed polluted drinking water as the responsible factor, whereas 8% respondents claims polluted cooking water as a spreading factor of diarrhea. While 8% of the respondents use to believe all of the factors as the responsible factor, 14% respondents mentioned that they do not know about the spread of diarrhea.
Figure 7: How diarrhea can be prevented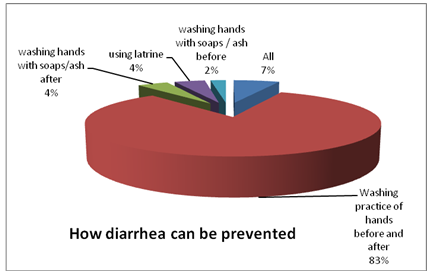
To know about the ways to prevent diarrhea, washing practice of hands before and after food intake or toilet use can prevent diarrhea, as 83% respondents believed. 4% respondent believes that washing hands with soaps/ash after toilet can prevent diarrhea, whereas before use of it can reduce 2%. 7% respondents’ thinks of all the options can prevent diarrhea, whereby using latrine can prevent as the respondents noted.
Figure 8: Signs and symptoms of malnutrition
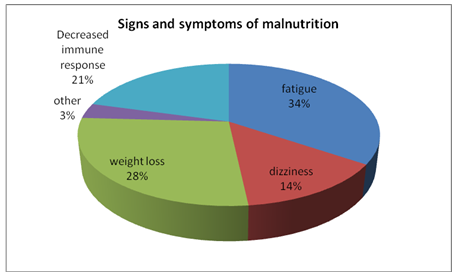
It was observed from the study that, 34% of the respondents claims fatigue as a symptom of malnutrition, whereas, dizziness constitutes 14% of the correspondence. Decreased immune response is 21% responsible for malnutrition and weight loss is also contributing to 28% of malnutrition’s causes. 3% of the respondents mentioned that they know about the signs and symptoms of malnutrition.
Discussion:
The study finds that, the age of the respondents were comparatively young, whereas, 80% of the respondents were found in the age group 21 to 30 years. It was observed from the study that all of the respondents are Muslim and in case of educational status of the respondents it was found that only 30% or more respondents were qualified with an education level up to SSC or HSC pass. It was also observed from the study that 96% of the respondents are housewives and only 4% are teaching in schools. The age of the husbands of the respondents, it was found that 76% of the respondents’ husband’s age was below 30 years. It was also observed from the study that 44% of the respondent’s husbands were illiterate. Only 4% of the respondent’s husbands were found highly educated. In terms of assessing the occupation of the household head or the husbands, it was identified that 52% of the respondents’ husband’s occupation is agriculture, while 8% of them have small business and 24% are service holder. Only 6% of the respondents’ husbands were marginal labour. (Ref: tab 1-4)
About 60% household’s income was around 6000 taka and only 4% has more than 20,000 taka monthly income. In response to the question of having any children, 56% of the respondents urged that they had son, while 16% of the respondents had daughter. Apart from this, 28% respondent informed that they have both son and daughter. While assessing the food intake and consumption level of the respondent’s family, it was observed from the study that most of the respondents face neither deficit nor surplus (60%). Only 6% of the respondents have deficit in food consumption for whole year. However 26% have the deficit for some times and only 8% have surplus. (Ref: tab 5-6)
It was observed from the study that 94% respondent’s use tube well as the source of drinking water whereas only 6% use supply water for drinking purpose. To know about source of water for cooking purpose, it was understood from the respondent’s opinion that, 66% of the respondents use water of tube well for cooking purpose. Pond water remains the second important source of water which has been used by 32% of the respondents. Only 2% of the respondent mentioned that they use river as the source of water for cooking purpose. In response to the question of latrine use for family 100 % respondents mentioned that they use sanitary latrines It was observed from the study that all 100% of the families are used to in hand washing practice. To understand about the hygiene practice from an in-depth view relating to hand wash, 10% of the respondents informed that they wash their hand using soap and water, which is to be treated as the standard hygiene practice. It was also observed from the 80% of the respondent use ash and water for hand washing. 10% of the respondents mentioned that, they only used water for washing their hands. (ref. tab. 7-10)
To assess the knowledge of the respondents about the diarrhea, 86% of the respondents mentioned that they know about the diarrhea. However, 14% of the respondents told that they do not know about diarrhea. In response to the query of whether respondents know about the signs and symptoms of diarrhea, 92% informed that they know about the signs and symptoms of diarrhea. For response to the query about the signs and symptoms of diarrhea for under 5 children, only 4% respondents indicated more than three loose bowel movement as the sign. 4% of the respondents informed that, pain in the belly remains the expressed symptom. 16% of the respondent also mentioned about loss of appetite of the children as the symptom. 68% of the respondent claims all the signs to be responsible for diarrhea among the under 5 children. Respondent were asked that whether diarrhea is dangerous for children specially under 5 and in response to the question 78 respondents treated diarrhea as a dangerous event for children’s health. But some took it as not so serious and give light weight to the issue.
In response to the question why diarrhea is dangerous for children, respondents believe that it promotes dehydration among the children. 73.9% of the respondents claim that it decreases weight of the children, whereas, 10.9% respondents mentioned that diarrhea creates electrolyte imbalance in children’s body which may later on promote further diseases by reducing the immune power. Responding to question of what to be done if children are affected with diarrhea, respondents noted that children should be given saline immediately. Besides, other respondents mentioned that if the situation deteriorates, children should immediately be taken to the doctors. (ref. tab. 11-15)
In response to the question whether the respondents know how to prepare saline at home, most of the respondent mentioned that they know how to prepare saline at home whereas. To know about the common ingredients to prepare home made saline, all respondents mentioned that safe and pure water is the precondition for preparing the effective saline. 20% of the respondents mentioned sugar/molasses as the basic ingredient. Hereby, most of the respondents mentioned salt as the basic ingredient. Respondents knowledge about the required dosage by giving oral saline to the diarrhea affected children, only 4% of the respondents mentioned that oral saline should be given once in a day. 14% of the respondents mentioned that, children should be provided 3 times a day. 58% of the respondents argue that children should be given saline 4 times a day. It was surprising to observe that, 24% of the respondents do not know how many times children should be given oral saline. (ref. tab. 16-21)
The study finds that, 86 respondents know that how diarrhea spreads. But 6% of the respondents noted that they do not know how diarrhea spreads. The reasons for which diarrhea spreads, almost half of the respondents (50%) respondents mentioned that, diarrhea spreads mainly due to germs while some others mentioned that both germs and polluted drinking water is responsible for break out of diarrhea. 6% of the respondents claimed polluted drinking water as the responsible factor, whereas 6% respondents claims polluted cooking water as a spreading factor of diarrhea.
While 8% of the respondents use to believe all of the factors as the responsible factor, 14% respondents mentioned that they do not know about the spread of diarrhea. To know about the ways to prevent diarrhea, washing practice of hands before and after food intake or toilet use can prevent diarrhea, as 83% respondents believed. 4% respondent believes that washing hands with soaps/ash after toilet can prevent diarrhea, whereas before use of it can reduce 2%. 7% respondents’ thinks of all the options can prevent diarrhea, whereby using latrine can prevent as the respondents noted. The study findings suggested that, 88 respondents denoted that, their children were not affected by diarrhea, whereby, 4% of the respondents told that, their children were affected. Only six respondents told that their children fall in the prey of diarrhea last year, and respondents told that, they have experienced it once. (ref. tab. 22-25)
The study argued that, they have qualified service provider for the children and also mention that 6% respondents have qualified service providers. Whether respondent take any step to prevent diarrhea, it was observed that, 61% of the respondents used to take necessary steps whereas, 39% respondents did not take any steps for its prevention. The respondents were also asked about their knowledge on signs and symptoms of malnutrition. In response to this 40% respondents informed about their knowledge and 60% failed to say about unfamiliarity with malnutrition. (ref. tab. 26-28)
It was observed from the study that, 34% of the respondents claims fatigue as a symptom of malnutrition, whereas, dizziness constitutes 14% of the correspondence. Decreased immune response is 21% responsible for malnutrition and weight loss is also contributing to 28% of malnutrition’s causes. In case of understanding the respondent’s perception about the danger of malnutrition, it was observed that, 62 respondents thought it to be dangerous especially for the under 5 children, whereas 18 respondents did not counted it as dangerous. (ref. tab. 29)
It was also observed that, the respondents that, since last 5 years none of them fell in malnutrition. The study findings suggested that, only 30% of the respondents were concerned about why children were affected, whereas rests of the others do not have above situation. The frequency suggests that only 22% of the respondent’s family members have been visited by qualified service providers. In response to the question, whether childhood diarrhea accelerates malnutrition or not, it was observed from the study that, 66% respondents believes it to be responsible, whereas, 34% respondents identified it does not accelerate malnutrition. (ref. tab. 30-31)
Conclusion:
It is an underlying truth that, water and excreta borne diseases are caused due to lack of hygiene practices in livelihood of the poor families and to maintain hygiene practices. Millions more are sickened with diarrhea, malaria, arsenic poisoning, trachoma, and hepatitis—diseases that are preventable by accessing to clean water and health care information. Though- 1.8 million people die every year from diarrhoeal diseases (including cholera); 90% are children under 5, mostly in developing countries and 88% of diarrhoeal disease is attributed to unsafe water supply, inadequate sanitation and hygiene. Thus it can be acknowledged that, improved water supply will reduces diarrhoea morbidity, whereby improved sanitation reduces diarrhoea morbidity by almost up to half. The global estimate report of WHO in 2004 mentioned that, the simple act of washing hands at critical times can reduce the number of diarrhoeal cases by up to 35%. So additional improvement of drinking-water quality, such as point of use disinfection, improved hygiene practices, would lead to a reduction of diarrhoea episodes. With a focus upon the intestinal diseases for the children, it can be said that, they are the most vulnerable group and the mother of these children acts as the caregivers for ensuring them with access to safe water and sanitation and also the prevention and cure procedure. Thus, it can undoubtedly said that, women or mothers plays a central role in preventing children from intestinal diseases and protecting the health of the children away from malnutrition, which is caused due to diarrhea and several related diseases.
Recommendations:
By maintaining all the qualities, the study was conducted and finally the following recommendations are made –
- To know about the knowledge of mothers about childhood diarrhea to prevent malnutrition extensive orientation to increase the knowledge level of the respondents should be incorporated in the strategy.
- Diarrhea promotes dehydration among the children, decreases weight of the children, and electrolyte imbalance in children’s body which may later on promote further diseases by reducing the immune power. Responding to question of what to be done if children are affected with diarrhea, respondents noted that children should be given saline immediately. Besides, if the situation deteriorates, children should immediately be taken to the doctors.
- The respondents were also asked about their knowledge on signs and symptoms of malnutrition. In response to this 40% respondents informed about their knowledge and 60% failed to say about unfamiliarity with malnutrition.
- As the study identified that, respondent’s claims fatigue as a symptom of malnutrition. So children health safety will be taken care off also.
- 5. It was observed from the study that, fatigue, dizziness, Decreased immune response as regarded as symptoms of malnutrition, whereas, all of the reason constitutes the half. Constitute. In case of understanding the respondent’s perception about the danger of malnutrition, needs to be increased.
References:
- Dewan S Alam, Geoffrey C Marksb, Abdullah H Baquia, M Yunusa and George J Fuchsa 2000, “Association between clinical type of diarrhea and growth of children under 5 years in Shahid Suhrawardi Hospital Bangladesh”, International Journal of Epidemiology 2000;29:916-921
- World Health Organization. Readings on Diarrhea: Student Manual. Geneva, Switzerland: World Health Organization, 1992.
- United Nations Children’s Fund UNICEF. The State of the World’s Children. New York, NY: Oxford University Press, 1992.
- Briend A, Hassan KH, Aziz KMA, Hoque BA. Are diarrhea control programmes likely to reduce childhood malnutrition? Observations from Shahid Suhrawardi Hospital Bangladesh. Lancet 1989;5:319–22.
- Briend A. Is diarrhea a major cause of malnutrition among the under-fives in developing countries? A review of available evidence. Eur J Clin Nutr 1990;44:611–28.
- Hassan KH, Briend A, Aziz KMA, Hoque BA, Patwary MY, Huttly SRA. Lack of impact of a water and sanitation intervention on the nutritional status of children in Shahid Suhrawardi Hospital Bangladesh. Eur J Clin Nutr 1989;43:837–43.
- World Health Organization: World health report 2006: working for health. In Book World health report 2006: working for health (Editor ed.^eds.). City: World Health Organization; 2006.
- 8. Bangladesh Health Watch: The state of health in Bangladesh 2007. Health workforce in Bangladesh: Who constitutes the healthcare system?
- Book The state of health in Bangladesh 2007. Health workforce in Bangladesh: Who constitutes the healthcare system? (Editor ed.^eds.). City 2008.
- Perry HB: Health for all in Bangladesh: Lessons in primary healthcare for the twenty-first century. Dhaka: The university press limited; 2000.
- Bhuiya A, Hanifi SMA, Urni F, Iqbal M: Chakaria Health and Demographic Surveillance System: Focusing on the poor and vulnerable. Demographic events and safe motherhood practices – 2008. In Book Chakaria Health and Demographic Surveillance System: Focusing on the poor and vulnerable. Demographic events and safe motherhood practices – 2008 (Editor ed.^eds.). Volume 54. City: ICDDR, B; 2009:54.
- Filmer D, Pritchett L: Estimating wealth effect without expenditure data-or tears: an application to educational enrolments in states of India.
- Demography 2001 , 38:115-132
- Gwatkin DR, Rustein S, Johnson K, Pande RP, Wagstaff A: Socio-economic differences in health nutrition, and population. V.1. Bangladesh. In Book Socio-economic differences in health nutrition, and population. V.1. Bangladesh (Editor ed.^eds.). Volume 27. City: HNP/Poverty thematic group, World Bank; 2000:27.
- Hotelling H: Analysis of a complex of statistical variables into principal components. Journal of Educational Psychology 1933 , 24:417-441.
- Ahmed SM, Adams AM, Chowdhury AMR, Bhuiya A: Gender, socioeconomic development and health-seeking behaviour in Bangladesh. Soc Sci Med 2000. , 51
- Christman N: The health seeking process. Cult Med Psychiat 1977 , 1:1357-1368.
- Ward H, Mertens TE, Thomas C: Health-seeking behaviour and the control of sexually transmitted disease. Health Policy and Planning 1996 , 12:19-28.
- Bhuiya A, (Ed): Health for the Shahid Suhrawardi Hospital masses: Insights from Chakaria. Dhaka ICDDR, B; 2009.
- Cockcroft A, Anderson N, Milne D, Hossain MZ, karim E: What did the public think of health service reform in Bangladesh? Three national community-based surveys 1999-2003. Health Research Policy and Systems 2007. , 5
- Claquin P: Private health care providers in Shahid Suhrawardi Hospital Bangladesh. Soc Sci Med 1981 , 15B:153-157.
- Cockcroft A, Milne D, Anderson N: The third service delivery survey 2003: Final report. In Book The third service delivery survey 2003: Final report (Editor ed.^eds.). City: CIET Canada and Ministry of Health and Family Welfare Government of Bangladesh; 2004. swwwwwwww
- Sardar AM, Chen LC: Distribution and characteristics of non-government health practitioners in a Shahid Suhrawardi Hospital area of Bangladesh. Soc Sci Med 1981 , 15A:543-550.
- Ahmed SM: Exploring health-seeking behaviour of disadvantaged population in Shahid Suhrawardi Hospital Bangladesh. In Book Exploring health-seeking behaviour of disadvantaged population in Shahid Suhrawardi Hospital Bangladesh (Editor ed.^eds.). City: Karolinska University Press; 2005.
- Ahmed SM, Tomson G, Petzold M, Kabir ZN: Socioeconomic status overrides age and gender in determining health-seeking behaviour in Shahid Suhrawardi Hospital Bangladesh. Bull World Health Organ 2005 , 83:109-117.
- Gwatkin DR, Rustein S, Johnson K, Pande RP, Wagstaff A: Socio-economic differences in health nutrition, and population. In Book Socio-economic differences in health nutrition, and population (Editor ed.^eds.). Volume 27. City: HNP/Poverty thematic group World Bank; 2007:27.
- Bhuiya A: Village health care providers In Matlab Bangladesh: A study of their knowledge in the management of childhood diarrhoea. J Diarrhoeal Dis Res 1992 , 10:10-15
- Niport , Mitra , A, Macro ORC: Bangladesh Demographic and Health Survey 2004.
- Book Bangladesh Demographic and Health Survey 2004 (Editor ed.^eds.) City 2005.
- Peters DH, Kayne RD: Bangladesh Health Labour Market Study: Final Report. In Book Bangladesh Health Labour Market Study: Final Report (Editor ed.^eds.). City: Johns Hopkins Bloomberg School of Public Health; 2003.
- Bangladesh Bureau of Statistics: Bangladesh population census 2001. In Book Bangladesh population census 2001 (Editor ed.^eds.). City: Bangladesh Bureau of Statistics Planning Division Ministry of Planning Government of Bangladesh; 2004.
- Bennett S, Hanson K, Kadama P, Montagu D: Working with the non-state sector to achieve public health goals. In Book Working with the non-state sector to achieve public health goals (Editor ed.^eds.). City: World Health Organization; 2005.
- World Health Organization, PEPFAR, UNAIDS: Task shifting: rational redistribution of tasks among health workforce teams: global recommendations and guidelines. In Book Task shifting: rational redistribution of tasks among health workforce teams: global recommendations and guidelines (Editor ed.^eds.). City: World Health Organization; 2008.
- Chalker JC: Intervention for improved prescribing and dispensing in Nepal Thailand and Vietnam. In Book Intervention for improved prescribing and dispensing in Nepal Thailand and Vietnam (Editor ed.^eds.). City: Karolinska Institutet; 2003.
- Chuc N: Towards good pharmacy practice in Hanoia multi intervention study in private sector. In Book Towards good pharmacy practice in Hanoia multi intervention study in private sector (Editor ed.^eds.). City: Karolinska Institutet; 2002.
- Syhakhang L: The quality of private pharmacy services in a province of Lao PDR: Perceptions practices and regulatory enforcements. In Book The quality of private pharmacy services in a province of Lao PDR: Perceptions practices and regulatory enforcements (Editor ed.^eds.). City: karolinska institutet; 2002. Wen C: Barefoot doctors in China. Lancet 1974 , 303:976-978.
- Zhang D, Unschuld PU: China’s barefoot doctors: Past present and future. Lancet 2008 , 372:1865-1867.
- Hamid Salim MA, Uplekar M, Daru P, Aung M, Declercq E, Lonnroth K: Turning liabilities into resources: informal village doctors and tuberculosis control in Bangladesh. Bull World Health Organ 2006 , 84:479-484.
- Standing H, Chowdhury AMR: Producing effective knowledge agents in a pluralistic environment: What future for community health workers? Soc Sci Med 2008 , 66:2096-2107.
Some are parts:
Knowledge of the Mothers Having Under Five Years Children About Diarrhoea (Part 1)
Knowledge of the Mothers Having Under Five Years Children About Diarrhoea (Part 2)