Introduction
A pharmaceutical analytical assay method needs to be very precise and accurate. It has to be well validated to have the ability to quantify drugs in samples accurately with very low limit of detection. The methods have to be robust and cost effective to make the study rational, withstand the scrutiny of regulatory affairs of national compliance monitoring authority and the criteria’s established by the international consensus (Tesfu, 2004).
Owing to increased interdependence among countries in recent times it has become necessary for results of many analytical methods to be accepted internationally. Consequently, to assure a common level of quality, the need for and use of validated methods has increased (Hartmann et al., 1998).
Analytical methods are used for product research, product development, process control and chemical quality control purposes. Each of the techniques used, chromatographic or Spectroscopic, have their own special features and deficiencies, which must be considered. Whatever way the analysis is done it must be checked to see whether it does what it was intended to do; i.e. it must be validated. Each step in the method must be investigated to determine the extent to which environment, matrix, or procedural variables can affect the estimation of analyte in the matrix from the time of collection up to the time of analysis (FDA, 2001).
A full validation requires a high workload and should therefore only start when promising results are obtained from explorative validation performed during the method development phase. The process of validating a method cannot be separated from the actual development of method conditions, because the developer will not know whether the method conditions are acceptable until validation studies are performed (Green, 1996).
1.1. Regulatory aspects
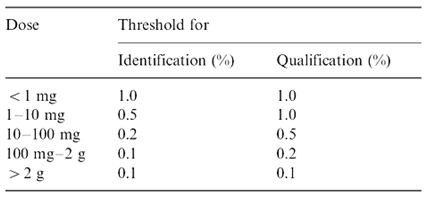
The ICH (International Conference on the Harmonization) which took place in Yokohama, Japan in 1995 has released new guidelines on impurities in new drug products. These guidelines have a number of advantages, both for the industry and the regulators. The most critical aspect of the elaboration of the guidelines was the definition of the levels of impurities for identification and qualification. Qualification is the process of acquiring and evaluating data for establishing the biological safety of an individual impurity or a given impurity profile at the levels specified. The level of any impurity present in a new drug substance that has been adequately tested in safety and clinical studies is considered qualified. A rationale for selecting impurity limits based on safety considerations has to be provided (Rao et al., 2003).
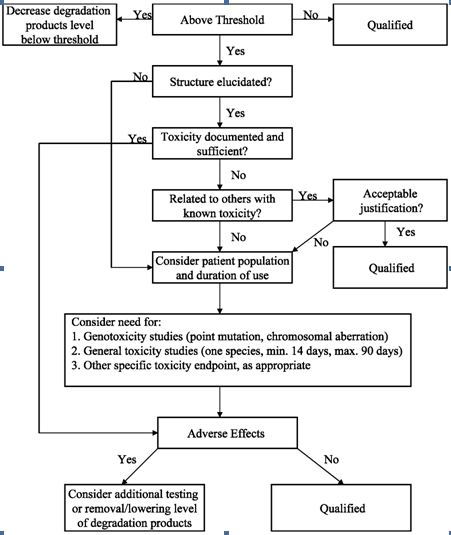
Analytical procedures should be able to separate all the impurities from each other and the method should be optimized to separate and quantify them in the dosage forms. Such methods are to be validated demonstrating the accuracy, precision, and specificity, limit of detection, quantification, linearity, range and interferences. The validation of analytical procedures, i.e., the proof of its suitability for the intended purpose, is an important part of the registration application for a new drug. Additional peak tailing, peak resolution and analyte recoveries are important in case of chromatographic methods. The ICH has harmonized the requirements in two guidelines. The first one summarizes and defines the validation characteristics needed for various types of test procedures, the second one extends the previous text to include the experimental data required and some statistical interpretation. These guidelines serve as a basis worldwide both for regulatory authorities and industry and bring the importance of a proper validation to the attention of all those involved in the process of submission of drug master files. The analytical research and development units in the pharmaceutical industry are responsible for preparation and validation of test methods (Rao et al., 2003).
Figure 1: ICH decision tree for safety studies
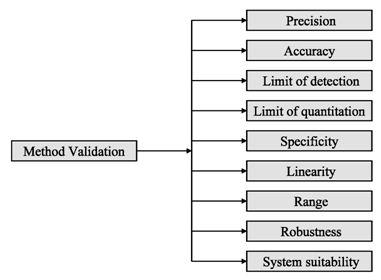
Figure 2: ICH method validation parameters
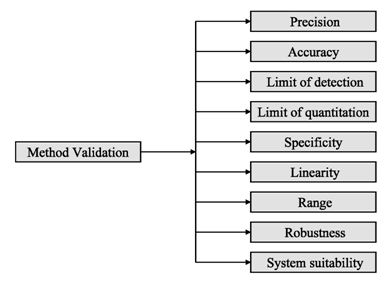
Table 1: ICH guideline for determination and quantification of impurities in bulk drugs and formulations
The monitoring of in-process impurities was an obscure and unidentified field about 20 years ago. Now it has become a major factor in modern pharmaceutical industry. This is mainly because of the pressure for product quality, and the demand for higher standards of process reliability. Toxicological issues have also brought about a greater sensitivity to the significance of impurities at trace levels. New attention has been given to the various classes of toxicants present as impurities in pharmaceutical products. In view of these changes it has become necessary to pay more attention to the origins and pathways of a host of impurities within the process. Frequently, impurities are formed as isomers of the desired reaction products and a critical impurity can often enter with the feed. Analytical recognition of the problematic compounds is the first step towards the solution of the problem. Monitoring of the process reactions often lends valuable insight into the types of impurities that may be present (Rao et al., 2003).
The purity of the final product may often be aided by controlling the purity of the materials used in its synthesis. Whenever possible, the levels of impurities originating for the starting materials should be limited through appropriate in-process controls in order to avoid the need for their monitoring in the drug substance. The use of chromatographic techniques for monitoring the starting materials, intermediates, and the process reactions is an excellent means for controlling the purity of the final drug and thereby protecting the patient who ultimately receives it. The best way to characterize the quality of a bulk drug is to determine its purity. There are two possible approaches to reach this goal. The determination of the active ingredient content with a highly accurate and precise specific method or the determination of its impurities. In the early years of drug analysis, when chromatographic techniques were not yet available the characterization of the purity of drugs was based on the determination of the active ingredient content by non-specific titrimetric and photometric method supported by the determination of physical constants and some limit tests for known impurities based mainly on colour reactions. The deficiencies of this approach are well known. In many cases even highly contaminated drug materials could meet the requirements set in the early editions of different pharmacopoeias (Rao et al., 2003).
As a consequence of the enormous development of the analytical technology in the last two decades entirely new possibilities have been created for the determination of the purity of drug materials In principle, it is now possible to replace all non-specific assay methods with highly specific and precise (mainly HPLC) methods thus greatly improving the value of the determination of the active ingredient content of bulk materials. Nearly all organic impurities are determined by chromatographic or related methods of which HPLC has been the most important for over a decade (Rao et al., 2003).
1.2. Method development and validation
Method development involves evaluation and optimization of the various stages. To start these work an extensive literature survey, reading work done on the same or similar analyte and summarizing main starting points for future work is of primary importance (Tesfu, 2004).
Method performance is determined primarily by the quality of the procedure itself. The two factors that are most important in determining the quality of the method are selective recovery and standardization. Analytical recovery of a method refers to whether the analytical method in question provides response for the entire amount of analyte that is contained in a sample. Recovery is usually defined as the percentage of the reference material that is measured, to that which is added to a blank. This should not be confused with the test of matrix effect in which recovery is defined as the response measured from the matrix (e.g. plasma) as a percentage of that measured from the pure solvent (e.g. water). Results of the experiment that compare matrix to pure solvent is referred to as relative recovery and true test of recovery is referred to as absolute recovery (Karnes et al., 1991).
An important point is that the tests performed at the stage of method development should be done with the same equipment that will actually be used for subsequent routine analysis. The differences found between individual instruments representing similar models from the same manufacturer is not surprising and should be accounted for (Bruce et al., 1998).
1.3. Method validation
The search for the reliable range of a method and continuous application of this knowledge is called validation (Bruce et al., 1998). It can also be defined as the process of documenting that the method under consideration is suitable for its intended purpose (Hartmann et al., 1998). Method validation involves all the procedures required to demonstrate that a particular method for quantitative determination of the concentration of an analyte (or a series of analytes) in a particular biological matrix is reliable for the intended application (Shah et al., 1992). Validation is also a proof of the repeatability, specificity and suitability of the method. Analytical methods must be validated if the results are used to support the registration of a new drug or a new formulation of an existing one. Validation is required to demonstrate the performance of the method and reliability of analytical results (Wieling et al., 1996). If an analytical method is claimed to be for quantitative biomedical application, then it is important to ensure that a minimum package of validation experiments has been conducted and yields satisfactory results (Causon, 1997).
Before discussing how to carry out the validation experiment, it is important to stress that validation in analysis should not be considered as an isolated field. A consensus on common terminology for all analytical fields is therefore required. For the moment it is not yet possible to propose a validation terminology that is also in agreement with the recommendations of important international organizations such as the ISO (International Standard Organization), IUPAC (International Union of Pure and Applied Chemistry) and AOAC (Association of Official Analytical Chemists), since differences exist between their documents (Hartmann et al., 1998). For the validation of pharmaceutical drug formulations the discussion on a consensus terminology is relatively advanced. It is suggested to follow in general the proposal elaborated for the validation of drug formulation by the joint initiative of the pharmaceutical industry and the regulatory agencies of the three major regulatory authorities (the European Union, the USA and Japan), the International Conference on Harmonization (ICH). According to them the revised version of terminology to be included are bias accuracy, precision, specificity, limit of detection, limit of quantification, linearity, range and stability. The term stability is also specifically considered in the validation strategy for analytical methods, which is prepared by the French group SFSTP (Societe Francaise des Sciences et Techniques Pharmaceutiques) (Hartmann et al., 1998).
On the other hand the guideline for industry by FDA (FDA, 2001) states that the fundamental parameters of validation parameters for a analytical method validation are accuracy, precision, selectivity, sensitivity, reproducibility and stability. Typical method development and establishment for analytical method includes determination of selectivity, accuracy, precision, calibration curve, and stability. For an analytical method to be considered valid, specific acceptance criteria should be set in advance and achieved for accuracy and precision for the validation of the QC samples. Validations are subdivided into the following three categories:
1.3.1. Full validation
This is the validation performed when developing and implementing an analytical method for the first time. Full validation should be performed to support pharmacokinetic, bioavailability, and bioequivalence and drug interaction studies in a new drug application (Shah et al., 2000).
1.3.2. Partial validation
Partial validations are performed when modifications of already validated analytical methods are made. Partial validation can range from as little as one intra-assay and precision determination to a nearly full validation. Some of the typical analytical method changes that fall into this category include, analytical method transfer between laboratories or analyst, change in analytical methodology, change of matrix within species, change of species within matrix (Shah et al., 2000; FDA, 2001). The decision of which parameters to be revalidated depend on the logical consideration of the specific validation parameters likely to be affected by the change made to the analytical method.
1.1.3. Cross validation
Cross validation is a comparison of validation parameters when two or more analytical methods are used to generate data within the same study or across different studies. An example of cross validation would be a situation when the original validated analytical method serves as the reference and the revised analytical method is the comparator (Shah et al., 2000; FDA, 2001).
1.3.4. Selectivity
A method is said to be selective if it produces a response for only a single analyte. Method selectivity is the ability of a method to produce a response for the target analyte distinguishing it from all other interferences. Zero level interference of the analyte is desired, but it is hardly ever the case. The main thing one must take care of is that, the response of the LLOQ standards should be greater than the response from the blank biological matrix by a defined factor. If all the efforts to get rid of interferences in the process fail, changing to a more selective detector such as Mass Spectrometry (MS) or MS-MS may give a better result (Dadgar & Burnett, 1995).
1.3.5. Accuracy
ICH guideline states that the accuracy of an analytical procedure expresses the closeness of agreement between the value which is accepted either as a conventional true value or an accepted reference value and the value found (ICH, 1996).
The accuracy of an analytical method is a measure of the systematic error or bias and is defined as the agreement between the measured value and the true value. Accuracy is best reported as percentage bias that is calculated from the expression:
% Bias = Measured Value – True Value/True Value X 100% |
Some of the possible error sources causing biased measurement are; error in sampling, sample preparation, preparation of calibration line and sample analysis. The method accuracy can be studied by comparing the results of a method with results obtained, by analysis of certified reference material (CRM) or standard reference material (SRM).
Accuracy should be measured using a minimum of five determinations per concentration. A minimum of three concentrations in the range of expected concentrations is recommended. The mean value should be within 15 % of the actual value except at LLOQ, where it should not deviate by more than 20 % (FDA, 2001).
1.3.6. Precision
The precision of an analytical method is a measure of random error and is defined as the agreement between replicate measurements of the same sample. It is expressed as the percentage coefficient of variance (% CV) or relative standard deviation (R.S.D.) of the replicate measurements (Causon, 1997).
% CV = Standard Deviation / Mean X 100%
Intra-Assay Precision
This is also known as repeatability i.e. the ability to repeat the same procedure with the same analyst, using the same reagent and equipment in a short interval of time, e.g. within a day and obtaining similar results (ICH, 1996).
Inter-Assay Precision
The ability to repeat the same method under different conditions, e.g. change of analyst, reagent, or equipment; or on subsequent occasions, e.g. over several weeks or months, is covered by the between batch precision or reproducibility, also known as inter-assay precision.
The reproducibility of a method is of prime interest to the analyst since this will give a better representation of the precision during routine use as it includes the variability from a greater number of sources (Causon, 1997). A minimum of three concentrations in the range of expected concentrations is recommended. The %CV determined at each concentration level, should not exceed 15 % except for the LLOQ, where it should not exceed 20 % (FDA, 2001).
1.3.7. Calibration line
A calibration line is a curve showing the relation between the concentration of the analyte in the sample and the detected response. It is necessary to use a sufficient number of standards to define adequately the relationship between response and concentration. The relationship between response and concentration must be demonstrated to be continuous and reproducible. The number of standards to be used will be a function of the dynamic range and nature of the concentration-response relationship. In many cases, five to eight concentrations (excluding blank values) may define the standard curve. More standard concentrations may be necessary for non-linear relationships than would be for a linear relationship (Shah et al., 1992).
The difference between the observed y-value and fitted y-value is called a residual. One of the assumptions involved in linear regression analysis is that the calculated residuals are independent, are normally distributed and have equal variance, which is termed as homoscedasticity. If the variance is not equal, the case is termed as heteroscedasticity, in which case a weighted regression may be performed. The most appropriate weighting factor is the inverse of the variance of the standard, although 1/x, 1/x2, 1/y and 1/y2 (x = concentration and y = response) are suitable approximations (Lang & Bolton, 1991).
It is important to use a standard curve that will cover the entire range of the concentration of the unknown samples. Estimation of the unknown by extrapolation of standard curve below the lower standard and above the higher standard is not recommended. Instead, it is suggested that the standard curve be re-determined or sample re-assayed after dilution (Shah et al., 1992).
According to Dadgar et al. (1995), the following guidelines can be used for inclusion and exclusion of points from the calibration curve. Provided that the calibration curve consists of at least seven non-zero single standards, up to two non-zero standards may be removed from the calibration if at least one of the following valid reasons exists and a minimum of five nonzero standards remains in the curve.
1. Loss of sensitivity.
2. Loss during sample processing.
3. If, when included in the calibration curve, it clearly biases the QC result, and the back-calculated standards concentration deviates substantially from its nominal value.
Acceptability of the linearity data is often judged by examining the correlation coefficient and y-intercept of the linear regression line for the response versus concentration plot. A correlation coefficient of > 0.999 is generally considered as evidence of an acceptable fit of the data to the regression line (Green, 1996).
1.3.8. Stability
The stability of the analyte is often critical in analytical samples even over a short period of time. Degradation is not unusual even when all precautions are taken to avoid specifically known stability problems of the analyte (e.g. light sensitivity). It is therefore important to verify that there is not sample degradation between the time of collection of the sample and their analysis that would compromise the result of the study. Stability evaluation is done to show that the concentration of analyte at the time of analysis corresponds to the concentration of the analyte at the time of sampling (Hartmann et al., 1998).
An essential aspect of method validation is to demonstrate that analyte(s) is (are) stable in the matrix and in all solvents encountered during the sample work-up process, under the conditions to which study samples will be subjected (Dadgar & Burnett, 1995).
According to the recommendations on the Washington conference report by Shah et al. (1992), the stability of the analyte in matrix at ambient temperature should be evaluated over a time that encompasses the duration of typical sample preparation, sample handling and analytical run time. Similarly Dagar & Brunett (1995) gave the following details to be investigated.
Long term stability
This is done to assess whether the analyte is stable in the matrix under the sample storage conditions for the time period required for the samples generated in a clinical study to be analyzed (FDA, 2001)
Short term matrix stability
This must be evaluated following the storage under laboratory conditions used for sample work-up for a period of e.g. 6 h to 24 h, and compared with data from the same samples prepared and analyzed without delay (FDA, 2001)
On-instrument sample stability
This should be evaluated over the maximum time from completion of sample work-up to completion of data collection, with allowance for potential delay in analysis due to equipment failure. This stability study is conducted at the temperature at which processed study samples will be held prior to data collection (FDA, 2001)
Freeze -thaw stability
This stability test is done to ensure that the sample remains stable after it is subjected to multiple freeze-thaw cycles in the process of the study. This can be done by thawing samples at high, medium and low concentrations unassisted and allowing them to freeze again for at least 12-24 hrs. The cycle is repeated twice and the sample is processed at the end of the third cycle and its result is compared with freshly prepared sample. If the analyte is not stable after three cycles, measures must be taken to store adequate amounts of aliquots to permit repeats, without having to freeze and thaw the sample more than once (Green, 1996).
Acceptable stability is 2 % change in standard solution or sample solution response relative to freshly prepared standard. Acceptable stability at the LLOQ for standard solution and sample solution is 20 % change in response relative to a freshly prepared sample (Green, 1996).
1.3.9. Sensitivity
According to IUPAC as cited in Roger Causon (Causon, 1997), a method is said to be sensitive if small changes in concentration cause large changes in the response function. Sensitivity can be expressed as the slope of the linear regression calibration curve, and it is measured at the same time as the linearity tests. The sensitivity attainable with an analytical method depends on the nature of the analyte and the detection technique employed (Bruce et al., 1998). The sensitivity required for a specific response depends on the concentrations to be measured in the sample specimens generated in the specific study.
1.3.10. Limits of detection and quantification (LLOD and LLOQ)
The US pharmacopoeia (USP) defines the limit of detection (LLOD) as the lowest concentration of an analyte in a sample that can be detected but not necessarily quantitated. They also define the lowest limit of quantification (LLOQ), as the lowest amount of a sample that can be determined (quantitated) with acceptable precision and accuracy under the stated operational condition of the method (Krull & Swartz, 1998).
The limits are commonly associated with the signal to noise ratio (S/N). In the case of LLOD, analysts often use S/N (signal to noise ratio) of 2:1 or 3:1, while a S/N of 10:1 is often considered to be necessary for the LLOQ. Typically the signal is measured from the base line to peak apex and divided by the peak-to-peak noise, which is determined from the blank plasma injection (Tesfu, 2004).
The ICH Q2B (international conference on harmonization) guideline on validation methodology lists two options in addition to the S/N method of determining limits of detection and quantification: visual non-instrumental methods and limit calculations. The calculation is based on the standard deviation of the response (σ) and the slope of the calibration curve (S) at levels approaching the limits according to equations below (Krull & Swartz, 1998).
LLOD = 3.3 x (σ/S) LLOQ = 10.0 x (σ/S) |
The standard deviation of the response can be determined based on the standard deviation of the blank, based on the residual standard deviation of the regression line, or the standard deviation of the y–intercept of the regression line. This method can reduce the bias that sometimes occurs when determining the S/N. The bias can result because of difference in opinion about how to determine and measure noise.
1.3.11. Specificity
Specificity is the ability to assess unequivocally the analyte in the presence of components which may be expected to be present. Typically these might include impurities, degradants, matrix, etc. Lack of specificity of an individual analytical procedure may be compensated by other supporting analytical procedures (Tesfu, 2004).
This definition has the following implications:
1. Identification: to ensure the identity of an analyte.
2. Purity Tests: to ensure that all the analytical procedures performed allow an accurate statement of the content of impurities of an analyte, i.e. related substances test, heavy metals, residual solvents content, etc.
3. Assay (content or potency): to provide an exact result this allows an accurate statement on the content or potency of the analyte in a sample.
1.3.12. Linearity
The linearity of an analytical procedure is its ability (within a given range) to obtain test results which are directly proportional to the concentration (amount) of analyte in the sample (Tesfu, 2004).
A linear relationship should be evaluated across the range of the analytical procedure. It may be demonstrated directly on the drug substance (by dilution of a standard stock solution) and/or separate weighings of synthetic mixtures of the drug product components, using the proposed procedure. The latter aspect can be studied during investigation of the range.
Linearity should be evaluated by visual inspection of a plot of signals as a function of analyte concentration or content. If there is a linear relationship, test results should be evaluated by appropriate statistical methods, for example, by calculation of a regression line by the method of least squares. In some cases, to obtain linearity between assays and sample concentrations, the test data may need to be subjected to a mathematical transformation prior to the regression analysis. Data from the regression line itself may be helpful to provide mathematical estimates of the degree of linearity.
The correlation coefficient, y-intercept, slope of the regression line and residual sum of squares should be submitted. A plot of the data should be included. In addition, an analysis of the deviation of the actual data points from the regression line may also be helpful for evaluating linearity. Some analytical procedures, such as immunoassays, do not demonstrate linearity after any transformation. In this case, the analytical response should be described by an appropriate function of the concentration (amount) of an analyte in a sample. For the establishment of linearity, a minimum of 5 concentrations is recommended. Other approaches should be justified.
1.3.13. Range
The range of an analytical procedure is the interval between the upper and lower concentration (amounts) of analyte in the sample (including these concentrations) for which it has been demonstrated that the analytical procedure has a suitable level of precision, accuracy and linearity (Tesfu, 2004).
The specified range is normally derived from linearity studies and depends on the intended application of the procedure. It is established by confirming that the analytical procedure provides an acceptable degree of linearity, accuracy and precision when applied to samples containing amounts of analyte within or at the extremes of the specified range of the analytical procedure.
The following minimum specified ranges should be considered:
1. for the assay of a drug substance or a finished (drug) product: normally from 80 to 120 percent of the test concentration;
2. for content uniformity, covering a minimum of 70 to 130 percent of the test concentration, unless a wider more appropriate range, based on the nature of the dosage form (e.g., metered dose inhalers), is justified.
3. for dissolution testing: +/-20 % over the specified range;
e.g., if the specifications for a controlled released product cover a region from 20%, after 1 hour, up to 90%, after 24 hours, the validated range would be 0-110% of the label claim (ICH harmonized tripartite guideline, 1996).
4. for the determination of an impurity: from the reporting level of an impurity1 to 120% of the specification.
5. for impurities known to be unusually potent or to produce toxic or unexpected pharmacological effects, the detection/quantitation limit should be commensurate with the level at which the impurities must be controlled; For validation of impurity test procedures carried out during development, it may be necessary to consider the range around a suggested (probable) limit.
6. if assay and purity are performed together as one test and only a 100% standard is used, linearity should cover the range from the reporting level of the impurities1 to 120% of the assay specification (ICH harmonized tripartite guideline, 1996).
1.3.14. Robustness
The robustness of an analytical procedure is a measure of its capacity to remain unaffected by small, but deliberate variations in method parameters and provides an indication of its reliability during normal usage (ICH harmonized tripartite guideline, 1996).
The evaluation of robustness should be considered during the development phase and depends on the type of procedure under study. It should show the reliability of an analysis with respect to deliberate variations in method parameters. If measurements are susceptible to variations in analytical conditions, the analytical conditions should be suitably controlled or a precautionary statement should be included in the procedure. One consequence of the evaluation of robustness should be that a series of system suitability parameters (e.g., resolution test) is established to ensure that the validity of the analytical procedure is maintained whenever used.
Examples of typical variations are:
1. Stability of analytical solutions
2. Extraction time
In the case of liquid chromatography, examples of typical variations are:
1. Influence of variations of pH in a mobile phase
2. Influence of variations in mobile phase composition
3. Different columns (different lots and/or suppliers)
4. Temperature
5. Flow rate
In the case of gas-chromatography, examples of typical variations are:
1. Different columns (different lots and/or suppliers)
2. Temperature
3. Flow rate
1.3.15. System suitability testing
System suitability testing is an integral part of many analytical procedures. The tests are based on the concept that the equipment, electronics, analytical operations and samples to be analyzed constitute an integral system that can be evaluated as such. System suitability test parameters to be established for a particular procedure depend on the type of procedure being validated (ICH harmonized tripartite guideline, 1996).
1.4. Aim of the study
- to understand the importance of method development and validation in pharmaceutical analysis
- to understand the ICH guideline for method development and validation
- to understand the requirements of approval of an analytical method for various regulatory authority
- to understand the factors affecting a the ability of a method
Chapter two
Background information of CefdinirCefdinir2.1. Chemistry of cefdinir
Cefdinir is an extended-spectrum, semi-synthetic cephalosporin, for oral administration. Chemical Cefdinir is [6R-[6α,7β(Z)]]-7-[[(2-amino thiazolyl)(hydroxyimino)acetyl]amino]-3-ethenyl-8-oxo-5-thia-1-azabicyclo[4.2.0]oct-2-ene-2-carboxylic acid. Cefdinir is a white to slightly brownish-yellow solid. It is slightly soluble in dilute hydrochloric acid and sparingly soluble in 0.1 M pH 7.0 phosphate buffer. The empirical formula is C14H13N5O5S2 and the molecular weight is 395.42.
Cefdinir is a broad-spectrum oral cephalosporin that has been launched in Japan and approved by the U.S. Food and Drug Administration in 1997 for the treatment of mild to moderate bacterial infections. Cefdinir offers enhanced activity against methicillin sensitive Staphylococcus aureus and Staphylococcus epidermis as well as effective antimicrobial activity against strains of Staphylococcus and Neisseria spp. and β-lactamase producing strains of Haemophilus and Moraxella. The oximino side chain provides excellent stability against the most common plasmid-encoded β-lactamase TEM-1 and TEM-2 but not against extended β-lactamase, such as TEM-3. It is safe and effective when used in children with infections caused by susceptible bacteria including Staphylococcus aureus. Diarrhea was a common adverse reaction associated with cefdinir. A pooled comparison of cefdinir and penicillin in the treatment of group a β-hemolytic streptococcal pharyngotonsillitis was studied and it was found that cefdinir achieved significantly higher clinical cure and microbiological eradication rates compared with penicillin (Jain et al., 2007).
2.2. Indications
Cefdinir is indicated for the treatment of patients with mild to moderate infections caused by susceptible strains of the designated microorganisms in the conditions listed below (Klein et al., 2000).
Adults and Adolescents
1. Community-Acquired Pneumonia
2. Acute Exacerbations of Chronic Bronchitis
3. Acute Maxillary Sinusitis
4. Pharyngitis/Tonsillitis
5. Uncomplicated Skin and Skin Structure Infections
Pediatric Patients
1. Pharyngitis/Tonsillitis
2. Uncomplicated Skin and Skin Structure Infections
2.3. Dosage and Administration: Capsule
The recommended dosage and duration of treatment for infections in adults and adolescents are described in the following chart; the total daily dose for all infections is 600 mg (Gwaltney et al., 1997). Once-daily dosing for 10 days is as effective as BID dosing. Once-daily dosing has not been studied in pneumonia or skin infections; therefore, Cefdinir Capsules should be administered twice daily in these infections. Cefdinir Capsules may be taken without regard to meals.
Table 2: Dosage regimen of cefdinir for adults
| Type of Infection | Dosage | Duration |
| Community-Acquired Pneumonia | 300 mg q12h | 10 days |
| Acute Exacerbations of ChronicBronchitis | 300 mg q12h or | 5 to 10 days |
| 600 mg q24h | 10 days | |
| Acute Maxillary Sinusitis | 300 mg q12h or | 10 days |
| 600 mg q24h | 10 days | |
| Pharyngitis/Tonsillitis | 300 mg q12h or | 5 to 10 days |
| 600 mg q24h | 10 days | |
| Uncomplicated Skin Infections | 300 mg q12h | 10 days |
Dosage regimen for adults and adolescents (Age 13 Years and Older), powder for oral suspension
The recommended dosage and duration of treatment for infections in pediatric patients are described in the following chart; the total daily dose for all infections is 14 mg/kg, up to a maximum dose of 600 mg per day (Gwaltney et al., 1997). Once-daily dosing for 10 days is as effective as BID dosing. Once-daily dosing has not been studied in skin infections; therefore, Cefdinir for Oral Suspension should be administered twice daily in this infection. Cefdinir for Oral Suspension may be administered without regard to meals.
Table 3: Dosage regimen of cefdinir for pediatrics
| Type of Infection | Dosage | Duration |
| Acute Bacterial Otitis Media | 7 mg/kg q12h | 5 to 10 days |
| or 14 mg/kg q24h | 10 days | |
| Acute Maxillary Sinusitis | 7 mg/kg q12h | 10 days |
| or 14 mg/kg q24h | 10 days | |
| Pharyngitis/Tonsillitis | 7 mg/kg q12h | 5 to 10 days |
| or 14 mg/kg q24h | 10 days | |
| Uncomplicated Skin and Skin Structure Infections | 7 mg/kg q12h | 10 days |
Patients with Renal Insufficiency
For adult patients with creatinine clearance < 30 ml/min, the dose of Cefdinir should be 300 mg given once daily.
Creatinine clearance is difficult to measure in outpatients. However, the following formula may be used to estimate creatinine clearance (CLcr) in adult patients. For estimates to be valid, serum creatinine levels should reflect steady-state levels of renal function.
|
Males:Females:
CLcr = 0.85 × above value
Where creatinine clearance is in ml/min, age is in years, weight is in kilograms, and serum creatinine is in mg/dl. (Cockcroft et., al 1976)
The following formula may be used to estimate creatinine clearance in pediatric patients
Where K = 0.55 for pediatric patients older than 1 year and 0.45 for infants (up to 1 year) (Schwartz et al., 1984).
In the above equation, creatinine clearance is in mL/min/1.73 m2, body length or height is in centimeters, and serum creatinine is in mg/dl.
For pediatric patients with a creatinine clearance of < 30 mL/min/1.73 m2, the dose of Cefdinir should be 7 mg/kg (up to 300 mg) given once daily (Guay, et al 2002).
2.4. Side Effects
Table 4: Side effect of cefdinir in adult and adolescent patients
| Vaginal moniliasisNausea Headache Abdominal pain Vaginitis Rash Dyspepsia Flatulence Vomiting Abnormal stools | AnorexiaConstipation Dizziness Dry mouth Asthenia Insomnia Leukorrhea Moniliasis Pruritus Somnolence |
Table 5: Side effect of cefdinir in pediatric patients
| Diarrhea |
Cutaneous moniliasis
Leukopenia
Vaginal moniliasis
Maculopapular rash
Vaginitis
Abnormal stools
Hyperkinesia
Increased AST
2.5. Post marketing Experience
The following adverse experiences and altered laboratory tests, regardless of their relationship to Cefdinir, have been reported during extensive post marketing experience, beginning with approval in Japan in 1991: shock, anaphylaxis with rare cases of fatality, facial and laryngeal edema, feeling of suffocation, serum sickness-like reactions, conjunctivitis, stomatitis, Stevens-Johnson syndrome, toxic epidermal necrolysis, exfoliative dermatitis, erythema multiforme, erythema nodosum, acute hepatitis, cholestasis, fulminant hepatitis, hepatic failure, jaundice, increased amylase, acute enterocolitis, bloody diarrhea, hemorrhagic colitis, melena, pseudomembranous colitis, pancytopenia, granulocytopenia, leukopenia, thrombocytopenia, idiopathic thrombocytopenic purpura, hemolytic anemia, acute respiratory failure, asthmatic attack, drug-induced pneumonia, eosinophilic pneumonia, idiopathic interstitial pneumonia, fever, acute renal failure, nephropathy, bleeding tendency, coagulation disorder, disseminated intravascular coagulation, upper GI bleed, peptic ulcer, ileus, loss of consciousness, allergic vasculitis, possible Cefdinir-diclofenac interaction, cardiac failure, chest pain, myocardial infarction, hypertension, involuntary movements, and rhabdomyolysis (FDA, 2010).
2.6. Cephalosporin Class Adverse Events
The following adverse events and altered laboratory tests have been reported for cephalosporin-class antibiotics in general:
Allergic reactions, anaphylaxis, Stevens-Johnson syndrome, erythema multiforme, toxic epidermal necrolysis, renal dysfunction, toxic nephropathy, hepatic dysfunction including cholestasis, aplastic anemia, hemolytic anemia, hemorrhage, false-positive test for urinary glucose, neutropenia, pancytopenia, and agranulocytosis. Pseudomembranous colitis symptoms may begin during or after antibiotic treatment.
Several cephalosporins have been implicated in triggering seizures, particularly in patients with renal impairment when the dosage was not reduced. If seizures associated with drug therapy occur, the drug should be discontinued. Anticonvulsant therapy can be given if clinically indicated (Guay, 2000).
2.7. Drug interaction and Contraindications
Cefdinir shows interaction with following drugs- Antacids (aluminum or magnesium containing), Probenecid, Iron Supplements and Foods Fortified with Iron
Cefdinir is contraindicated in patients with known allergy to the cephalosporin class of antibiotics (Guay et al., 2002).
2.8. Pharmacokinetics and Drug Metabolism
Absorption and Oral Bioavailability
Maximal plasma Cefdinir concentrations occur 2 to 4 hours post dose following capsule or suspension administration (Guay, 2000).
Effect of Food
The Cmax and AUC of Cefdinir from the capsules are reduced by 16% and 10%, respectively, when given with a high-fat meal (Guay, 2000).
Distribution
The mean volume of distribution (Vdarea) of Cefdinir in adult subjects is 0.35 L/kg (± 0.29); in pediatric subjects (age 6 months-12 years), Cefdinir Vdarea is 0.67 L/kg (± 0.38). Cefdinir is 60% to 70% bound to plasma proteins in both adult and pediatric subjects; binding is independent of concentration.
Metabolism and Excretion
Cefdinir is not appreciably metabolized. Activity is primarily due to parent drug. Cefdinir is eliminated principally via renal excretion with a mean plasma elimination half-life (t½) of 1.7 (± 0.6) hours. In healthy subjects with normal renal function, renal clearance is 2.0 (± 1.0) mL/min/kg, and apparent oral clearance is 11.6 (± 6.0) and 15.5 (± 5.4) mL/min/kg following doses of 300- and 600-mg, respectively. Mean percent of dose recovered unchanged in the urine following 300- and 600-mg doses is 18.4% (± 6.4) and 11.6% (± 4.6), respectively. Cefdinir clearance is reduced in patients with renal dysfunction because renal excretion is the predominant pathway of elimination, dosage should be adjusted in patients with markedly compromised renal function or who are undergoing hemodialysis (Lepsy et al., 2003).
Chapter three
Literature Review
Publications for three methods High Performance Liquid Chromatography, Difference Spectroscopic and Electrochemical has been found for the quantitative estimation of Cefdinir in finished product and in analytical assay. Here is a brief summary-
3.1. Okamoto et al., 1995. HPLC (High Performance Liquid Chromatography)
The reversed-phase HPLC method was developed for determination of cefdinir and its related substances. Cefdinir was separated from eight related sub-stances on an octadecyl silanized silica gel using a mixture of citrate-phosphate buffer-methanol dioxane as a mobile phase, UV detection at 254 nm was employed because the relative absorption of related substances to cefdinir at 254 nm was from 0.8 to 1.2. From the results of the investigation on the effect of column temperature for the separation between cefdinir and its related substances, a controlled column temperature of 25°C + 5°C was employed. After optimizing conditions for the HPLC method, method validation studies were con-ducted. For the assay method for cefdinir, a good linearity was obtained for 50-150% of the nominal concentration and an acceptable Y intercept was determined to be 3% based on the allowable assay error at the extreme of the limit for content uniformity. The system and method precision, expressed as RSDs (repeatability, stability and detection), were not greater than 1%, and the reproducibilities within and between laboratories were acceptable for the assay method from the results of statistical analyses of a series of replicate determinations. For determination of related substances, good linearities were found at both high and low concentrations with identical slopes. In addition, relative detection sensitivity of each related substance against cefdinir varied from 0.8 to 1.2. These results supported the view that a simple peak area percentage method could be employed for the calculation. Even though the limit o f detection for each related substance varied due to the peak sharpness, a quantization limit of 0.05% o f the nominal concentration could be employed. For reproducibility studies, there was significant difference between the results of different analysts. A slight difference in peak manipulation between analysts was observed, indicating that standardization of peak manipulation is a key issue for good reproducibility of impurity determination. Finally, this HPLC method was applied to stability studies of cefdinir under stress conditions. A good mass balance of more than 98 % was ob- served in all samples, suggesting that this HPLC method is stability-indicating (Okamoto et al, 1995).
The method is found to be the most effective method for determining the cefdinir standards percent purity. It also identifies the presence of related impurities of cefdinir but do not identify other impurities e.g. metallic impurities or impurities which are related to raw materials. The method is detailed and can only used if parameters are established in advance and validated for the available instruments. Another supplementary analytical methods and experiments are required for determining impurities which are related to raw material, production process and surrounding environment. Not applicable for the analytical assay.
3.2. Shah et al., 2006. Difference Spectroscopic and Reverse Phase HPLC
Two simple efficient and reproducible difference spectroscopic and reverse phase high performance liquid chromatographic methods have been developed for the estimation of cefdinir in pharmaceutical dosage forms. Difference spectroscopic method is based on the measurement of absorbance of cefdinir at maxima 265nm and minima 230 nm. The measured value is the amplitude of maxima and minima between two equimolar solutions of the analyte in different chemical forms, which exhibit different spectral characteristics. Beers law was obeyed in the concentration range of 10 to 35 µg/ml. The second method, a high performance liquid chromatography, was developed for the estimation of cefdinir, using 50 nM ammonium acetate (pH 3 ±0.1 adjusted with 10% phosphoric acid) and methanol (80/2% v/v) as the mobile phase with low rate of 1 ml/ min, and measuring the response at 285 nm. An external standard calibration method was employed for quantization. Beer’s law was obeyed in the concentration range of 15 to 125 µg/ml. The results obtained in the analysis of dosage forms agree well with the labeled contents (Shah et al., 2006).
The difference spectroscopic method is claimed to be better than HPLC method because it does not requires sophisticated equipments and solvents. There is no scope in this technique to identify and determine relevant impurities. Ultra violate absorbance of a particular compound is constant and characteristic of that compound. This method can be thought to be accurate if analytical errors can be minimized. The HPLC method latter performed is generalized and do not provide detailed information The HPLC method is superior than difference spectroscopic method but the latter is economical and has ease of application if the primary assay of the supply is standardized using HPLC then the difference spectroscopic method can be used as supplement quick estimation of the presence of cefdinir in finished product in dosage form. Difference spectroscopic method is not applicable for analytical assay.
3.3. Jain et al., Electrochemical Evaluation and Determination of Cefdinir
The electro reductive behavior of cefdinir was investigated and two irreversible well-defined cathodic peaks were observed. From the electrochemical response the main reduction steps were found to be related to the reduction of C=N and C=C group. A fully validated, sensitive, and reproducible square wave cathodic adsorptive stripping Volta metric procedure for the trace determination of the bulk drug, pharmaceutical formulation and in human urine, at the mercury electrode has been developed. The optimal experimental parameters for the drug assay were: accumulation potential -0.3 V (vs Ag/AgCl, 3 M KCl), accumulation time 15 s, frequency = 120 Hz, pulse amplitude = 0.07 V, and scan increment = 10 mV in phosphate buffer pH 2. The first peak current showed a linear dependence with the drug concentration over the range 1.88 × 10⁻⁶ to 12 × 10-8 M. The achieved limit of detection and limit of quantification were 0.5 × 10⁻⁹ M (0.2 ng mL-1) and 1.7 × 10⁻⁹ M (0.67 ng mL-1), respectively. The procedure was applied to the assay of the drug in capsule form with mean percentage recoveries of 99.7. Applicability to assay the drug in urine samples was illustrated. The peak current was linear, with the drug concentration in the range 0.08–0.7 µg mL-1 of the urine (Jain et al., 2007).
The above described method fails to specify the presence of particular impurities. The method is independent of comparing with the reference standard for comparison. There arise a question about the presence of accuracy and precession of the method as the method inherently depends on the presence and reduction of a particular functional group. The impurity with similar functional group has chances to interfere with the detection. The main advantage of this study is claimed to have extremely low limit of detection and compatibility for analysis of cefdinir in biological fluids. The method is relatively easy with low work load. The method is irreversible.
3.4. Kumudhavalli et al., RP-HPLC (Reverse phase High Performance Chromatography)
A single precise and rapid reverse phase high performance liquid chromatographic method has been developed for the quantitative determination of anti diabetic drug Cefdinir in bulk as well as in formulations. In this method C15, 25 cm, 5 cm 4.6 mm ID column with mobile phase consisting of 0.01N phosphate buffer (PH7.2) and Methanol in the ratio of 55:45 in an isocratic mode was used. The detection wave length is 285 nm and the flow rate is 1ml/min. In the range of 100 mg- 500mg /ml. the linearity of Cefdinir shows a regression coefficient of 1. This developed method was validated by determining its sensitivity, accuracy and precision. Cefdinir is exposed to various stressed conditions to establish the specificity of the method (Kumudhavalli et al, 2009).
The above described method does not study the detection of related substances of cefdinir, their presence and interference with the actual assay method. A inter phase module with HSM software has been used for interpretation of signals obtained by UV (ultra violate) detector of the HPLC apparatus. Do not identifies quantifies the presence of other impurities. An absolute quantification of the presence of pure cefdinir is not possible. The method can only be used for a relative study on a quick study if a reference standard of cefdinir calibration can be established by obtaining a reference standard whose percent purity is determined by a novel, generalized, detailed, standard, accepted by regulatory authority’s method. Not applicable for analytical assay.
Among the above methods HPLC method is the universal method for the primary experiment but requires use of sophisticated equipment training, use of raw material and is time consuming. The other methods can be used as supplement on routine check up validation and quality control of finished product of different formulations.
3.5. Comparison of different method for the determination of cefdinir
Table 6: Comparison of different methods available for the quantitative determination of cefdinir
| HPLC | Difference spectroscopic method | Electrochemical method |
| Able to separate and quantify related impurities | Can not separate related impurities | Can not separate related impurities |
| Measurement can be performed by comparing or without comparing reference standard | Reference standard is required for the measurement | Reference standard is required |
| A HPLC machine required | A spectrophotometer is required | A µ Autolab Type III potentiostat-galvanostat with 757VA computrace software is required |
| HPLC grade solvents and temperature control is required | The experiment can be performed at the room temperature | The experiment can be performed at room temperature |
| The process of analysis is not reversible as separation of samples occurs | The process can be repeated using the same sample | The process of analysis is not reversible as the degradation of the sample occurs |
| Proper training for handling an HPLC machine is required | The process is simple | Proper training for handling potentiostat-galvanostat is required |
| Direct method can be applied for deter mining trace amount of sample | Both direct method and calibration method can be applied | Both direct and calibration methods can be applied |
| Direct method is quick | Calibration method requires tedious preparation of reagents and solvents | The set up of instrument is tedious |
| The instrumentation of HPLC is expensive | The instrumentation is cheap compared to HPLC |
The instrumentation is expensive than spectrophotometer
Chapter Four
Discussion
4.1. Discussion
A pharmaceutical product needs to be of high quality. It needs to be pure and free of hazardous elements. In order to insure the safety and efficacy various regulatory authorities has been established those serves regionally or internationally e.g. national drug administrations. They have established a set of requirements for the approval of pharmaceutical and health care substances to be marketed. In order to insure the quality of a product analytical procedures are applied to examine them. For the approval of a product the analytical procedures applied regarding its quality control needs to be approved. The procedures should have to be effective. Quantification of active pharmaceutical ingredient from the dosage form, identifying and quantifying impurities present on it is the most common requirements.
Various pharmaceutical analysis is nothing but application of various methods. One of the major concerns of this is quantification of ingredients from sample taken from various sources at different situations e.g. manufacturing stages, pharmacokinetic and pharmacokinetic studies etc. Regulatory authorities provide detailed specifications for the development and validation of a pharmaceutical method. A full method development is a high work load and only done if satisfactory results obtained in preliminary studies. A method can be fully validated partially validated or compared to another methods study results depending on the situations of the particular case of a certain method. A set of parametric terminologies can be applied fro effectively validating an analytical method which are selectivity, accuracy, precisions, calibration line, stability, sensitivity, limit of detection and quantification, specificity, linearity, range, robustness and system suitability testing.
A method is said to be selective if it produces response only for the analyte which is intended to be analyzed quantitatively. A zero level of interference is required for the absolute selectivity but practically it is hardly obtained therefore it is necessary to ensure that response for the lower limit of quantification is greater than blank matrix by a defined factor. The accuracy of an analytical method is the agreement between the measured value and true value. Error caused during the analysis contributes to lower accuracy e.g. sample preparation, preparation of calibration line etc. Precision of an analytical method is the agreement between the replicate measurements. It is expressed as the percentage of coefficient variance.
A calibration line is a curve showing the relation between concentration of the analyte in the sample and detected response. The relationship between the response and concentration must be continuous and reproducible. For a linear relationship five to eight concentrations can be used but nonlinear relationships require more standard concentrations. The analyte needs to be stable throughout the work up process other wise the results would be biased. Four type of stability of a sample is tested at long term stability testing, short term matrix stability testing and on-instrument sample stability testing freeze-thaw stability testing. Sensitivity of a method is the level of change of response with change in concentration. A sensitive method causes large change in response with small change in concentration. Sensitivity required for a method depends on the concentrations to be measured. Limits of detection and quantification and quantification are the lowest concentration of an analyte that can be detected and quantified. Limit depends on signal to noise ratio. For detection a signal to noise ratio of 2:1 or 3:1 and for quantification 10:1 is necessary.
Specificity means the ability to assess unequivocally the analyte in the presence of components which may be expected to be present. This has three implications; identification, purity test, assay. The linearity of an analytical procedure is its ability within a given range to obtain test results which are directly proportional to the concentration of the analyte in the sample. The range of an analytical procedure is the interval between the upper and lower concentration of analyte in sample for which it has been demonstrated that the analytical procedure has suitable level of precision, accuracy and linearity. The specified range is normally derived from linearity studies and depends on the intended application of the procedure. The robustness of an analytical procedure is a measure of its capacity to remain unaffected by small but deliberative variation in method parameters and provides an indication of its reliability during normal usage. Evaluation of robustness should be considered during the development phase and depends on the type of the procedure under study. It shows the reliability of an analysis with respect to deliberate variations in method parameters. System stability test is performed to ensure that equipment electronics used on analytical operations complies with the parameters of method development and validation. System stability test parameters to be established for a particular procedure depend on the type of the procedure itself.
Cefdinir is an extended spectrum; semi synthetic cephalosporin has been launched in Japan and approved by the U.S. Food and Drug Administration in 19197. It has inhanced activity against methicillin sensitive Staphylococcus aureous and Staphylococcus epidermis as well as effective antimicrobial activity against strains of Staphylococcus and Niesseria spp. and β-lactamase producing strains of Haemophilus and Moraxella. However the drug is not official yet at major regulatory authorities like United States pharmacopeias and British pharmacopeias. The methods available for the analysis of this drug are not yet well described.
A brief study of different available methods for the quantitative determination of cefdinir was performed. The HPLC method seems to be the most effective method which lacks the probability to occur mechanical error it also provides an identification and measurement of impurities of cefdinir. The direct method with the HPLC is quick. Measurements can be performed by comparing to the reference standards while an absolute separation and measurement of ingredients and related impurities is also possible. The process of the analysis is not reversible and can not be repeated using the same sample as the analysis involves the separation of ingredients of the analyte. The instrumentation for the HPLC is expensive and its handling requires proper training. The reagents need to be of high quality pure for the HPLC. The method is Expensive compared to other methods available as HPLC instrumentation is costly then the instrumentation of other available methods. An HPLC machine is sensitive so proper training for handling the machine is required. A proper temperature control is required for the HPLC operation. Both calibration method and direct methods can be applied for the analysis; direct method is simple and can be utilized better accuracy and precision. The method can be applied in routine pharmaceutical analysis.
The spectrophotometeric method can prove to be economical as instrumentation for the spectrophotometer is cheap compared to HPLC. Spectrophotometeric method can be applied with both direct and calibration method while direct method is preferred for better accuracy. Measurement is performed only by comparing to reference standards. Both direct method and calibration method can be applied. The calibration method is advantageous for determining wide concentration range. The handling of a spectrophotometer is simple. Calibration method is less accurate but can be used for determining samples of wide concentration range.
The instrumentation for the electrochemical method is expensive compared to the Spectrophotometer. The electrochemical method involves the degradation of the cefdinir so the process of the analysis is not reversible. The measurement is performed by comparing the electrochemical spectra of sample to the reference standards. Proper training for the set up of the potentiostat-galvanostat is required. Both direct method and calibration method can be applied. For determining the biological samples calibration method needs to be applied because the comparison of electrograph for the null sample is not possible