Plant height
Tree effect
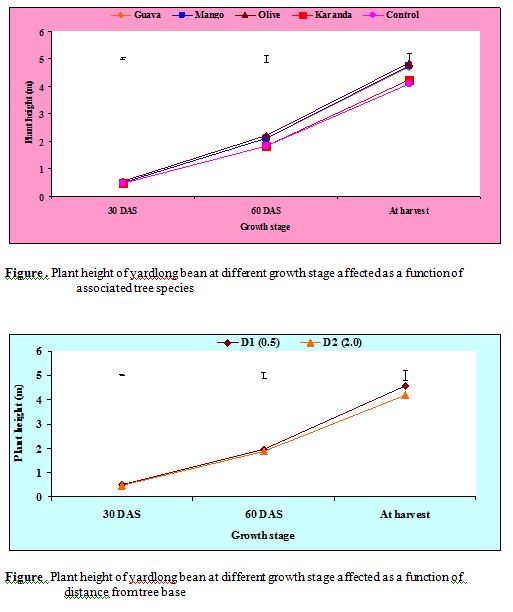
Significant variation was observed in respect of plant height due to P. guajava, M. indica, O. europea and C. acuminata based agroforestry systems at different days after sowing (Fig 87.1) Plant height of yard long bean under different agroforestry systems was almost similar at 30 days after sowing. Significantly the highest (0.55 m) plant height was recorded under O. europea based agroforestry system at 30 DAS and the lowest (0.46 m) was observed under control treatment. After 60 DAS and at harvest time, plant height exhibited distinct differences regarding upperstorey tree effect. After 60 DAS the highest (2.2 m) plant height was recorded under O. europea based agroforestry system followed by M. indica (2.1 m), P. guajava (2.09 m) and C. acuminata (1.82 m) based agroforestry systems. At harvest time, plant height of yard long bean followed the same trend as it was at 60 DAS. Higher Plant height was observed throughout the growth period when yardlong bean grown under O. europea based agroforestry system.
Distance effect
Plant height of yardlong bean did not differ significantly when it was grown at various distances from tree base. Highest plant height (0.51 m) was observed throughout the growth period when yardlong bean grown at D1 distance form tree base.
Combined effect between associated tree species and distance from tree base
Plant height of yardlong bean was significantly affected by the combined effect of associated tree species and distance from tree base (Table 30). At 30 days after sowing (DAS), the highest (0.61 m) plant height of yardlong bean was observed at D1 distance under O. europea based agroforestry system and the lowest (0.45 m) was recorded at D2 distance under control treatment. Similarly the highest plant height was recorded at 60 DAS (2.28 m) and at harvest (4.55 m) time at D1 distance under O. europea tree based agroforestry system and the lowest was observed at 60 DAS (1.70 m) and at harvest (3.80 m) at D2 distance under control treatment
Table 30: Combined effect between associated tree species and distance from tree base on plant height of yardlong bean
| Tree species | Distance from tree base (m) | Plant Height (m) | ||
30 DAS | 30 DAS | At harvest | ||
| P. guajava | D1(0.5) | 0.49 bc | 1.93 b-d | 4.05 bc |
D2(2.0) | 0.48 bc | 1.77 cd | 4.03 bc | |
| M. indica | D1(0.5) | 0.47 bc | 2.00 bc | 4.57 a |
D2(2.0) | 0.50 bc | 1.97 b-d | 4.07 bc | |
| O. europea | D1(0.5) | 0.61 a | 2.28 a | 4.55 a |
D2(2.0) | 0.52 b | 2.17 ab | 4.60 a | |
| C. acuminata | D1(0.5) | 0.46 bc | 1.87 cd | 4.46 ab |
D2(2.0) | 0.45 c | 1.70 d | 4.00 bc | |
| Control | D1(0.5) | 0.46 bc | 1.73 d | 4.08 bc |
D2(2.0) | 0.45 c | 1.70 d | 3.80 c | |
| CV (%) | – | 5.96 | 7.16 | 5.91 |
| LSD | – | 0.05 | 0.24 | 0.43 |
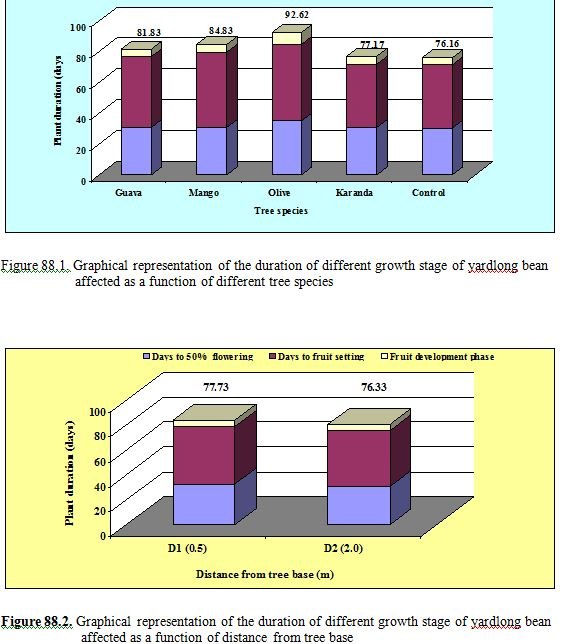
Plant duration
Tree effect
Plant duration was significantly influenced by different agroforestry systems. The longest (35.17 days) days to 50% flowering were obtained under O. europea based agroforestry system whereas the shortest (30.50 days) days to 50% flowering were observed under control treatment. The shortest (41.00 days) days to fruit setting was recorded under control treatment whereas the longest (50.00 days) days to fruit setting were observed under O. europea based agroforestry system. The fruit development period was significantly influenced by different agroforestry systems. Fruit development period was the shortest (4.67 days) under control treatment and the longest (7.45 days) under O. europea species. Crop duration was also significantly increased by reduced light condition (Tree canopy effect). The longest (92.62 days) crop duration was obtained under O. europea species while the shortest (76.17 days) crop duration was recorded under control treatment.
Distance effect
Days to 50% flowering, days to fruit setting, fruit development period and total crop duration were not affected significantly when yardlong bean grown at various distances from tree base . However, higher plant duration at different growth stages was observed when yardlong grown at D2 (2.0 m) distance from tree base.
Combined effect between associated tree species and distance from tree base
Plant duration of yardlong bean at various growth stages was affected significantly by the combined effect of tree species and distance form tree base. The longest (36.33 days) days to 50% flowering were obtained at D1 distance under O. europea based agroforestry system whereas the shortest (30.33 days) days were obtained under control treatment. At the same way, the longest (49.67 days) days to fruit setting was recorded at D1 distance under O. europea species while the shortest (39.67 days) days was recorded at D2 distance under control treatment. Fruit development period and total crop duration was also longest (8.22 and 83.33 days respectively) at D1 distance under O. europea based agroforestry system whereas the shortest (4.67 and 70.00 days) was observed at D1 distance under control treatment.
Table 31: Combined effect between associated tree species and distance from tree base on plant duration of yardlong bean
| Tree species | Distance from tree base (m) | Plant Duration (days) | |||
Days to 50% flowering | Days to fruit setting | Fruit development period | Total crop duration | ||
| P. guajava | D1(0.5) | 31.33 bc | 43.00 b | 5.00 c | 74.33 c |
D2(2.0) | 31.00 c | 48.67 a | 4.67 c | 81.33 ab | |
| M. indica | D1(0.5) | 32.00 bc | 50.33 a | 5.00 c | 81.67 ab |
D2(2.0) | 31.33 bc | 49.67 a | 4.67 c | 80.33 b | |
| O. europea | D1(0.5) | 36.33 a | 49.67 a | 8.22 a | 83.33 a |
D2(2.0) | 33.00 b | 48.33 a | 6.67 b | 82.33 ab | |
| C. acuminata | D1(0.5) | 30.67 c | 41.67 bc | 5.00 c | 73.00 cd |
D2(2.0) | 30.00 c | 42.67 b | 5.00 c | 72.33 cd | |
| Control | D1(0.5) | 30.67 c | 39.67 c | 4.67 c | 71.67 de |
D2(2.0) | 30.33 c | 40.33 c | 4.67 c | 70.00 e | |
| CV (%) | – | 3.23 | 2.82 | 8.00 | 1.59 |
| LSD | – | 1.76 | 2.19 | 0.74 | 2.03 |
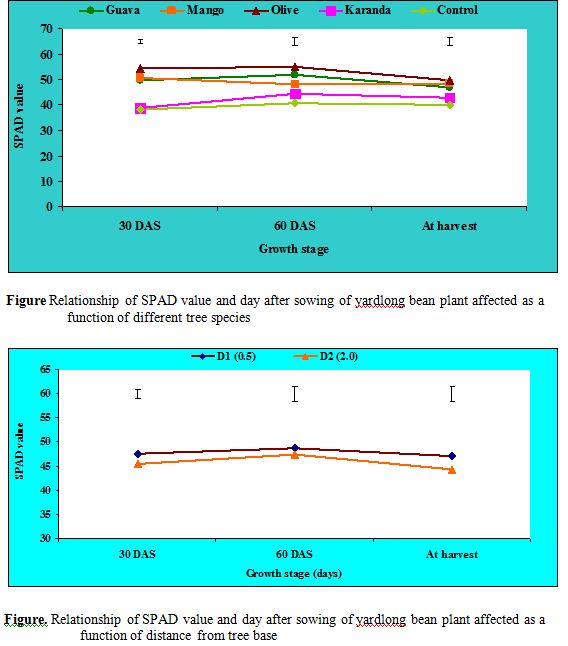
SPAD value (Soil Plant Analysis Development)
Tree effect
Upperstorey tree had significant influence on the SPAD value of country bean (Fig. 89.1). SPAD value increased with shade level increasing. The highest SPAD value (54.44) was obtained under O. europea based agroforestry system while the lowest (38.42) was recorded under control treatment at 30 days after sowing (DAS) of yardlong bean. Significant variation was observed of SPAD value at 60 DAS and at harvest time. The highest SPAD value was recorded at 60 DAS and at harvest time (55.04 and 49.92 respectively) under O. europea species whereas the lowest SPAD value (40.74 and 40.28) at the same time was observed under control treatment. SPAD value that accounted the greenness and nitrogen use efficiency of plant increased with increasing shade due to higher production of chlorophyll for photosynthesis.
Distance effect
From the Fig. 89.2 it is clear that the distance had no significant influence on SPAD value of yardlong bean at various days after sowing. At D1 distance the SPAD value was more or less same at 30, 60 DAS and at harvest time whereas at D2 distance the SPAD value was lower at 30 DAS, Then it was increased at 60 DAS and finally SPAD value was decreased at harvest time. However higher SPAD value was observed throughout the growth period when yard long bean grown at D1 distance. Under tree, maximum shade helps to increase chlorophyll content which in turn increase SPAD value as compared to crop grown away from tree base.
Combined effect between associated tree species and distance from tree base
SPAD value of yardlong bean was significantly influenced by the combined effect of tree species and distance from tree base (Table 32). The highest SPAD value (53.25) was obtained at D1 distance under O. europea species whereas the lowest (37.50) was recorded at D1 distance under control treatment at 30 DAS. SPAD value at 60 DAS was the highest (55.87) at D1 distance, at the same time under control treatment. At the harvest time, the highest SPAD value (53.63) was obtained at D1 distance under O. europea species while the lowest (38.93) was recorded at the same time under control treatment. However, higher SPAD value was observed throughout the growing period when yardlong bean grown at D1 distance under O. europea species.
Table 32. Combined effect between associated tree species and distance from tree base on SPAD value of yardlong bean
| Tree species | Distance from tree base (m) | SPAD value (30 DAS) | SPAD value (60 DAS) | SPAD value (at harvest) |
| P. guajava | D1(0.5) | 50.43 bc | 51.22 bc | 48.10 b |
D2(2.0) | 49.23 c | 51.27 bc | 46.17 bc | |
| M. indica | D1(0.5) | 51.57 b | 48.49 cd | 46.20 bc |
D2(2.0) | 49.77 bc | 47.78 de | 47.23 b | |
| O. europea | D1(0.5) | 53.25 a | 55.87 a | 53.63 a |
D2(2.0) | 50.63 bc | 52.36 b | 49.53 b | |
| C. acuminata | D1(0.5) | 39.93 d | 44.77 ef | 42.80 cd |
D2(2.0) | 38.13 de | 44.20 f | 43.30 cd | |
| Control | D1(0.5) | 37.50 e | 40.65 g | 41.63 de |
D2(2.0) | 39.33 de | 40.82 g | 38.93 e | |
| CV (%) | – | 2.49 | 3.86 | 4.22 |
| LSD | – | 1.99 | 3.19 | 3.31 |
Stem diameter
Tree effect
Different agroforestry systems showed significant variation in stem diameter of yardlong bean (Fig. 90.1). Significantly the highest stem diameter (1.60 cm) was recorded under control treatment while the lowest (0.79 cm) stem diameter of yardlong bean recorded under O. europea based agroforestry system. Under full sunlight, optimum PAR, moisture and nutrient were available which helps to increase stem diameter. Shade decreases the adequate PAR, which retard photosynthesis by rapid cell division and thus increase stem length than diameter.
Distance effect
Distance had no significant influence on stem diameter of yardlong bean. However, the highest ((1.20 cm) stem diameter was obtained at D2 distance whereas the lowest (1.10 cm) was observed at D1 distance.
Internode length
Tree effect
Upperstory agroforestry system showed significant influence on the internode length of yardlong bean. The highest (21.17 cm) internode length was recorded under O. europea based agroforestry system while the lowest (15.58 cm) was observed under control treatment.
Distance effect
No significant variation was recorded of internode length of yardlong bean as a function of distance from tree base. However, the higher internode length (18.52 cm) was observed throughout the growth period when yardlong bean grown at D1 distance from tree base.
Yield Performance
Number of fruit per plant
Tree effect
Yield components of yardlong bean were significantly influenced by different agroforestry systems. The maximum number of fruits (145.3 fruits/plant) was obtained under control treatment. A drastic reduction in the number of fruits per plant as observed under different agroforestry systems. Significantly the lowest (67.50 fruits/plant) number of fruit was recorded under O. europea based agroforestry system. Diffuse light promotes the development of vegetative structures while intense light favors the development of flowers, fruits and seeds (Weaver and Clements, 1973). Under reduced PAR levels, similar influencing pattern in number of fruits was found in some varieties of Mungbean (Miah, 2001).
Distance effect
There was no significant variation was observed of number of fruits per plant of yardlong bean when it was grown as a function of distance from tree base. The highest (101.50 fruits/plant) fruits per plant were obtained at D2 Distance while the lowest (99.53 fruits/plant) was recorded at D1 distance.
Fruit length
Tree effect
Yardlong bean fruit length was also significantly influenced by different agroforestry systems (Fig. 93.1). Fruit length increased with the increase of light levels (agroforestry systems). The highest (57.15 cm) fruit length was recorded under C. acuminata based agroforestry system whereas the lowest (48.38 cm) was observed under O. europea based agroforestry system. Under P. guajava, M. indica and C. acuminata based systems fruit length was moderate. Similar result was found in case of cucumber under reduced PAR levels (Haque, 2001).
Distance effect
There was no significant variation observed of number of fruits per plant of yardlong bean when it was grown as a function of distance from tree base . The highest (52.93 cm) fruit length was observed at D2 distance while the lowest (50.49 cm) recorded at D1 distance.
Combined effect of associated tree species and distance from tree base
Yield contributing characteristics of yardlong bean significantly influenced by the combined effect of associated tree species and distance from tree base. The highest (1.88 cm) stem diameter was obtained at D2 distance under control treatment whereas the lowest (0.73 cm) stem diameter was observed at D1 distance under O. europea based agroforestry system. Internode length of yardlong bean increased with decreasing light levels. The highest (23.05 cm) internode length of yardlong bean was recorded under O. europea based agroforestry system while the lowest (14.97 cm) was recorded at D2 distance under control treatment. Number of fruits per plant and fruit length was increased with increasing light levels. Significantly the highest number of fruit per plant and fruit length (156.70 fruits/plant and 54.80 cm respectively) were obtained at D2 distance under control treatment whereas the lowest number of fruit per plant and fruit length (62.00 fruits/plant and 47.73 cm respectively) were recorded at D1 distance under O. europea based agroforestry system.
Table 33. Combined effect between associated tree species and distance from tree base on yield contributing characteristics of yardlong bean
| Tree species | Distance from tree base (m) | Stem diameter (cm) | Internode length (cm) | Fruit number plant-1 | Fruit length (cm) |
| P. guajava | D1(0.5) | 0.95 c | 16.43 cd | 80.67 d | 50.53 b |
D2(2.0) | 0.94 cd | 16.42 cd | 90.67 c | 50.80 b | |
| M. indica | D1(0.5) | 0.77 d | 16.22 cd | 81.67 d | 49.67 b |
D2(2.0) | 0.86 c-e | 16.73 c | 68.33 ef | 49.93 b | |
| O. europea | D1(0.5) | 0.73 e | 23.05 a | 62.00 f | 47.73 b |
D2(2.0) | 0.87 c-e | 19.30 b | 73.00 de | 49.03 b | |
| C. acuminata | D1(0.5) | 1.41 b | 16.19 cd | 126.7 b | 52.50 b |
D2(2.0) | 1.52 b | 15.99 cd | 131.7 b | 51.50 b | |
| Control | D1(0.5) | 1.55 b | 15.21 d | 134.0 b | 52.63 b |
D2(2.0) | 1.88 a | 14.97 d | 156.7 a | 54.80 a | |
| CV (%) | – | 8.31 | 4.37 | 4.97 | 6.64 |
| LSD | – | 4.37 | 0.83 | 8.56 | 5.89 |
Fruit diameter
Tree effect
Fruit diameter of yardlong bean was significantly influenced by different agroforestry systems. The fruit diameter increased with decreasing shade levels. The highest fruit diameter (10.86 cm) was observed under control treatment followed by C. acuminata (8.06 cm), P. guajava (7.96 cm) and M. indica (7.37 cm) based agroforestry systems whereas the lowest (7.18 cm) was observed under O. europea based agroforestry system.
Distance effect
No significantly effect of fruit diameter was recorded when yardlong bean grown at various distances from tree base. The highest (8.73 cm) fruit diameter was recorded at D2 distance whereas the lowest (7.84 cm) was observed at D1 distance from tree base.
Single fruit weight
Tree effect
The highest (18.30 g) single fruit weight was obtained under control treatment which was followed by C. acuminata (17.97 g), while the lowest (15.80 g) was observed under O. europea based agroforestry system which was statistically similar to that of P. guajava (16.74 g) and M. indica (16.83 g) based agroforestry systems .
Distance effect
There was no significant distance effect was observed on single fruit weight of yardlong bean. The highest (17.64 g) single fruit weight was observed at D2 distance while the lowest (16.61 g) was recorded at D1 distance throughout the yardlong bean growth period.
Yield (t/ha)
Tree effect
There was significant influence on the yield o yardlong bean under different agroforestry systems. Among the treatments, the highest (14.70 t/ha) yield per hectare was recorded under control treatment and the lowest (7.79 t/ha) yield of yardlong bean was found under O. europea based agroforestry system. Under reduced light conditions translocation of the carbohydrates from source to sink is poor which reduced grain yield significantly (Murty and Murty, 1981) while the intense light favors the development of flowers, fruits and seeds (Weaver and Clements, 1973).
Distance effect
Distance had significant influence on yield of yardlong bean. The highest yield (11.50 t/ha) was obtained at D2 distance while the lowest (10.64 t/ha) was observed at D1 distance from tree base.
Combined effect between associated tree species and distance from tree base on yield and
yield contributing characteristics of yardlong bean
Combined effect of crop spacing form tree base and agroforestry systems on the fruit diameter, single fruit weight and yield of yardlong bean was highly significant (Table 34) .The highest (10.70 cm) fruit diameter was recorded at D2 distance under control treatment while the lowest (7.10 cm) was observed at D1 distance under O. europea based agroforestry system. The single fruit weight and yield were lowest (15.69 g and 7.43 t/ha respectively) at D1 distance under O. europea species whereas these was highest (19.89 g and 15.45 t/ha) at D1 distance under control treatment.
Table 34: Combined effect of associated tree species and distance from tree base on yield and yield contributing characteristics of yardlong bean
| Tree species | Distance from tree base (m) | Fruit diameter (cm) | Single fruit weight (g) | Yield (Tha-1) |
| P. guajava | D1(0.5) | 8.08 bc | 16.61 bc | 9.59 de |
D2(2.0) | 8.19 bc | 16.79 bc | 10.05 d | |
| M. indica | D1(0.5) | 7.25 c | 16.04 bc | 9.05 e |
D2(2.0) | 7.93 bc | 15.92 c | 9.55 de | |
| O. europea | D1(0.5) | 7.10 c | 15.69 c | 7.43 f |
D2(2.0) | 7.30 c | 15.78 c | 8.14 f | |
| C. acuminata | D1(0.5) | 7.44 c | 17.69 b | 12.02 c |
D2(2.0) | 7.83 bc | 17.05 bc | 14.30 b | |
| Control | D1(0.5) | 9.03 b | 19.89 a | 15.45 a |
D2(2.0) | 10.70 a | 19.81 a | 15.11 a | |
| CV (%) | – | 8.91 | 5.26 | 0.78 |
| LSD | – | 1.27 | 1.55 | 4.11 |
Light intensity
Tree effect
The relationship between days after measurement and light intensity was studied in the field of yardlong bean intercropped with different tree species. The significant effect of light intensity and days after measurement was observed as a function of associated tree species.
A little variation of light intensity was observed with the increase of day after measurement. From early stage of cropping season to the end of harvest stage, light intensity was gradually increasing. Yardlong bean was grown at the Kharif 2 season which starts from July to the middle of September. At that time the day light was gradually increasing with increasing canopy area of the tree species. The upperstorey canopy discards light penetration to the lowerstorey vegetable crops. So, light intensity was decreased gradually beneath the tree. Considering the tree species, the maximum light intensity was recorded from control treatment followed by C. acuminata based agroforestry system whose canopy area (1.70 m2) was less as compared to other agroforestry tree species. On the other hand the minimum light intensity was observed under O. europea based agroforestry system and its canopy area was 3.48 m2 and dense as compared to comparatively light canopy area of M. indica (3.58 m2) and P. guajava (4.53 m2). As a result, the trend of light intensity throughout the yardlong growing period for different tree species was control > C. acuminata >P. guajava > M. indica>O. europea.
Distance effect
Light intensity was not significantly influenced by the distance form tree base However, the highest (570.4 µmm-2s-1) light intensity was obtained at D2 distance and the lowest (562.6 µmm-2s-1) was reworded at D1 distance from tree base.
Soil moisture
Tree effect
Graphical representation of the effect of soil moisture and days after measurement on yardlong bean field was recorded and presented in the Figure 98.1. Gradual increasing trend of soil moisture was observed during cropping season and days after measurement ahead. At the initial stages of cropping season, the soil moisture in the yardlong bean field was the lowest. Those were gradually increasing and at the end of harvest stage, it was the highest. Irrigation was not given at a regular interval at that time as little rain occurs during the vegetative period of yardlong bean. So, the soil moisture was moderate. But as the cropping season ahead, irrigation was reducing gradually and at the full maturity stage it was stopped. But moderate to heavy rainfall was occurring at the full maturity stage of yardlong bean. So, soil moisture was increased as the harvestahead. When tree species takes into consideration, the maximum soil moisture was recorded under O. europea based agroforestry system followed by M. indica, P. guajava and C. acuminata. Under tree, decomposed plant litters absorbed more soil moisture which remains for a long time because of low air temperature under tree. The minimum soil moisture was observed under control treatment because of scorch sunlight evaporate large amount of soil water from upper ground of the soil. As a result the trend of soil moisture throughout the growing period for different treatment were O. europea >M. indica >P. guajava>C. acuminata>control.
Distance effect
No significant influence of soil moisture was observed at different distances from tree base. Higher soil moisture (21.53 %) was recorded at D2 distance followed by D1 distance (21.51%).
Soil temperature
Tree effect
The relationship between days after measurement and soil temperature was obtained and significant effect was observed (Fig. 99.1).
The slight variation was observed of soil temperature with the increase of days after measurement. At the initial stage, the soil temperature was higher for all the tree species. Those were decreased up to the final stage of measurement. Yardlong bean grown at Kharif 2 season which starts from July to mid September. At that time soil moisture was high which decrease the soil temperature correspondingly. Considering the tree species, the minimum soil temperature was recorded under O. europea based agroforestry system which was followed by M. indica, P. guajava and C. acuminata based agroforestry systems. The maximum soil temperature was observed under control treatment.
Distance effect
Cropping distance from tree base had opposite effect between soil temperature and soil moisture. When distance increases, the soil temperature increases by decreasing soil moisture. The highest (34.56 oC) soil temperature was obtained at D2 distance while the lowest (32.92 oC) was recorded at D1 distance from tree base.
Combined effect of associated tree species and distance from tree base on microclimatic parameters on yardlong bean
Light intensity under yardlong bean field was affected significantly by the combined effect of tree species and distance from tree base (Table 35). The highest (825.00 µmm-2s-1) light intensity was recorded at D2 distance under control treatment while the lowest (417.00 µmm-2s-1) light intensity was observed at D1 distance under O. europea based agroforestry system. Beneath the O. europea species, dense canopy retard the sunlight penetration and thus light intensity was the lowest. As distance form the tree increase light intensity increased significantly.
Soil moisture was also significantly affected by the combined effect of tree species and distance form tree base. The lowest soil moisture (20.02%) was observed at D2 distance under control treatment whereas the highest (25.89%) was recorded at D1 distance under O. europea species. At the initial stage of yardlong bean growing season, soil moisture was lower due to little or no rainfall and a little irrigation application which intern increased the soil temperature. As cropping season ahead, sufficient rainfall occurs. At that stage soil moisture was increasing which decreased soil temperature correspondingly. So, at the harvest stage of yardlong bean, soil moisture increased by decreasing soil temperature.
Combined effect of tree species and distance from tree base on the soil temperature was highly significant. The maximum (36.97 oC) soil temperature was observed at D2 distance under control treatment while the minimum (29.50 oC) was recorded at D1 distance under O. europea species based system.
The presence of soil temperature and soil moisture under the tree was vis-à-vis. Under tree, the presence of plant litters and less air temperature increase the soil moisture by decreasing the soil temperature. While under control plot, soil temperature increasing which decreased the soil moisture.
Table 35. Combined effect between associated tree species and distance from tree base on microclimatic parameters on yardlong bean field
| Tree species | Distance from tree base (m) | Light intensity (μ molm-2s-1) | Soil moisture (%) | Soil temperature (0C) |
| P. guajava | D1(0.5) | 415.70 f | 21.05 bc | 31.81 cd |
D2(2.0) | 436.00 f | 18.78 d | 33.77 bc | |
| M. indica | D1(0.5) | 433.70 f | 22.15 bc | 33.63 bc |
D2(2.0) | 533.30 e | 21.70 bc | 36.23 ab | |
| O. europea | D1(0.5) | 417.00 f | 25.89 a | 29.50 d |
D2(2.0) | 422.00 f | 22.61 b | 30.86 d | |
| C. acuminata | D1(0.5) | 670.70 d | 20.98 b-d | 33.62 bc |
D2(2.0) | 795.00 b | 20.27 cd | 34.77 ab | |
| Control | D1(0.5) | 716.70 c | 20.75 b-d | 36.23 ab |
D2(2.0) | 825.00 a | 20.02 cd | 36.97 a | |
| CV (%) | – | 2.82 | 5.48 | 4.37 |
| LSD | – | 27.37 | 2.02 | 2.53 |
Correlation between light intensity (µmm-2s-1) and yield (tha-1) of yardlong bean
A linear relationship was observed between light intensity and yield of yardlong bean under P. guajava based agroforestry system which is represented as Y = 0.0262x – 1.3556 (R2 = 0.778), where R2 value is positive and highly significant (Fig. 100). These findings indicated that increasing light intensity increased the yield of yardlong bean and majority of total variation in the yield of yardlong bean could be explained by the above equation. This equation also stated that fruit yield of yardlong bean was minimum, i.e. 9.17 t/ha at 411.00 µmm-2s-1 light intensity and above this light intensity fruit yield increased at the rate 0.0262 t/ha.
Under M. indica based agroforestry system, yield of yardlong bean was increased at the rate of 0.0055 t/ha for per unit changing of light intensity. The light intensity was the minimum under O. europea based agroforestry system compared to other agroforestry systems and yield was also increased at the rate of 0.0204 t/ha for per unit increasing of light intensity.
Yardlong bean grown under C. acuminata based agroforestry system experienced maximum light intensity. So, yield per hectare was the highest relative to P. guajava, M. indica and O. europea based agroforestry system; because of its canopy area was minimum (1.70 m2). Here, yield of yardlong bean increased by 0.0219 t/ha for per unit increasing of light intensity.
Correlation between soil moisture (%) and yield (tha-1) of yardlong bean
Correlation between soil moisture and yield of yardlong bean under P. guajava based agroforestry system showed a linear relationship and estimated as Y = 0.189x + 6.0394 (R2 = 0.9888), Where R2 is positive and highly significant. This means that increasing soil moisture increasing the yield of yardlong bean under P. guajava species . This equation also stated that yield of yardlong bean was decreased by 0.189 t/ha for per unit increasing of soil moisture. Under M. indica, O. europea and C. acuminata based agroforestry system, yardlong bean yield increased with the increasing of soil moisture and those were 0.4048 t/ha, 0.2809 t/ha and 1.3233 t/ha respectively for per unit increasing soil moisture.
Correlation between soil temperature (oC) and yield (tha-1) of yardlong bean
Linear relationship between soil temperature and yield of yardlong bean was estimated under P. guajava species as Y = -0.1761x + 15.304 (R2 = 0.5087), where R2 value was weak and negative, i.e. decreasing soil temperature decreased the yield of yardlong bean under P. guajava based agroforestry system. The R2 value indicated that about 51% of the contribution to the yield of yardlong bean can be explained by the soil temperature. The relationship also stated that the yield of yardlong bean decreasing at the rate of 0.1761 t/ha for per unit decreasing of soil temperature.
Similar linear relationship between soil temperature and yield of yardlong bean were estimated as Y = -0.2421x + 17.834 (R2 = 0.6434) for M. indica, Y= -0.2025x + 14.533 (R2 = 0.6787) for O. europea and Y = -0.8909 + 43.898 (R2 = 0.4755) for C. acuminata. The R2 values of these agroforestry systems were negative and weak. The relationship also stated that the yield of yardlong bean under M. indica, O. europea and C. acuminata based agroforestry systems were increased at the rate of 0.0.2421 t/ha, 0.2025 t/ha and 0.8909 t/ha respectively for per unit decreasing of percent soil temperature.
Correlation between canopy volume (m2) and yield (tha-1) of yardlong bean
Liner relationship between canopy volume and yield of yardlong bean for four agroforestry systems were estimated as Y = -7439 x + 15.209 (R2 = 0.6284) for P. guajava, Y = -2.5532 x + 26.491 (R2 = 0.8249) for M. indica, Y = -3.3869 x + 21.474 (R2 = 0.8691) for O. europea, and Y = -3.4565 x + 19.592 (R2 = 0.7742) for C. acuminata based agroforestry systems. The R2 value of these equations for P. guajava, M. indica, O. europea and C. acuminata were about 0.6284, 0.8249, 0.8691 and 0.7742 respectively which were negative and significant. The R2 values indicated that about 63%, 83%, 87% and 77%yield under P. guajava, M. indica, O. europea and C. acuminata were attributed due to percent canopy volume. The relationship also stated that the yield of yardlong bean under P. guajava, M. indica, O. europea and C. acuminata were reduced at the rate of 0.7439 t/ha, 2.5532 t/ha, 3.3869 t/ha and 3.4565 t/ha respectively for per unit changing of percent canopy volume.